Article Text

Abstract
Background: Oasys-2 is a validated diagnostic aid for occupational asthma that interprets peak expiratory flow (PEF) records as well as generating summary plots. The system removes inconsistency in interpretation, which is important if there is limited agreement between experts. A study was undertaken to assess the level of agreement between expert clinicians interpreting serial PEF measurements in relation to work exposure and to compare the responses given by Oasys-2.
Method: 35 PEF records from workers under investigation for suspected occupational asthma were available for review. Records included details of nature of work, intercurrent illness, drug therapy, predicted PEF, rest periods, and holidays. Simple plots of PEF and the Oasys-2 generated plots were available. Experts were advised that approximately 1 hour was available to review the records. They were asked to score each work-rest-work (WRW) period and each rest-work-rest (RWR) period for evidence of occupational effect. At the end of each record scores of 0–100% were given for evidence of “asthma” and “occupational effect” for the whole record. Kappa values were calculated for each scored period and for the opinions on the whole record. The scores were converted into four groups (0–25%, 26–50%, 51–75%, 76–100%) and two groups (0–50% and 51–100%) for analysis. This is relevant to scores produced by Oasys-2. Agreement between Oasys-2 scores and each expert was calculated.
Results: 24 of 35 records were analysed by seven experts in the allotted time. For whole record occupational effect, median kappa values were 0.83 (range 0.56–0.94) for two groups and 0.62 (0.11–0.83) for four groups. For asthma, median kappa values were 0.58 (0–0.67) and 0.42 (0.15–0.70) for two and four groups respectively. For all WRW and RWR periods kappa values were 0.84 (0.42–0.94) and 0.70 (0.46–0.87) respectively. Agreement between Oasys-2 and individual experts showed a median kappa value of 0.75 (0.50–0.92) for two groups and 0.50 (0.39–0.70) for four groups. Kappa values for the median expert score v Oasys-2 were 0.75 for two groups and 0.67 for four groups. Agreement was poor for records with intermediate probability, as defined by Oasys-2.
Conclusion: Considerable variation in agreement was seen in expert interpretation of occupational PEF records which may lead to inconsistencies in diagnosis of occupational asthma. There is a need for an objective scoring system which removes human variability, such as that provided by Oasys-2.
- occupational asthma
- peak expiratory flow
- inter-observer variation
- Oasys-2
Statistics from Altmetric.com
The interpretation of peak expiratory flow (PEF) records taken for the diagnosis of occupational airways disease is difficult and best left to expert observers. Most occupational physicians who employ this method in their diagnostic work-up use some form of graphical representation,1–3 but interpretation still depends upon pattern recognition which may vary between and within experts.4 Oasys-2 (Occupation Asthma SYStem) is a computer program developed to assist in the diagnosis of occupational asthma by analysis of PEF records. The system has a sensitivity of 75% and specificity of 94% for detection of occupational asthma using discriminant analysis.5 It generates summary plots of PEF records, comments on quality of records, and gives a score depending on the likelihood of occupational effect from 1 (least likely) to 4 (certain). The results of the Oasys-2 interpretation of PEF plots are generated according to formulae and are therefore reproducible. This feature may be important if the level of agreement between experts in interpreting PEF records is limited. The primary aim of the present study was to measure the level of agreement between expert clinicians when interpreting peak flow records. A secondary aim was to compare each expert with the score given by Oasys-2.
METHOD
Clinicians expert in the diagnosis of occupational asthma were asked to spend 1 hour reviewing 35 original peak flow records from patients under investigation for suspected occupational asthma. The records were selected at random and were not selected “difficult cases”. They included details of nature of work, intercurrent illness, drug therapy, predicted peak flow, rest periods, and holidays. Simple plots of peak flow (fig 1) and Oasys-2 generated summary plots were available (fig 2). The latter included plots of daily minimum, mean and maximum PEF; number of recordings each day; and measures of diurnal variation. Each expert was asked to score every work-rest-work (WRW) complex (two periods of days at work, separated by a period of days away from work) and every rest-work-rest (RWR) complex (two periods of days away from work, separated by a period at work) for likelihood of occupational effect (scale 0–100). At the end of each record they were asked to give two separate overall scores for “occupational effect” and “asthma” (scale 0–100). Experts were not asked to score in any other way other than 0–100 and they were not aware how the analysis would proceed. They were not aware that they would be compared with Oasys-2.
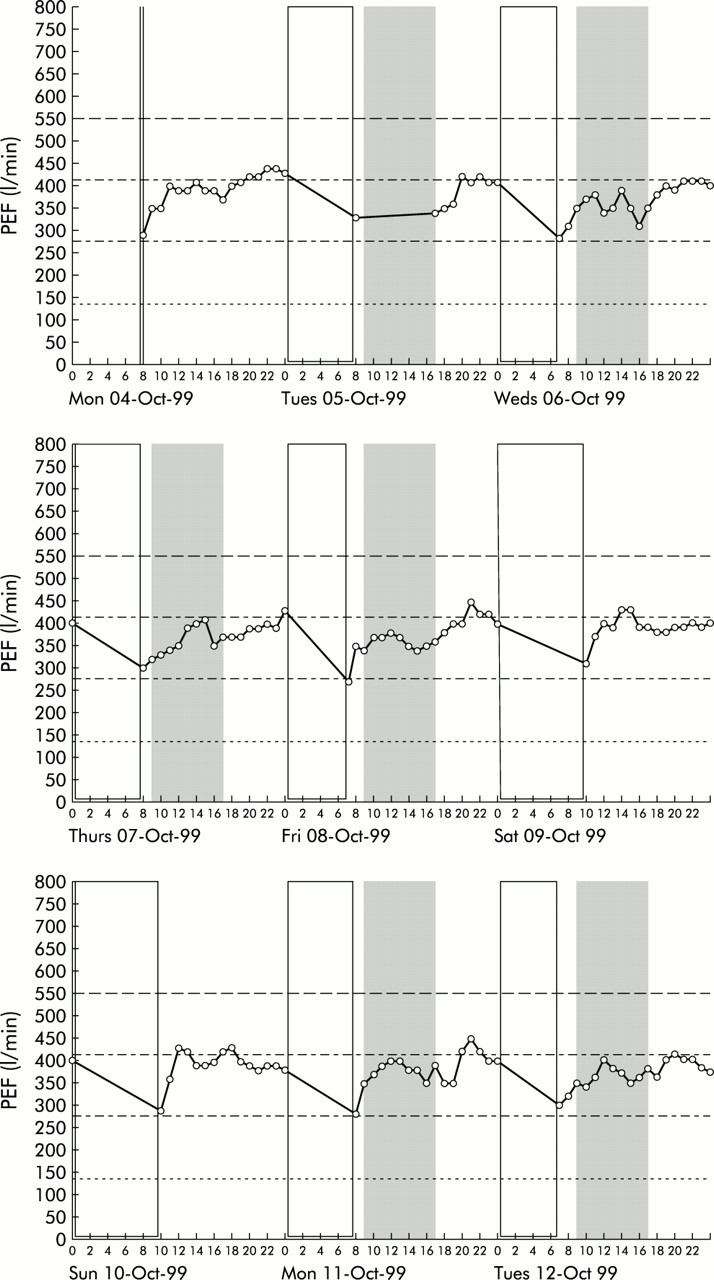
Simple plots of peak flow (half of record). Shaded areas represent time at work.
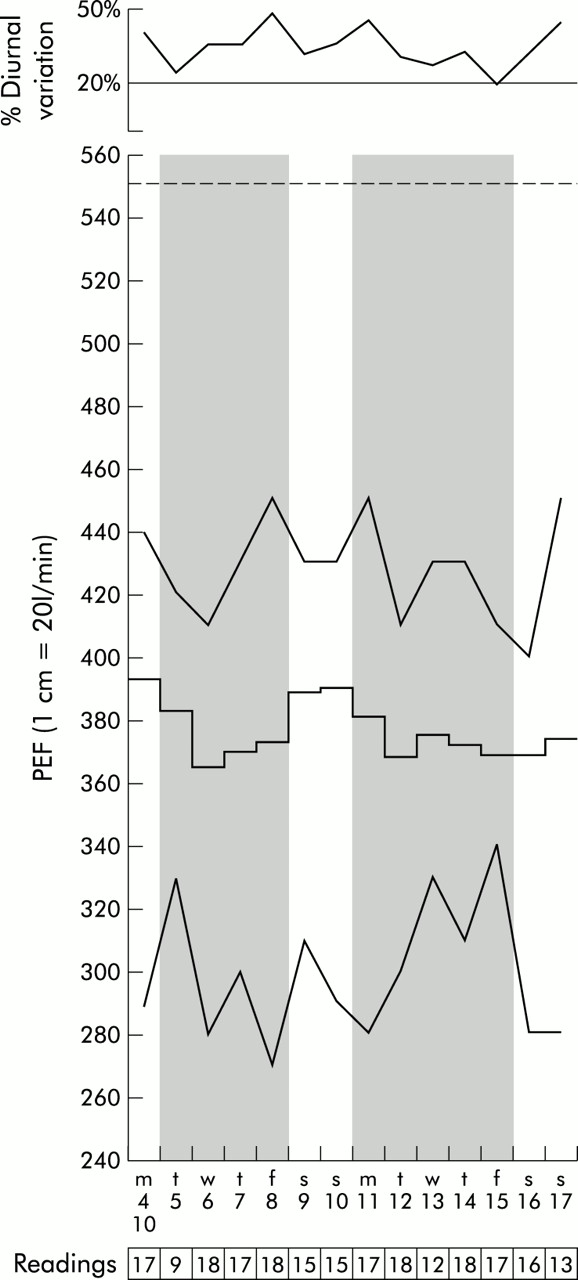
Oasys-2 plot of the same patient as in fig 1 (complete record). The upper panel shows daily diurnal variation, expressed as percentage predicted. The central panel shows daily maximum, mean and minimum PEF, days “interpreted” to start with the first reading at work and stop with the last reading before work on the next day. Days at work have a shaded background, days away from work a clear background. The bottom panel shows the date and the number of readings each day.
Each expert was also asked to comment if they felt the record was invalidated by any of the confounding factors they recognised.
Statistical analysis
Kappa values were calculated for each scored period and for the opinion on the whole record. Each expert was compared with others and median values calculated. Oasys-2 gives scores to two decimal places from 1 (no occupational effect) to 4. To allow comparison with the experts’ scores they were also converted into percentages using the following formula:
Two analyses were performed, one with two and one with four groups. Firstly, expert scores were split into two groups (0–50% and 51–100%) which correspond to predictions of occupational effect given by Oasys-2 which equate to a cut off score of 2.5. At this score the positive predictive value of Oasys-2 is 92% and negative predictive value is 80%.5 Expert scores were also converted into four groups (0–25%, 26–50%, 51–75%, and 76–100%). These scores represent negative, possible, probable, and positive, respectively, and also correspond to different levels of sensitivity and specificity of Oasys-2.4 Median expert scores were generated for whole record occupational effect and these were tested for agreement with the Oasys-2 score by calculating kappa values.
RESULTS
Agreement between experts
Only two experts were able to score all 35 records within an hour. Eight completed 13 records and seven completed 24. The results are based on the seven experts who completed 24 records.
Table 1 shows that agreement between experts for an occupational effect, as shown by median kappa value, was good. However, the range of values is very wide, indicating how inconsistent that agreement was. Kappa values were lower for asthma.
Kappa values of agreement between the seven experts who completed 24 records
Reason for disagreement
Seven records were identified where there were clear disagreements within experts and between the Oasys-2 score. Four of the records were felt to be similar in the pattern of peak flow (low diurnal variation) and it was noted that each expert was consistent in their scoring for these records, even though there was disagreement. For one record where one expert differed from the rest, it was felt that this was a genuine matter of interpretation of the changes in peak flow which were not typical, but could represent occupational effect. A further record was extremely difficult to interpret because of possible confounders with low number of records, variable treatment, and a respiratory tract infection. One disagreement was felt to be a genuine error by the expert. Examples of peak flow records where experts disagreed are shown in figs 3 and 4. The reasons for the poor agreement between experts on occupational effect were found to be consistent with experts either missing changes regarded as significant by others, or finding other reasons to increase the likelihood of an occupational effect.

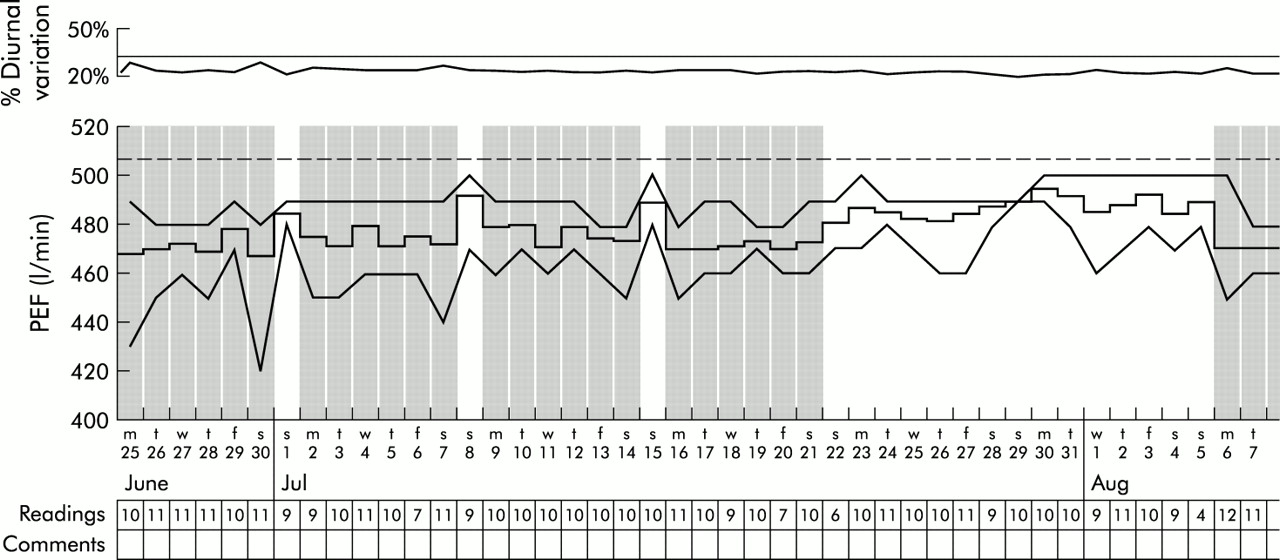
Peak flow recording (Oasys plot) showing low diurnal variation. One expert scored this record as positive for occupational effect, another gave it a score of 50%, and the rest less than 30%.
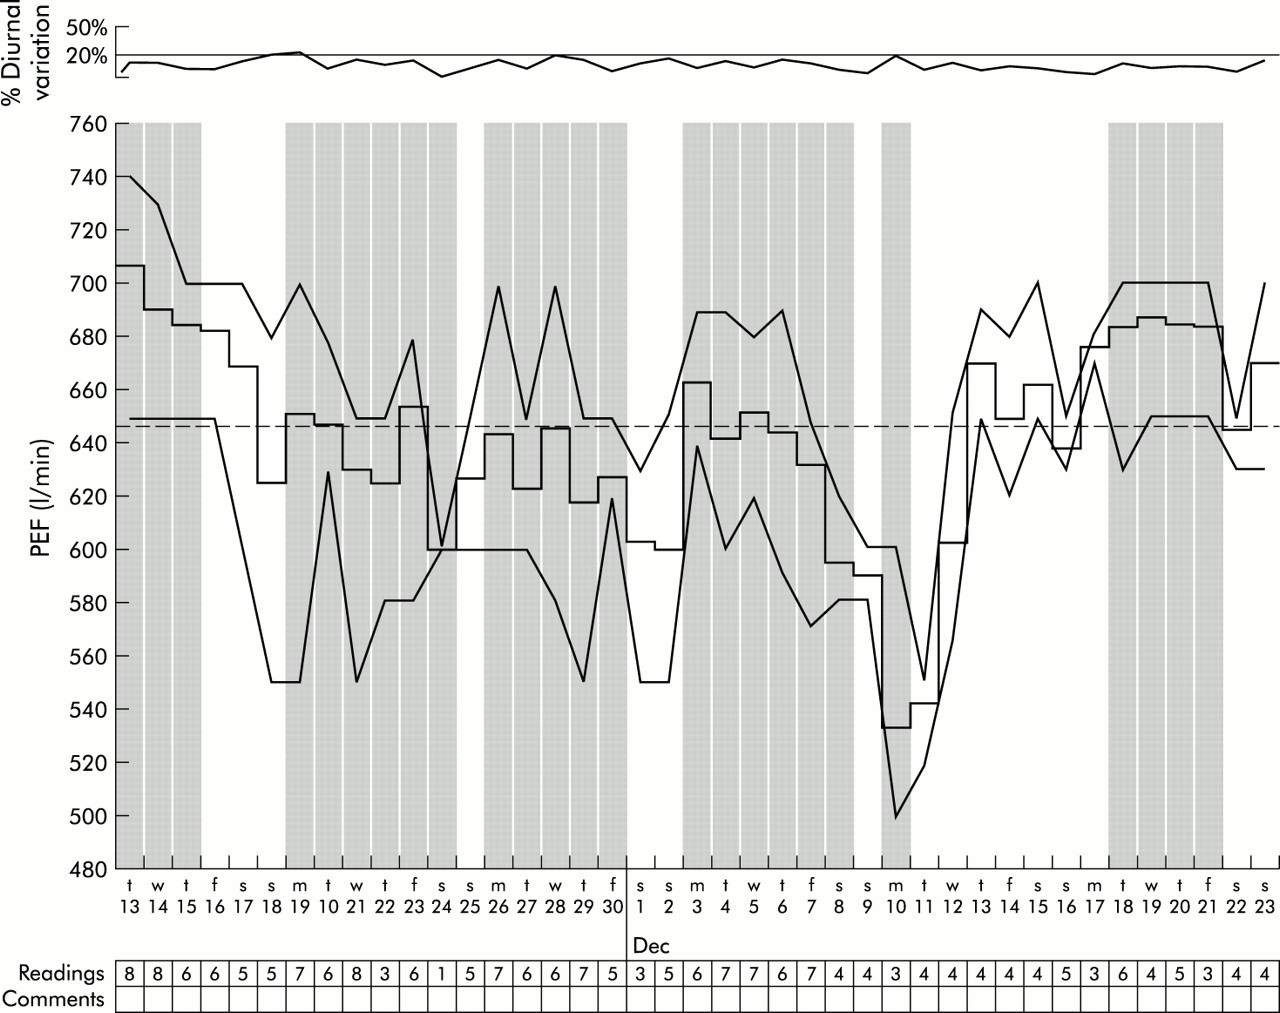
Oasys plot showing an asthmatic patient with confounding factors including a respiratory tract infection and variable treatment. There are also low numbers of daily measurements. Experts were very divided on their interpretation of this record.
Agreement between Oasys-2 and individual experts
The comparison of Oasys-2 with each expert for whole record occupational effect revealed that experts were able to achieve median kappa values of 0.75 for two groups and 0.50 for four groups (table 2). For four groups, any one of all experts disagreed with Oasys-2 in 19 of 24 cases and, for two groups, any one expert disagreed with Oasys-2 in 10 of 24. Kappa values for median expert scores v Oasys-2 were 0.75 for two groups and 0.67 for four groups. There was general underscoring of the records compared with Oasys-2 (fig 5) with consistent differences between experts, some generally scoring higher than others. This explains why experts seemed to agree better between themselves than with Oasys-2.
Agreement between experts and Oasys-2

Median expert scores v Oasys-2. Where experts disagreed with Oasys, they underscored records and were thus missing occupational effect.
No records were considered invalidated by the experts, but some were correctly noted to have missing values (not by all experts). Change of therapy, variable exposure, and suspected respiratory tract infection were all noted, but not by all experts.
DISCUSSION
This study has shown that, when experts recognised in the field of occupational medicine are asked to interpret PEF records which they use regularly in clinical practice, the level of agreement about what they mean is relatively low. Correct interpretation of PEF records is essential if they are to be an accurate measure of occupational airways disease.1–3 PEF records are not universally employed by occupational physicians because of doubts about their reliability.6,7 Falsification of records has been cited as one reason for unreliability,6 but there are many other reasons why a record may be invalidated. These include respiratory tract infections, “laze effect” (where PEF gradually reduces due to lack of effort), “learn effect” (where PEF improves at the start of a record due to improved technique), changes of treatment, missing records, rounding figures to nearest values, and failure to identify variable exposures to allergens or irritants.
This study has identified clearly a further source of error that cannot be rectified by repeating the record: inter-observer variation. Agreement between experts was highly variable, particularly for four groups, and agreement was improved (for four groups) if the median expert scores were compared with Oasys-2. Individual experts varied in their level of scoring, some tending to score higher than others but no expert consistently scored higher than Oasys-2. Furthermore, Oasys-2 has been shown to underscore compared with gold standard diagnoses such as specific bronchial provocation testing, but has high specificity. This suggests that Oasys-2 is not missing factors in the record which experts interpret as an occupational effect. The difference between scorers was similar to that found in experts reading chest radiographs using the ILO classification.8 Other studies have shown slightly better agreement where a small number of experts have been compared.9,10 Agreement about the presence of asthma was even lower, reflecting the difficulty in diagnosing asthma from PEF records. Agreement was poor even for the six records where Oasys-2 scored a high probability of occupational effect; for these records there was complete agreement between experts in only three cases.
Experts were encouraged to complete their analyses in 1 hour. This could have had the effect of rushing experts and have reduced the quality of their assessments. However, in clinical practice records are often assessed at the sort of speed encountered in the study and a more ponderous approach may not have reflected the real world. A prolonged assessment of a record may not give the best result, especially where pattern recognition is employed. The fact that most experts only completed two thirds of the records in 1 hour is of interest in itself.
The sensitivity and specificity of Oasys-2 are established and are not subject to the observer variation shown here. Oasys-2 is less useful where a PEF record is indeterminate, except that it indicates that such a record is not useful for diagnosis and that an alternative measure is required such as recording before, during, and after a 2 week period removed from exposure. In the intermediate records experts were very variable in their responses which, in clinical practice, might lead to misdiagnosis. Identification of indeterminate records might therefore be an important function to prevent incorrect conclusions.
This study has identified differences in the interpretation of occupational PEF records by expert clinicians. Observer variation alone may account for difficulties which some have with the use of this method in the diagnosis of occupational airways disease.6,7 The solution to this problem is to standardise the interpretation of the records with computer systems such as Oasys-2.
REFERENCES
Footnotes
-
Funding source: none
-
Conflict of interest: none