Article Text

Abstract
Background: Transforming growth factor beta (TGFβ) upregulates a number of smooth muscle specific genes in (myo)fibroblasts. As asthma is characterised by an increase in airway smooth muscle, we postulated that TGFβ2 favours differentiation of asthmatic (myo)fibroblasts towards a smooth muscle phenotype.
Methods: Primary fibroblasts were grown from bronchial biopsy specimens from normal (n = 6) and asthmatic (n = 7) donors and treated with TGFβ2 to induce myofibroblast differentiation. The most stable genes for normalisation were identified using RT-qPCR and the geNorm software applied to a panel of 12 “housekeeping” genes. Expression of α-smooth muscle actin (αSMA), heavy chain myosin (HCM), calponin 1 (CPN 1), desmin, and γ-actin were measured by RT-qPCR. Protein expression was assessed by immunocytochemistry and western blotting.
Results: Phospholipase A2 and ubiquitin C were identified as the most stably expressed and practically useful genes for normalisation of gene expression during myofibroblast differentiation. TGFβ2 induced mRNA expression for all five smooth muscle related transcripts; αSMA, HCM and CPN 1 protein were also increased but desmin protein was not detectable. Although there was no difference in basal expression, HCM, CPN 1 and desmin were induced to a significantly greater extent in asthmatic fibroblasts than in those from normal controls (p = 0.041 and 0.011, respectively).
Conclusions: Although TGFβ2 induced the transcription of several smooth muscle related genes, not all were translated into protein. Thus, while TGFβ2 is unable to induce a bona fide smooth muscle cell phenotype, it may “prime” (myo)fibroblasts for further differentiation, especially if the cells are derived from asthmatic airways.
- CPN 1, calponin 1
- DMEM, Dulbecco’s modified Eagle’s medium
- FBS, fetal bovine serum
- HCM, heavy chain myosin
- RT-qPCR, reverse transcription quantitative polymerase chain reaction
- SFM, serum free medium
- SMA, smooth muscle actin
- TGFβ, transforming growth factor β
- asthma
- smooth muscle markers
- transforming growth factor β
Statistics from Altmetric.com
- CPN 1, calponin 1
- DMEM, Dulbecco’s modified Eagle’s medium
- FBS, fetal bovine serum
- HCM, heavy chain myosin
- RT-qPCR, reverse transcription quantitative polymerase chain reaction
- SFM, serum free medium
- SMA, smooth muscle actin
- TGFβ, transforming growth factor β
Bronchial hyperresponsiveness (BHR) is a fundamental abnormality in asthma which is increased in proportion to disease severity and is functionally antagonised by β2 agonists. The mechanisms underlying BHR are not known for certain, but an increase in airway smooth muscle is considered important.1 In diseases such as pulmonary hypertension, the increase in smooth muscle bulk has been attributed in part to the recruitment of activated fibroblasts termed myofibroblasts which align with resident smooth muscle and differentiate further to contribute to the smooth muscle.2 Although asthma is also characterised by an increase in myofibroblast numbers,3 the relationship between myofibroblasts and smooth muscle cells has not been extensively explored.
The myofibroblast is often described as possessing a phenotype between that of a fibroblast and a smooth muscle cell. Classically, the presence of alpha smooth muscle actin (αSMA) has been considered a marker of myofibroblast differentiation. However, myofibroblasts do not always express αSMA in vivo.4,5 Cells containing stress fibres including cytoplasmic actins are termed “proto-myofibroblasts”, while those containing stress fibres including αSMA are termed “differentiated myofibroblasts”. Although several factors induce the differentiation of fibroblasts into proto-myofibroblasts,6 by far the most potent inducer in vitro is TGFβ1.7,8,9,10 This profibrogenic growth factor is increased in asthma and has been associated with myofibroblast proliferation and airway remodelling.3 In particular, the TGFβ2 isoform has been implicated in the pathogenesis of asthma due to its release from damaged epithelial cells.11
Microarray analysis of gene expression in fetal lung fibroblasts identified several smooth muscle associated genes including heavy chain myosin (HCM), calponin 1 (CPN 1), and smoothelin (previously considered a smooth muscle specific gene12) that were upregulated in response to TGFβ1. These observations were confirmed at the protein level in adult fibroblasts.7 Work with animal models has highlighted similar phenotypic switching in vivo. For example, in a rabbit model of serosal thickening, smooth muscle-like cells were seen to develop from fibroblasts and expressed a full range of smooth muscle specific markers including desmin.13 Such findings suggest the possibility of a complete phenotypic switch from fibroblast to smooth muscle cell.
Recognising the importance of smooth muscle in asthma, we postulated that TGFβ2 promotes differentiation of asthmatic (myo)fibroblasts into smooth muscle cells at both mRNA and protein levels. To achieve accurate quantitation of the expression of smooth muscle related transcripts, we used the geNorm software to establish the optimum housekeeping genes for use in our differentiation model. Although we found that smooth muscle transcripts were upregulated by TGFβ2, protein expression was not detectable in all cases. We propose a model whereby TGFβ2 induces the myofibroblast phenotype while priming the cell for further differentiation into a smooth muscle phenotype. This is consistent with a recently published model for smooth muscle differentiation that suggests that de novo transcription of mRNA is not an essential prerequisite for the differentiation of smooth muscle to a contractile phenotype.14
METHODS
Primary bronchial fibroblast cultures
Fibroblasts were grown from bronchial biopsy specimens obtained from normal (n = 6) or asthmatic (n = 7) volunteers by fibreoptic bronchoscopy following standard guidelines.15 The normal subjects (4:2 M:F, mean age 21 (range 20–21) years) had a mean (SD) forced expiratory volume in 1 second (FEV1) of 97.3 (5.2)% predicted and the asthmatic subjects (4:3 M:F, mean age 21 (range 20–26)) had an FEV1 of 76.4 (7.1)% predicted. Asthmatic subjects were using β2 agonists only, as required. Primary fibroblast cultures were established as previously described16 and were used between passage 2 and 7; typically, all cells were positive for vimentin and <1% of cells were αSMA positive in the absence of TGFβ2.
To induce myofibroblast differentiation, fibroblasts were seeded onto collagen coated (30 μg/ml Vitrogen in H2O; Nutacon, Leimuiden, The Netherlands) dishes and grown to 80–95% confluence before serum starvation (Ultraculture; Biowhittaker, Wokingham, UK) for 24 hours followed by treatment with TGFβ2 (Sigma, Poole, UK).
RNA extraction and reverse transcription
RNA was extracted using TRIzol reagent (Invitrogen, Paisley, UK) and contaminating DNA removed using DNase (Ambion, Austin, USA) according to the manufacturer’s instructions. 1 μg total RNA was reverse transcribed using 1 mM dNTP (Invitrogen, Paisley, UK), 3 ng random hexamer primer (MWG Biotech, Milton Keynes, UK), and 100 U M-MLV RT enzyme (Promega, Chilworth, UK) according to the manufacturers’ instructions.
Real-time qPCR analysis and normalisation using genNorm
To establish the most stable genes for normalising, control gene expression was measured in 12 fibroblast cultures before and after myofibroblast differentiation. Twelve normalising genes (Eurogentech, Seraing, Belgium) were selected for analysis; 18S ribosomal RNA (18S), 28S ribosomal RNA (28S), beta actin (ACTβ), glyceraldehyde-3-phosphate (GAPDH), ubiquitin C (UBC), beta-2-microglobulin (B2M), phospholipase A2 (A2), ribosomal protein L13a (RPL13A), succinate dehydrogenase (SDHA), hypoxanthine phosphoribosyl-transferase 1 (HPRT1), TATA box binding protein (TBP), and hydroxymethyl bilane synthase (HMBS). To validate these assays for use with the ΔCT method, melt curve analyses were performed to determine specificity and standard curves plotted as CT value versus log dilution from serially diluted cDNA. From these data the priming efficiency was calculated according to the formula (10(−1/gradient)) − 1 and was found to be close to the theoretical maximum for each assay. Target genes were analysed in the same way and validated for ΔCT based methods of quantification.
geNorm analysis was performed using the geNorm applet (http://medgen31.ugent.be/jvdesomp/genorm/) according to the guidelines and theoretical framework previously described.17 This approach is based on the principle that, regardless of conditions, the expression ratio of two ideal normalising genes will remain constant in all samples. Hence any variation in expression ratio between the two is indicative of one (or both) genes being variably expressed. In brief, for each normalising gene, ΔCT calculations were performed relative to the strongest signal which was assigned the value 1 and these data used as the input for geNorm. Output files rating gene stability (M) and variation in normalising signal (NF) were collected for fibroblasts, myofibroblasts, and the combined data set for both (fig 1).

Stability of constitutively expressed housekeeping genes measured in fibroblasts, myofibroblasts, and in a combined data set using geNorm software. The M value is calculated based on the changing ratios of genes in the analysis as previously described,17 such that lower M values indicate more stably expressed genes and an M value of <0.5 indicates a relatively stable control gene.
For detection of the smooth muscle related genes, αSMA, HCM, calponin 1, desmin, and γ-actin primers and fluorogenic probes labelled with the 5′ reporter dye 6-carboxy-fluorescein (FAM) and the 3′ quencher dye 6-carboxy-N,N,N′,N′-tetramethyl-rhodamine (TAMRA) were designed using beacon designer 2.1 (Premier Bio-soft). The sequences were as shown in table 1.
Primer sequences used in study
For each sample the PCR reaction was performed in duplicate and contained 25 ng cDNA template, 3 pmol fluorogenic probe, 15 pmol forward and reverse primers, 12.5 μl universal qPCR master mix (Eurogentech, Seraing, Belgium), made up to 25 μl with water. RT negative samples confirmed that the signals were not due to genomic contamination. The PCR cycling conditions were 95°C for 10 minutes followed by 42 cycles of denaturation at 95°C for 15 seconds and annealing/extension at 60°C for 1 minute. Quantitation and real time detection of the PCR products was followed on an icycler IQ real time detection system (Bio-rad, Hemel Hempstead, UK).
Based on the geNorm analysis (fig 1), the geometric mean of UBC and A2 was used as the normalising signal. Data were either analysed relative to the geometric mean of UBC and A2 using a standard ΔCT calculation or normalised to the geometric mean of UBC and A2 and expressed relative to the signal obtained for the average of the untreated time zero controls using a ΔΔCT calculation.
Immunocytochemistry
Cells were fixed in acetone and air dried prior to rehydration for immunocytochemical staining using the following primary antibodies: anti-αSMA (1:500), anti-HCM (1:100), anti-calponin 1 (1:200), anti-desmin (1:40) (all antibodies were from Sigma, Poole, UK) with anti-mouse horseradish peroxidase conjugated secondary antibody (1:100; Dako, Glostrup, Denmark).
Western blotting
Cell lysates were prepared in SDS buffer (0.3 M Tris-HCl pH 6.8, 50% glycerol, 25% 2-mercaptoethanol, 10% SDS, 0.01% bromophenol blue) containing protease inhibitors. Samples were subjected to SDS-PAGE in 12.5% polyacrylamide gels and then transferred onto PVDF membranes (Amersham) for immunoblotting using antibodies against αSMA (1:5000), CPN 1 (1:10 000), β-actin (1:20 000) with ECL detection. Semiquantitative analysis of protein expression was performed by densitometry using Genetools software (Syngene, Cambridge, UK); during this analysis the operator was blinded to the identity of the samples. Since β-actin was relatively stably expressed during TGFβ2 induced myofibroblast differentiation, it was used to control for protein loading. Data are expressed relative to time zero control and are presented as box and whisker plots showing the median and interquartile range with 95% confidence intervals.
Statistical analyses
Data were analysed using non-parametric tests for within (Wilcoxon signed rank test) or between (Mann-Whitney U test) group comparisons using SPSS for Windows Version 11.5 (Chicago, IL, USA).
Ethical approval was obtained from the Southampton and South West Hampshire joint ethics committee.
RESULTS
RT-qPCR was used to determine basal and stimulated mRNA expression of smooth muscle related transcripts. However, accurate gene quantification can be problematical and is especially difficult when quantifying changes in expression occurring during the process of differentiation as “housekeeping” genes used to normalise signals are also likely to be regulated during differentiation. In addition, rates of proliferation and overall transcriptional activity within primary cell cultures tend to be highly variable. For these reasons, we considered it particularly important to establish which housekeeping genes were the most suitable for our purposes.
geNorm analysis of control genes
The geNorm analysis compares the ratio of the ratio of control genes in different samples to find those that are most stable, as previously described.17 The 12 normalising genes were rated for stability (M) with the most stable producing the lowest M value (fig 1). Analysis of fibroblasts and myofibroblasts produced contrasting orders of gene stability although we consistently found that HPRT1 and RPL13A were the least stable genes and were therefore unsuitable for use as normalising genes to measure fibroblast/myofibroblast differentiation. Combining the two data sets produced a third sequence of gene stability ratings indicating the genes that are most stable during the differentiation of fibroblasts to myofibroblasts. In all cases the four best genes gave M values <0.5, indicating that they are reasonably stable. The top two genes cannot be ranked in order because of the requirement for a gene ratio to calculate gene stability. The pairwise variation analysis in normalising signal (NFn) was also calculated for the three data sets using geNorm. This measure shows the degree of variation in normalisation signal that is achieved by using n control genes compared to n+1, with genes added stepwise into the analysis in the order of their gene stability rankings (fig 2). The stability of the normalisation signal improves up to the addition of the eighth gene and then deteriorates as the four least stable genes are added to the analysis. In all three cases the top three genes gave values close to the recommended threshold of 0.15 for accurate normalisation. Based on these findings, we chose to use the geometric mean of A2 and UBC for our subsequent analyses.
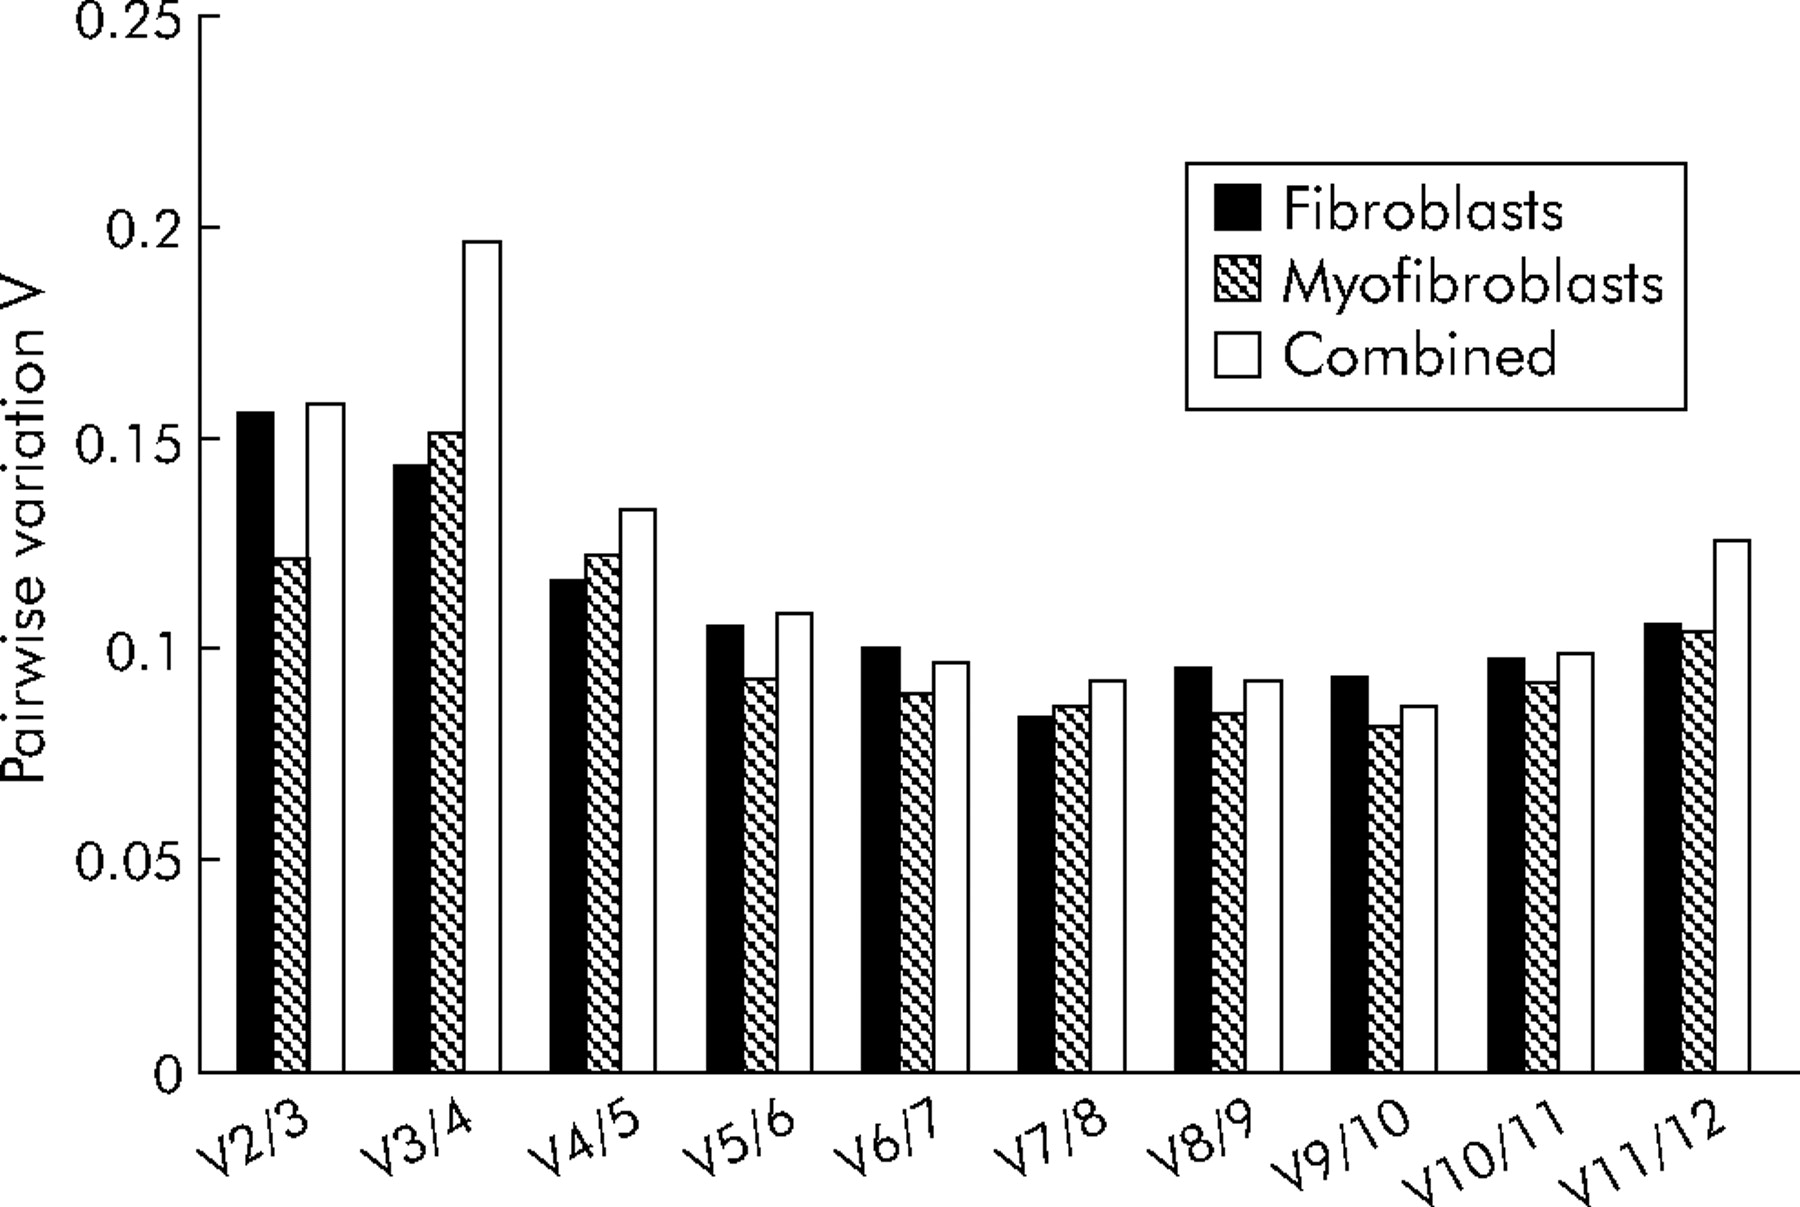
Pairwise variations in the normalising signal (NF) derived using different numbers of control genes calculated using geNorm software. This measure shows the degree of variation in normalisation signal that is achieved by using n control genes compared with n+1. Control genes are added to the analysis in the order of decreasing stability as determined above (fig 1) and a change in NF with n genes compared with NF using n+1 genes. Changes in the NF value of <0.15 are considered ideal for accurate normalisation.
Smooth muscle related transcript expression in fibroblasts
Basal mRNA expression of smooth muscle related transcripts in undifferentiated fibroblast cultures was quantified relative to UBC and A2. Since these housekeeping genes are highly abundant, expression relative to these controls gives some indication of the overall expression level of target genes (fig 3). αSMA was highly expressed at the mRNA level in fibroblast cultures with a ratio of approximately 1:1 relative to the geometric mean of UBC and A2. CPN 1 and γ-actin were also expressed relatively abundantly while both HCM and desmin showed very low basal transcription. No difference in the levels of any smooth muscle related transcripts was detected between asthmatic or healthy control cells.

(A) Steady state levels of mRNA expression of smooth muscle cell markers in fibroblasts from asthmatic subjects (light grey boxes) and healthy controls (dark grey boxes) relative to the geometric mean of the highly abundant and constitutively expressed genes A2 and UBC. αSMA was expressed at an equivalent level (ratio of 1:1) while HC myosin and desmin mRNA were comparatively rare transcripts. Calponin and γ-actin were moderately highly expressed, being approximately 10 fold less that A2/UBC. (B) TGFβ2 induced mRNA expression of smooth muscle related transcripts in asthmatic and healthy control fibroblasts relative to the geometric mean of the highly abundant and constitute expressed genes A2 and UBC. Data were analysed using a Mann-Whitney U test.
Induction of smooth muscle related transcripts in response to TGFβ2 induced myofibroblast differentiation
Expression of all five smooth muscle related transcripts increased significantly from baseline after 24 hours of treatment with 0.04 nM or 0.4 nM TGFβ2 (p<0.05 in all cases, fig 4). Further changes in expression occurred over the next 24 hours and were dependent on TGFβ2 dose, the origin of the cells, and the target gene. A dose of 0.04 nM TGFβ2 was sufficient to cause maximal induction of αSMA and γ-actin expression in asthmatic fibroblast cultures (fig 4) although, in control fibroblasts, increasing TGFβ2 to 0.4 nM caused a further increase in αSMA and γ-actin expression. Expression of HCM, CPN 1, and desmin increased with increasing TGFβ2 doses in all cultures. A lower dose of TGFβ2 (0.004 nM) did not cause a significant induction of any of the genes compared with the untreated controls, although there was a trend for an increase in gene expression at 24 hours which had diminished by 48 hours.

Levels of mRNA expression for αSMA (A, B) and calponin 1 (C, D) measured in healthy control (n = 7) and asthmatic (n = 6) fibroblast cultures either untreated or treated with 0.004, 0.04 and 0.4 nM TGFβ2 at 0, 24 and 48 hours after treatment. The levels of expression were normalised to the geometric mean of A2 and UBC and expressed relative to the median ΔCt value for the untreated time zero controls. Asterisks indicate the earliest time point and lowest TGFβ2 concentration at which a significant increase in mRNA expression was achieved (A: p = 0.044; B: p = 0.049; C: p = 0.042; D: p = 0.044).
A number of disease related differences in smooth muscle related transcript expression were detected in the cultures (fig 3B). αSMA and γ-actin gene expression were maximally induced at 0.04 nM TGFβ2 in asthmatic myofibroblasts while higher doses of TGFβ2 further induced expression in healthy control fibroblasts (fig 4). The expression of HCM, CPN 1, and desmin mRNA was induced to a significantly greater extent in asthmatic myofibroblasts than in normal controls (p = 0.041, 0.011 and 0.024, respectively) when treated with either 0.04 nM TGFβ2 or 0.4 nM TGFβ2 for 48 hours (fig 3B). γ-Actin mRNA expression was induced to a significantly greater extent by 0.04 nM TGFβ2 treatment for 24 hours in asthmatic fibroblast cultures than in healthy controls.
Smooth muscle related transcript protein expression in myofibroblasts
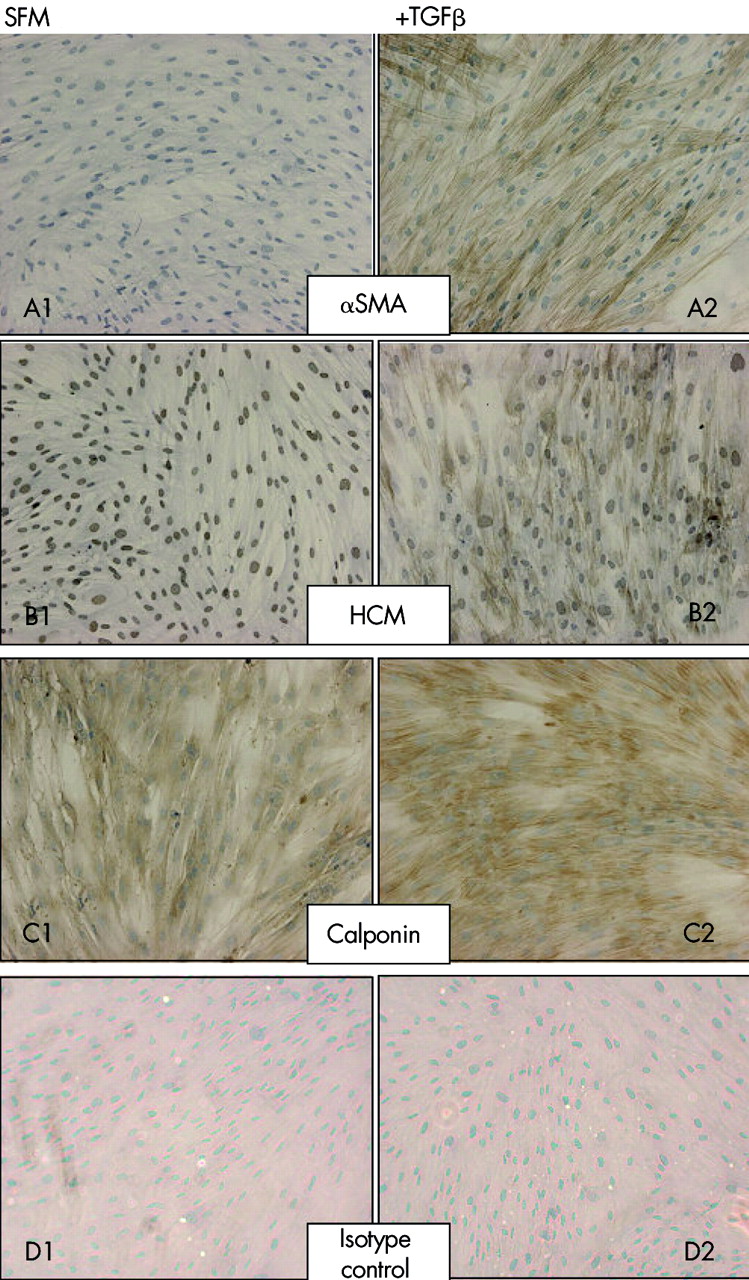
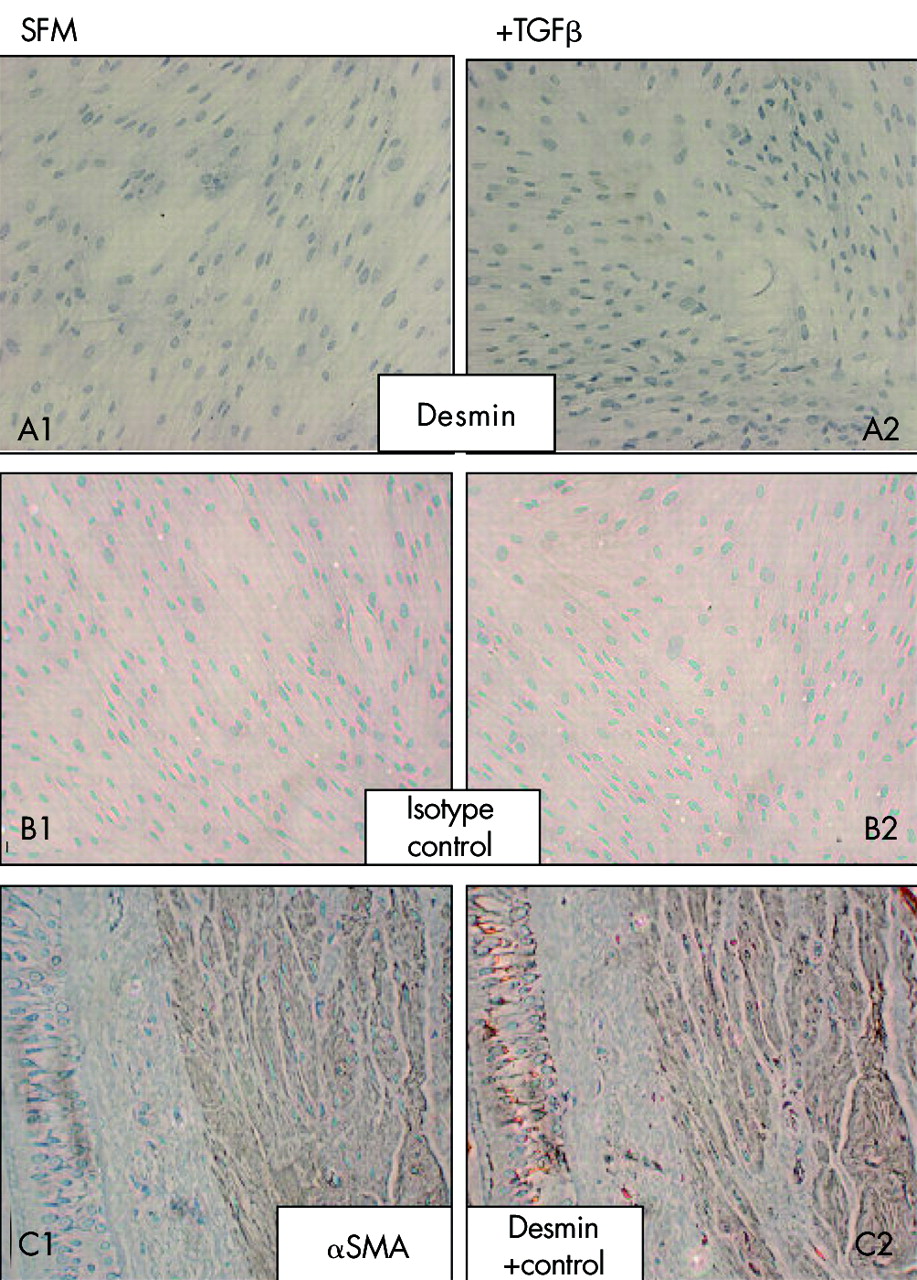
Protein staining for αSMA was absent from the majority of untreated cells ((estimated >99%, fig 5), confirming the fibroblast origin of these cells and the absence of smooth muscle contamination. After treatment with 0.04 nM TGFβ2, clearly defined filamentous staining was present in the majority (estimated >90%) of cells. HCM immunostaining was present within the nuclei of untreated cells but was absent in the cytoplasm. Treatment with 0.4 nM TGFβ2 induced formation of cytoplasmic myosin filaments in around 80% of cells. Diffuse immunostaining for CPN 1 was present within the cytoplasm of the majority (>95%) of untreated cells and, upon TGFβ2 treatment, the intensity of this staining increased and localised to resemble the filamentous staining of αSMA and HCM. Desmin staining was absent from treated and untreated cells; the activity of this antibody was confirmed by staining of smooth muscle in bronchial biopsy sections (fig 6).

Protein expression and localisation for (A) αSMA, (B) HCM, and (C) CPN 1 was measured by immunocytochemistry in untreated fibroblast cultures (A1–C1) and those treated with 0.4 nM TGFβ2 for 48 hours (A2–C2). Both untreated (D1) and treated (D2) control cultures were immunostained with an isotype matched IgG preparation. Data are representative of immunostaining of asthma and healthy control cells (n = 6).

Desmin protein expression and localisation measured by immunocytochemistry in (A1) untreated fibroblast cultures and (A2) those treated with 0.4 nM TGFβ2 for 48 hours. Both untreated (B1) and treated (B2) control cultures were immunostained with an isotype matched IgG preparation (n = 6). The affinity of the anti-desmin antibody was demonstrated by staining a bronchial biopsy section (C2). Location of muscle in a sequential section as demonstrated with anti-αSMA staining. Data are representative of immunostaining of asthma and healthy control cells.
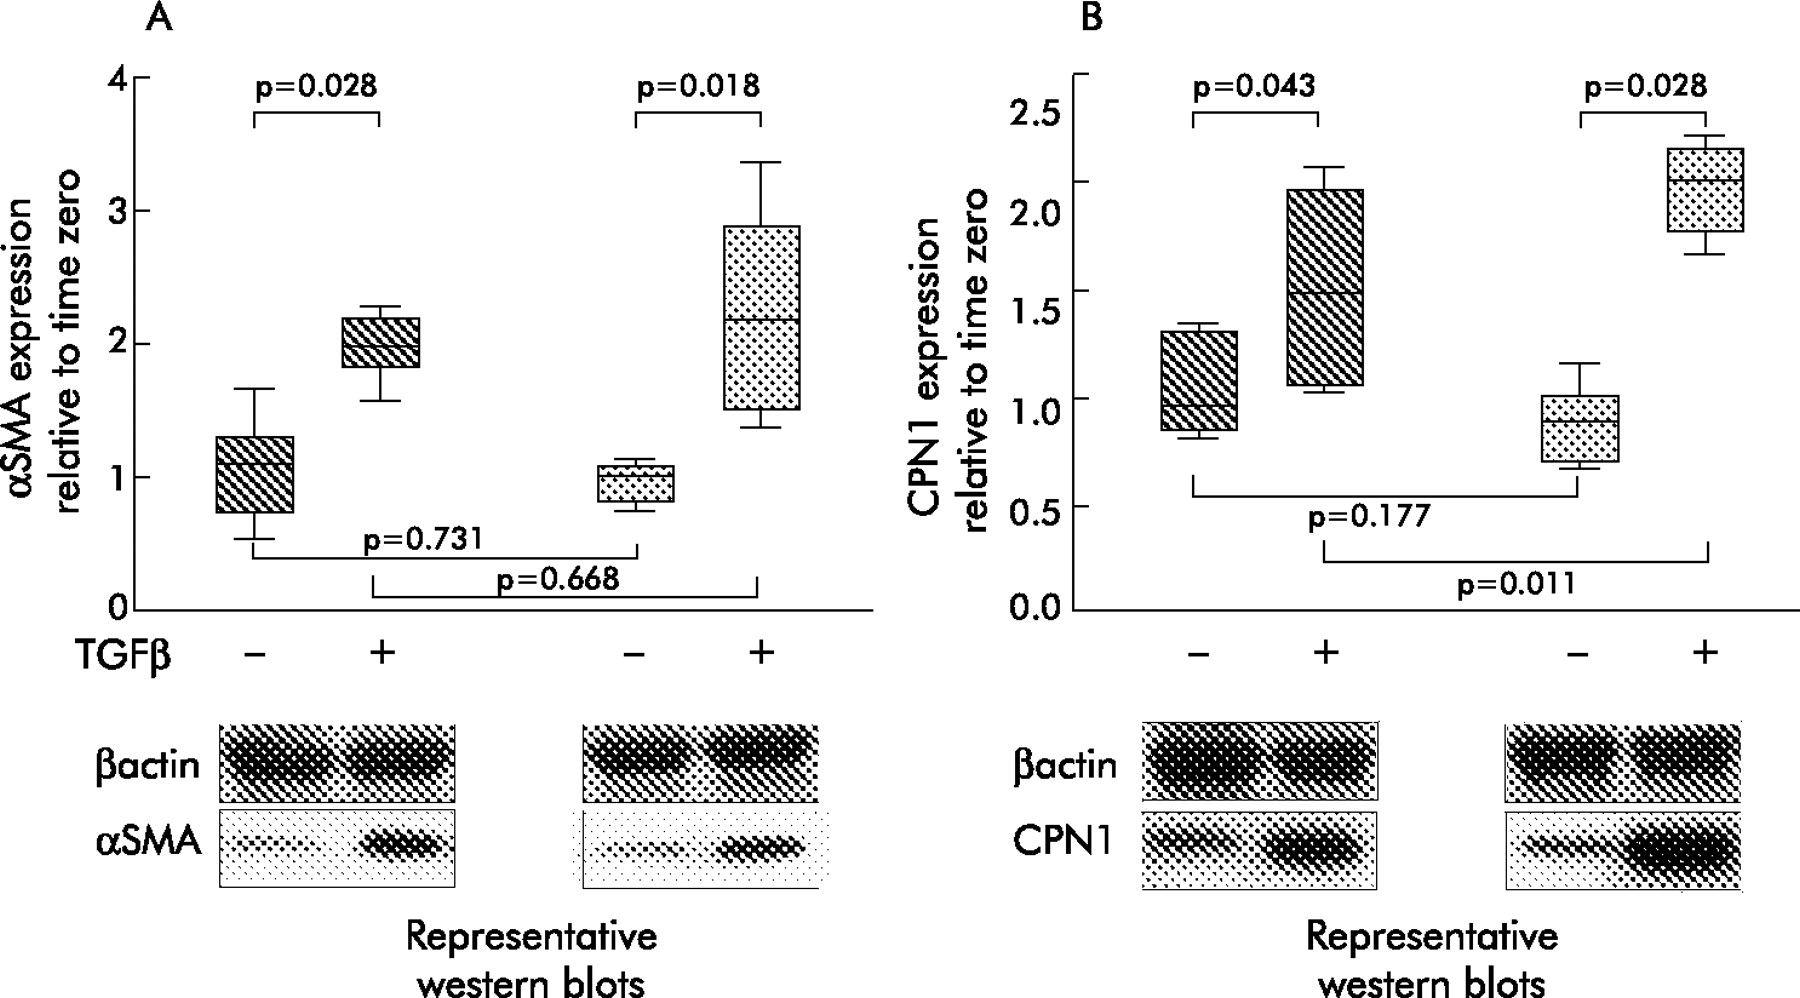
Semi-quantitative analysis of αSMA and CPN 1 protein expression by western blotting (fig 7) showed that αSMA protein was induced to the same extent in asthmatic fibroblasts as in healthy control cells following treatment for 48 hours with 0.4 nM TGFβ2. However, consistent with the mRNA data, CPN 1 protein expression was induced to a significantly greater extent in asthmatic cells than in healthy control cells under the same conditions (p = 0.011).
Semi-quantitative analysis of calponin (CPN 1) protein as detected by western blotting. Fibroblasts from healthy controls (dark shading) and asthmatic subjects (light shading) were incubated in serum free medium with or without TGFβ2 for 48 hours and then lysed for SDS PAGE and western blot analysis. Representative western blots of αSMA and calponin are also shown. β-Actin was used as a loading control. Densitometry data were obtained using Genetools software (Syngene) and expressed relative to time zero control.
DISCUSSION
Asthma is characterised by an increase in myofibroblast numbers and smooth muscle mass. Myofibroblasts have features intermediate between fibroblasts and smooth muscle cells18 and it has been suggested that they may act as precursors for smooth muscle cells.2,13,19 In this study we provide new evidence that asthmatic fibroblasts are more responsive than normal fibroblasts for the induction of smooth muscle related genes following differentiation induced by TGFβ2.
Selection of normalising genes using geNorm analysis
During differentiation a large number of genes, including “housekeeping” genes, are upregulated or downregulated.7 This was confirmed by the geNorm analysis where the average expression stability of the control genes was lower in the fibroblast or myofibroblast alone populations than in the combined analysis. For example, B2M is ranked as the most stable gene in undifferentiated fibroblasts, third in myofibroblast cultures, but drops to eighth in the combined analysis, indicating that B2M is regulated during differentiation. By contrast, SDHA is ranked only seventh in terms of stability in undifferentiated fibroblasts, third within myofibroblasts, but is the best in the combined fibroblast/myofibroblast analysis. SDHA is therefore more stably expressed during differentiation than the other genes that it has “overtaken” in the rankings.
The geNorm analysis indicated that the optimum number of housekeeping genes to measure within a combined fibroblast/myofibroblast culture would be eight. However, the criteria suggested by geNorm of a pairwise variation analysis between NFn and NFn+1 of <0.15 was met by the inclusion of a fifth gene. In fact, inclusion of only the best three genes gave a pairwise variation analysis between NFn and NFn+1 of 0.157. It therefore seems that the measurement of a large number of housekeeping genes is not necessary in this case. The selection of housekeeping genes often reflects a balance between what is scientifically desirable with what is practically achievable. We chose to use the geometric mean of A2 and UBC for our subsequent analyses as they are two of the best three genes in the combined analysis and are available as a multiplex assay allowing simultaneous detection of both genes. This improves accuracy by minimising sampling error and, more importantly, minimises the amount of cDNA required to measure both genes. When working with limited amounts of cDNA, this is of particular importance.
Smooth muscle related transcript expression in differentiating fibroblasts
Our analysis of smooth muscle related transcript expression at the mRNA and protein level gives us some insight into the nature and extent of the switch that occurs in differentiating fibroblasts as they move towards a smooth muscle phenotype. Stimulation with TGFβ2 significantly induced mRNA expression for the five smooth muscle transcripts measured, but not all were induced at the protein level.
Undifferentiated fibroblasts expressed high levels of αSMA mRNA, almost identical to the highly abundant housekeeping genes used for normalisation. However, αSMA protein was present in only a very small proportion of these untreated cells. Upon stimulation with TGFβ2, αSMA mRNA expression increased further and protein expression was greatly induced and assembled into fibres. This suggests that fibroblasts are “primed” for myofibroblast differentiation through the presence of a large pool of αSMA mRNA. Upon stimulation with TGFβ2, fibroblasts quickly differentiate to a proto-myofibroblast phenotype, presumably by overcoming the block in translation of pre-existing αSMA transcripts coupled with the induction of nascent mRNA.
The responses of HCM and CPN 1 to TGFβ2 stimulation were more conventional. HCM mRNA and protein expression were both very low in fibroblasts and both were significantly induced during differentiation. CPN 1 expression at both the mRNA and protein level was relatively high in untreated fibroblasts and increased during differentiation. However, the distribution of protein changed from diffuse cytoplasmic staining to filamentous staining due to the recruitment of CPN 1 to the rapidly assembling contractile apparatus within the cell. HCM mRNA and protein were both good indicators of phenotype while CPN 1 was widely expressed before TGFβ2 treatment and was a poor maker of differentiation.
Desmin mRNA expression was low in untreated fibroblasts but increased significantly upon TGFβ2 stimulation, although there was no induction of desmin protein within the cells. The expression of desmin is known to decrease in proliferating cultures of smooth muscle cells, suggesting that it is an important marker of muscle differentiation. γ-Actin mRNA was relatively abundant in untreated cultures and was further induced upon stimulation with TGFβ2. However, γ-actin is generally considered an excellent marker for fully differentiated smooth muscle cells20,21 and is unlikely to be present in these myofibroblast cultures.
Overall, TGFβ2 treatment did not achieve a genuine phenotypic switch from fibroblast to differentiated smooth muscle cells, proven by the absence of essential protein markers such as desmin. Nonetheless, mRNA pools for desmin existed but appeared not to be translated. The absence of desmin protein, but an abundance of mRNA in TGFβ2 differentiated fibroblasts, is analogous to the large pool of untranslated αSMA mRNA that was present in untreated fibroblasts. We therefore propose a model whereby resting airways fibroblasts are primed for phenotypic differentiation into myofibroblasts and this may be achieved by TGFβ2 treatment. Likewise, these myofibroblasts appear to be primed for further differentiation but lack the appropriate stimulus to overcome the block in the translation of certain smooth muscle mRNA species. This is consistent with a recently published model for smooth muscle differentiation and suggests that post-transcriptional regulation is a key determinant of cell fate in this context.14
The dose dependency of TGFβ2 induced differentiation further emphasises the potential importance of TGFβ2 in asthma. It is known that TGFβ2 is increased in asthma3 and our data suggest that this is likely to lead to an increased number of myofibroblasts, each expressing more αSMA, HCM and CPN 1 protein that may provide greater contractile potential. Assuming that myofibroblasts are primed for phenotypic transition to smooth muscle through the accumulation of smooth muscle related transcripts, the disease related differences in the mRNA expression of HCM, CPN 1, desmin, and γ-actin gene may also be important in the pathogenesis of asthma. It is therefore possible that asthmatic fibroblasts are “primed” to a greater extent by TGFβ2 through the transcription of larger mRNA pools of these genes. If appropriate stimulation for a further phenotypic transition towards smooth muscle occurs in vivo, we hypothesise that (myo)fibroblasts in asthmatic airways are better primed for this transition than in healthy airways. The sensitivity of asthmatic fibroblasts to TGFβ2 “priming” is emphasised further by the fact that αSMA and γ-actin mRNA were maximally induced by only 0.04 nM TGFβ2 whereas healthy control fibroblasts required a greater dose to achieve maximal transcription of mRNA for these genes. Several processes may therefore be acting in concert in asthmatic airways to promote myofibroblast and smooth muscle differentiation leading to altered airway structure.
REFERENCES
Footnotes
-
Published Online First 31 January 2006
-
This study was supported by the Medical Research Council (UK), the Wellcome Trust (London, UK), and the AAIR Charity (Southampton General Hospital, Southampton UK).
-
Competing interests: none.