Article Text

Abstract
Introduction International guidelines recommend a severity-based approach to management in community-acquired pneumonia. CURB65, CRB65 and the Pneumonia Severity Index (PSI) are the most widely recommended severity scores. The aim of this study was to compare the performance characteristics of these scores for predicting mortality in community-acquired pneumonia.
Methods A systematic review and meta-analysis was conducted according to MOOSE (meta-analysis of observational studies in epidemiology) guidelines. PUBMED and EMBASE were searched (1980–2009). 40 studies reporting prognostic information for the PSI, CURB65 and CRB65 severity scores were identified. Performance characteristics were pooled using a random effects model. Relationships between sensitivity and specificity were plotted using summary receiver operator characteristic (sROC) curves.
Results All three scores predicted 30 day mortality. The PSI had the highest area under the sROC curve, 0.81 (SE 0.008), compared with CURB65, 0.80 (SE 0.008), p=0.1, and CRB65, 0.79 (0.01), p=0.09. These differences were not statistically significant. Performance characteristics were similar across comparable cut-offs for low, intermediate and high risk for each score. In identifying low risk patients, PSI (groups I and II) had the best negative likelihood ratio 0.08 (0.06–0.12) compared with CURB65 (score 0–1) 0.21 (0.15–0.30) and CRB65 (score 0), 0.15 (0.10–0.22).
Conclusion There were no significant differences in overall test performance between PSI, CURB65 and CRB65 for predicting mortality from community-acquired pneumonia.
- Pneumonia
- bacterial infection
- severity of illness index
- respiratory infection
Statistics from Altmetric.com
Introduction
Community-acquired pneumonia (CAP) is the leading cause of death from infectious disease in western countries and a major burden on healthcare resources.1
Although many hospitalised patients have an uncomplicated course, the inpatient mortality for CAP is reported to be between 5.7% and 14%, and CAP accounts for a significant proportion of intensive care unit (ICU) admissions.2 3 There is evidence that, using clinical judgement, physicians may both overestimate and underestimate the severity of CAP, leading to inappropriate hospitalisation for mild cases that may be treated at home, or insufficiently aggressive interventions for patients at high risk of complications.4 5
Severity scores may overcome these difficulties by providing objective classification of patients into low, intermediate and high risk categories based on robust, validated markers of poor outcome.6 The most extensively studied scoring system, the Pneumonia Severity Index (PSI), was introduced in 1997 following a study of >50 000 patients with CAP.7 This 20-point score (details are included in the online supplement) classified patients into five risk categories (I–V) based on their percentage risk of death within 30 days. Patients in class I–II were recommended for outpatient therapy based on their low risk of death (0.1–0.7%).7
The PSI has been successfully applied in clinical practice to increase the use of outpatient treatment in CAP and is recommended by a number of national and international guidelines.1 8 The PSI, however, has limitations. It is heavily weighted by age and co-morbid illnesses, and the large number of variables makes it complex to use in a busy emergency department.9
Recognising this, the British Thoracic Society (BTS) subsequently derived its own, more simple prediction tool (CURB), also based on the risk of 30 day mortality. In 2003 Lim and colleagues modified this score with the addition of age ≥65 years as a risk factor, to create CURB65 (details of each severity score are included in the online supplement).10 This score is significantly easier to remember and use than the PSI, being composed of only five variables with a single point awarded for each. CRB65, without requirement to measure blood urea, is recommended for outpatient use and is widely used in Europe, including for hospitalised patients.10 11
CURB65 has been adopted internationally, and is now recommended by a large number of national and international guidelines alongside the PSI.1 2 12–14
Studies comparing these scoring systems have given conflicting results, with some suggesting the PSI may be superior,15 16 while others have found no advantage to the PSI over CURB65.17 18 Studies of CRB65 have suggested this more simple rule may be equivalent to CURB65 and PSI for prediction of 30 day mortality.17–20
This study aimed to systematically review the published literature in relation to these scoring systems and to determine if there is any difference in performance between the PSI, CURB65 and CRB65 rules in predicting mortality from CAP.
Methods
The present study was a systematic review and meta-analysis conducted according to MOOSE (meta-analysis of observational studies in epidemiology) guidelines.21
Search criteria
This systematic review and meta-analysis was based on a search of PUBMED using search terms:
(‘CURB65’ OR ‘CURB 65’ OR ‘CURB-65’ OR ‘C.U.R.B.65’ OR ‘C-U-R-B-65’ OR ‘CRB65’ OR ‘CRB 65’ OR ‘CRB-65’ OR ‘C.R.B.65’ OR ‘C-R-B-65’ OR ‘Pneumonia severity index’ OR ‘PSI’ OR ‘PORT score’ OR ‘Fine Score’) AND (‘Pneumonia’ OR ‘community-acquired pneumonia’ OR ‘CAP’)
(‘Severity score*’ OR ‘predict*’ OR ‘prognosis’ OR ‘mortality score*’) AND (‘Pneumonia’ OR ‘community-acquired pneumonia’ OR ‘CAP’)
The search included articles published between 1980 and August 2009. No language criteria were applied. Full articles of all potentially appropriate abstracts were reviewed. Only peer-reviewed data were included; therefore, conference abstracts were excluded. The search was repeated in EMBASE to obtain any articles missed by the original search. The search strategy was supplemented by reviewing of reference lists, bibliographies and the investigators files. The PUBMED search results are presented in the online supplement.
Data extraction
Two investigators independently assessed articles to determine study eligibility. Non-relevant studies were excluded based on title and abstract review only. Potentially relevant studies were reviewed by at least two researchers who carried out data extraction and quality assessment in a blinded fashion. Any disagreement between abstractors was resolved independently by a third abstractor. Where appropriate, we contacted the authors to clarify inconsistencies or to obtain missing data.
Study inclusion and study quality assessment
All studies were considered eligible if they fulfilled the following criteria: original publications; inclusion of consecutive/unselected patients with CAP; radiographic confirmation of CAP and exclusion of non-CAP diagnoses—for example, non-pneumonic exacerbation of chronic obstructive pulmonary disease; and calculation of severity score based on admission data.
A priori we determined to exclude studies that included diagnoses other than CAP and studies reporting selected populations (eg, restricted to a single age group, or restricted to one causative organism or a single site of care; eg, ICU patients). In the case of duplicate publication, the largest study, if applicable, was included. If there was doubt about overlap between studies, the authors were contacted to clarify this.
There are no widely accepted quality criteria for observational studies. In order to assess quality, modified criteria based on the criteria of Hayden et al were used22 (see table E1 in the online supplementary material). Two reviewers independently assessed quality, and the agreement between the two reviewers was measured using the κ statistic.
Statistical analysis
Analyses were conducted for discrimination and calibration of the scores. For discrimination, the incidence of each outcome in the high, intermediate and low risk groups was calculated and these ORs were weighted by the inverse of their variance and pooled across all studies using the Dersimonian/Laird random effects model. A random effects model was used due to expected heterogeneity between studies. For each severity score, pooled sensitivity, specificity, positive and negative likelihood ratios and diagnostic ORs are reported. A summary receiver operator characteristic (sROC) curve was constructed describing the relationship between sensitivity and specificity across the included studies. The areas under the ROC curves (AUCs) were compared using the method described by Hanley and MacNeil for comparing curves derived from different sets of cases.23
For calibration, the predicted mortalities obtained from the original derivation studies for PSI, CURB65 and CRB65 were compared with observed mortality rates obtained in each study. The observed:predicted RRs are presented with 95% CIs. Risk ratios were calculated using the Mantel–Haenszel method and pooled using a random effects model. An RR >1 indicates that observed mortality is higher than expected from the original derivation study. An RR <1 indicates that fewer deaths than expected occurred in the validation studies than in the original derivation.
Statistical heterogeneity was assessed using the Cochran Q (χ2) test and the Higgins I2 tests. For the Cochran Q test, p<0.1 was considered to represent significant heterogeneity. For the Higgins test, I2 <25% indicates low heterogeneity, 25–50% moderate and >50% severe heterogeneity.
A priori the authors decided to conduct subgroup analyses to explore sources of heterogeneity in the main analysis. Preplanned analyses included: analyses limited to studies only including hospital inpatients; analysis limited to high quality studies only; and analysis of prospective studies only.
Analyses were conducted using Metadisc software (Barcelona, Spain), SPSS version 13 for windows (SPSS, Chicaago, Illinois, USA) and Review manager version 5 (Cochrane Collaboration, Oxford, UK).
Results
Literature review and description of included studies
A total of 5102 abstracts were reviewed, and 233 papers were potentially eligible and were reviewed in depth. Figure 1 shows the process of literature review. The majority of studies reviewed in depth were not included because they did not report data for any of the severity scores under investigation.
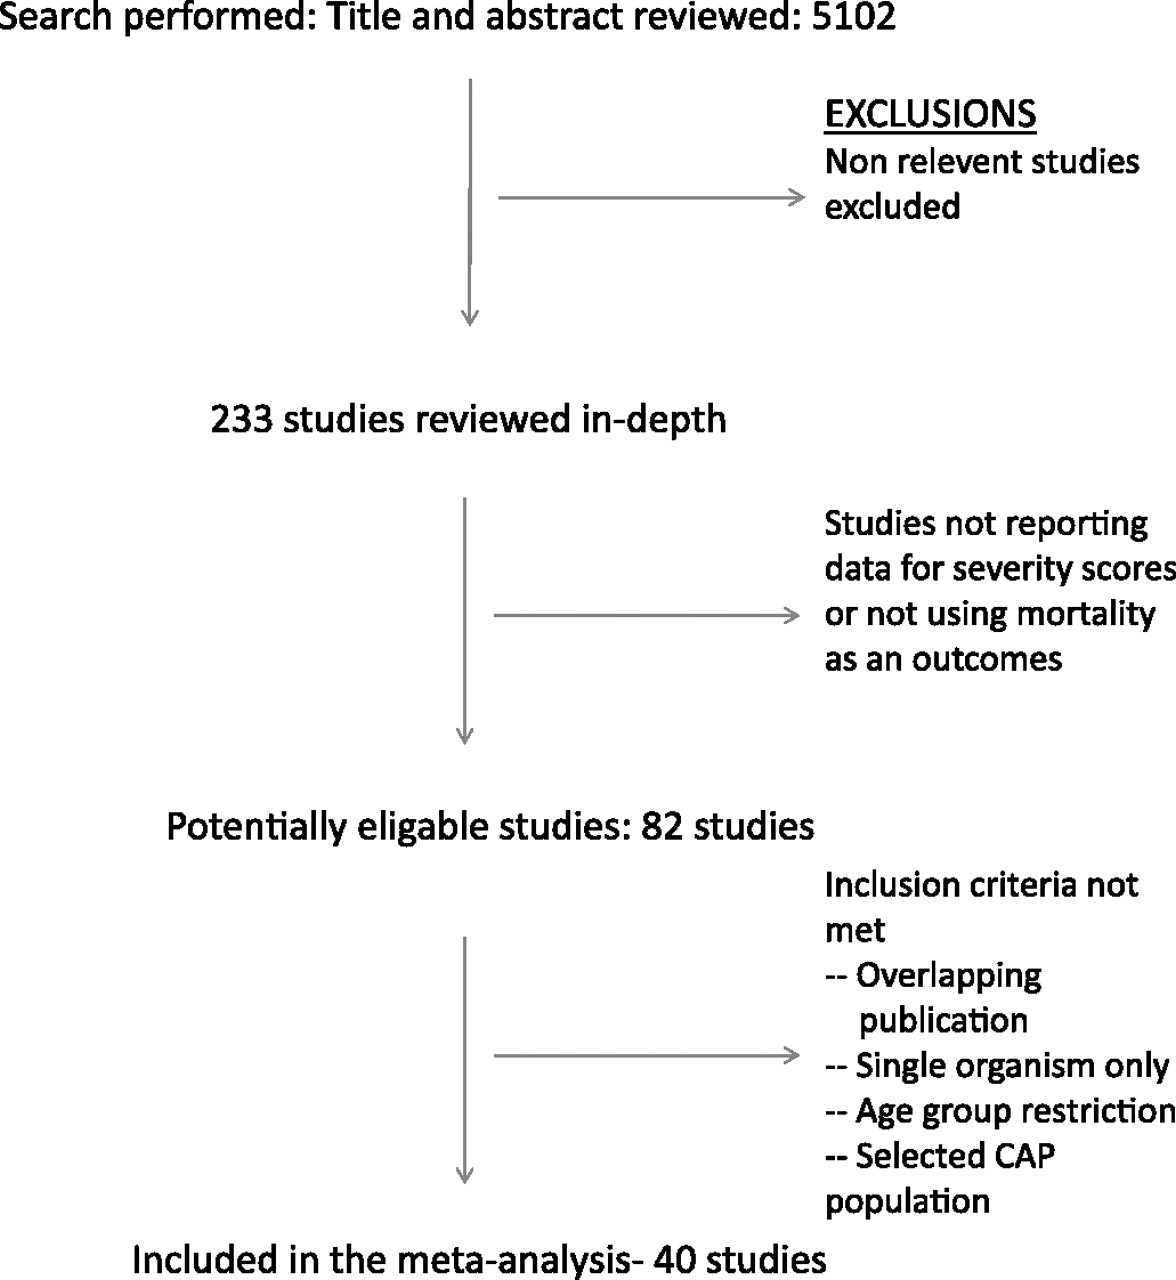
The process of literature review.
Forty-two studies containing severity data were excluded (see table E3 in the online supplementary material).
Characteristics of each of the included studies are shown in table E2 in the online supplement. Twenty-one studies were described as prospective observational cohort studies. Thirteen cohorts were described as retrospective. Four studies were clinical trials. One study was described as a population-based observational study and one study was a combination of three prospective observational studies.
Seventeen studies reported data for CURB65,10 15 18 20 24–36 11 studies reported data for CRB6510 18 20 25–27 31 33 36–38and a total of 31 papers reported data for PSI.7 15 18 20 24 26 27 29–33 35 39–56 comprising 33 individual cohorts. The majority of studies used 30 day mortality as their primary outcome measure, although in-hospital mortality was used in a few studies. The size of studies varied from 137 patients, up to >50 000 patients in the MEDISGROUP retrospective database used to derive the PSI,7 and 388 406 patients in a retrospective study from Germany assessing CRB65.38 Reported mortality rates varied from 4.3% to 22.6% (supplementary table E2). The majority of included studies consisted exclusively of hospitalised patients. A proportion of studies included a mix of inpatients and patients managed in the community.7 15 27 29 31 33 37 49 51 The results of the quality assessment are shown in the online supplement.
Meta-analysis
PSI
Thirty-one papers reporting the results for 33 cohorts were included in the meta-analysis for PSI. These studies comprised 81 797 patients with a cumulative mortality rate of 8.3%. The performance characteristics for each cut-off are shown in table 1. The overall test performance across all cut-offs, measured by the area under the sROC curve was good, AUC 0.81 (SE 0.008) (figure 2). Based on the Infectious Disease Society of American/American Thoracic Society (IDSA/ATS) guidelines,1 patients in risk class I–II should be treated as outpatients, risk class III patients may be treated as outpatients or with short hospitalisation, and patients in risk class IV and V are at higher risk and should be hospitalised. Performance characteristics suggested a good negative likelihood ratio 0.08 (0.06–0.12) for PSI group I–II. Using this cut-off, 34.9% of patients across all studies were identified as low risk. Using PSI I–III to define low risk, the negative likelihood ratio was less good 0.2 (0.17–0.24), but a greater proportion of patients (46.1%) are classified as low risk. There was significant heterogeneity in all analyses of discrimination. These data and the results of the subanalyses are shown in the online supplement. Calibration results are shown below.
Pooled performance characteristics of severity scores for predicting mortality in community-acquired pneumonia

Summary receiver operator characteristic curves for the Pneumonia Severity Index (PSI), CURB65 and CRB65. AUC, area under the curve.
CURB65
Seventeen studies were including in the analysis, comprising 15 596 patients with CAP. The combined mortality rate was 8.8%. The performance characteristics for each cut-off are shown in table 1. Across all cut-offs, the area under the sROC curve was good, AUC 0.80 (SE 0.008) (figure 2). IDSA/ATS and British Thoracic Society (BTS) guidelines1 2 suggest that patients with scores of 0–1 are low risk and may be managed as outpatients. Patients with scores of 2 may require brief hospitalisation, and patients with a score ≥3 are high risk and should be hospitalised. CURB65 0–1 had a negative likelihood ratio of 0.21 (0.15–0.30), and these groups comprised 48.8% of patients in the CURB65 studies. Lowering the threshold for outpatient care to CURB65 0 alone improved the negative likelihood ratio to 0.10 (0.06–0.16), although only 24.2% of patients would be classified as low risk by this approach. Also of note, CURB65 ≥4 had a high specificity of 95.3% (95.0–95.7%) and high positive likelihood ratio 5.4 (4.4–6.6), indicating a strength in identifying high risk patients.
CRB65
Eleven studies were included for analysis of CRB65. A total of 397 211 patients were included. The analysis was dominated by a large study from Germany of 388 406 patients. IDSA/ATS and BTS guidelines1 2 suggest that patients with scores of 0 are low risk and may be managed as outpatients. Patients with scores of 1–2 are at moderate risk and may require hospitalisation while patients with scores of ≥3 are high risk and should be hospitalised. The performance characteristics for each cut-off are shown in table 1. The overall predictive value of CRB65 was good, across all-cut offs, with an area under the curve of 0.79 (SE 0.013) (figure 2). For identifying low risk patients, 33.7% of patients had a CRB65 score of 0, with a negative likelihood ratio of 0.15 (0.10–0.22). As with CURB65, CRB65≥3 was specific (specificity 90.9% (90.8–91.0%)) with a high positive likelihood ratio 4.4 (3.6–5.5) suggesting a strength in identifying high risk patients.
Calibration
The performance of scores was compared with predicted values obtained from the initial derivation studies. For PSI, Fine et al7 reported mortality rates of 0.3, 0.4, 9.3 and 27% for PSI classes I–II (lowest risk), I–III (low risk), IV and V, respectively. For CURB65, predicted values10 were 1.2% (CURB65 0–1), 9.0% (CURB65 2) and 22.6% (CURB65 3–5). For CRB65, predicted mortality rates10 were 0.9% (CRB65 0), 8.1% (CRB65 1–2) and 31.2% (CRB65 3–4). The results of the calibration analysis are shown in table 2. The observed mortality in the validation studies was significantly higher for both PSI and CURB65 for low risk patients (PSI I–III and CURB65 0–1) than estimated in the original derivation studies. These were consistent findings across all studies, with little heterogeneity (table 2). All three scores were well calibrated (p>0.05) at the higher cut-offs, although significant heterogeneity was observed, suggesting variation in mortality rates between different studies within these groups. Forest plots for each group are displayed in the online supplement.
Calibration of severity scores against predicted mortality from the original derivation studies
Subanalyses
The results of the subanalyses are presented in table E3 for each scoring system in the online supplement. None of the subanalyses impacted the main conclusions. The results of the quality assessment are also shown in table E4 (online supplementary material).
Comparisons between PSI, CURB65 and CRB65
There were no significant differences in the AUC between PSI, CURB65 and CRB65 in the main analysis (PSI vs CURB65, p=0.1, PSI vs CRB65, p=0.09, CURB65 vs CRB65, p=0.5) or in any of the extensive subanalyses. As noted above and shown in table 1, PSI had a superior negative likelihood ratio and identified a higher proportion of patients as low risk compared with CURB65 and CRB65. The high risk groups of CURB65 and CRB65 had a higher positive likelihood ratio.
Discussion
This systematic review and meta-analysis found that all three of the major pneumonia severity prediction tools predict 30 day mortality in CAP. The PSI, CURB65 and CRB65 scores all predicted 30 day mortality with moderate to good accuracy.57 There were no significant differences in overall test performance between these scores, suggesting that clinicians may choose the scoring system best suited to their local needs. Although overall test accuracy was similar, there were some differences in the performance characteristics between the scores. The low negative likelihood ratio suggests that PSI may be superior at identifying low risk patients, while a higher positive predictive value suggests that CURB65/CRB65 may be superior for identifying high risk patients.58 The clinical importance of these differences is, however, difficult to establish.
National and international guidelines recommend a severity-based approach to diagnosis and treatment of CAP.1 2 For example, the BTS recommends using the CURB65 score to determine the use of microbiology investigations, admission to hospital, antibiotic choice and admission to high dependency units and ICUs.2
Thus the majority of key early decisions in CAP management are based on this severity assessment tool. The IDSA/ATS guidelines, on which many guidelines internationally are modelled, recommend both the PSI and CURB65 scores.1
The accuracy of these tools for predicting the outcome of interest is therefore critical. The results of this meta-analysis show that each of the severity scores, PSI, CURB65 and CRB65, predict 30 day mortality from CAP with moderate–good performance characteristics. The PSI is significantly more complex than the CURB65, requiring the measurement of 20 parameters with different points awarded for each.7 Evidence suggests clinicians find it difficult to use and it is underutilised in clinical practice.9 This meta-analysis found that PSI had a significant advantage in terms of its negative likelihood ratio, therefore indicating it is superior at identifying low risk patients. PSI was originally designed to identify low risk patients, and the primary objective of clinical studies utilising the PSI has been to increase the proportion of low risk patients managed as outpatients.7 8 59 The results of this meta-analysis suggest it is potentially better than alternative scores for this purpose.
CURB65 and CRB65 appear to be superior to PSI for identifying patients at the highest risk, and therefore may be more suitable to guide investigations and the use of broad-spectrum antibiotic therapy (as suggested by the BTS guidelines) where these measures are specifically targeted at high risk patients.2 Although this may also lead to the conclusion that CURB65 would be superior to identify patients requiring ICU care, this meta-analysis did not consider ICU care, as an outcome and studies suggest CURB65 and PSI are less sensitive to predict ICU care.3 6 26 29
CRB65 has been promoted primarily for outpatient use.2 10 This meta-analysis, however, found only one study that considered its use exclusively in outpatients.60 The purpose of the current study was to assess its value in hospitalised patients. Further validation studies are required before application of any of these prediction rules in primary care. CRB65 is widely used in European countries for hospitalised patients.12 38 It is the most simple rule available, composed of the fewest factors and classifying patients accurately into three risk categories. It also has the advantage of not requiring venous blood tests and is therefore immediately available at patient triage, when many management decisions need to be made. In this study, CRB65 was equivalent to CURB65 and PSI in all analyses.
Typically, a positive likelihood ratio of >10 or a negative likelihood ratio of <0.1 is regarded as necessary for a predictive or diagnostic test to be considered robust.58 It is important to note that only PSI achieved a negative likelihood ratio <0.1 and none achieved a positive likelihood ratio >10, suggesting that all three scores are imperfect. Recent studies have aimed to improve several prediction tools by incorporating information from biomarkers,41 43 modifying the existing scores20 or deriving new scores.26 29 32 Further studies are needed to assess the impact of these modifications.
This meta-analysis was significantly limited by heterogeneity among the studies included. Many studies included both inpatients and outpatients, and different outcome measures were used, such as 30-day mortality or in-hospital mortality. Studies used varying designs, including prospective observational studies, retrospective case note reviews, administrative databases and randomised controlled trials. Despite these variations, extensive subanalyses found similar results to the main analysis. Results were not affected by considering separately those studies using different designs, direct comparisons between the scores, study quality and studies including outpatients. These analyses significantly improved homogeneity while not impacting on the main conclusions. Despite the multiple subanalyses performed, the meta-analysis may still have been affected by biases inherent in the design of the included studies. This meta-analysis sought to compare the three scores recommended by the IDSA/ATS guidelines. A number of other scoring systems have been derived and have a varying degree of validation.26 29 32 This study only addressed the value of PSI, CURB65 and CRB65, and does not comment on the performance or utility of other scores.
The performance of scores did vary significantly between different studies in different healthcare systems. If the population of patients to which the score is being applied is significantly different from the original derivation it may be necessary to perform local recalibration of the score.
It is widely accepted that prognostic model development is a three-stage process, comprising derivation (creating the rule), validation (applying the rule to new populations of patients to confirm its accuracy) and, perhaps the most important stage, impact analysis (applying the rule and determining if it can improve clinical outcomes for patients).61 This meta-analysis confirms that CURB65 and CRB65 have similar prognostic performance to PSI, but does not prove that they can improve patient outcome. An impact analysis for CURB65 and CRB65 is needed.
Conclusion
This systematic review and meta-analysis found no difference in overall test performance between the PSI, CURB65 of CRB65 for predicting mortality in CAP.
References
Supplementary materials
Web Only Data thx.2009.133280
Files in this Data Supplement: