


The majority of patients with mental health problems present to primary health care (PHC) services (Reference Katon and SchulbergKaton & Schulberg, 1992), yet general practitioners' (GPs') detection and management are often considered deficient (Reference Goldberg, Privett and UstunGoldberg et al, 1998; Reference SimonSimon, 1998; Reference Borowsky, Rubenstein and MeredithBorowsky et al, 2000; Reference Wang, Berglund and KesslerWang et al, 2000). Improvement in the knowledge and skills of primary care practitioners (Gask et al, Reference Gask, Goldberg and Lesser1988, Reference Gask, Usher wood and Thompson1998) has been sought through the development of clinical guidelines (Reference Paykel and PriestPaykel & Priest, 1992), educational programmes (Reference Stevens, Kinmonth and PevelerStevens et al, 1997), on-site mental health workers (Reference Bower and SibbaldBower & Sibbald, 2000) and shared care (Reference Katon, Von Korff and LinKaton et al, 1997). Evidence for the effectiveness (Reference Morris, Gask and RonaldsMorris et al, 1998) of such approaches is contradictory, with benefits observed in some settings but not others. Current emphasis focuses on educational interventions based on clinical practice guidelines (Reference Stevens, Kinmonth and PevelerStevens et al, 1997). The World Health Organization (WHO) undertook a major review of Chapter V of ICD-10 (on mental and behavioural disorders) specifically for primary health care practitioners. The new PHC version (ICD-10 PHC; World Health Organization, 1996) proposed both a general diagnostic classification for use in PHC and recommendations on management. This system was subjected to international field trials (Reference Goldberg, Sharp and NanayakkaraGoldberg et al, 1995), in which it was evaluated for acceptability and ease of application. No study has evaluated the impact of introducing such guidelines in a pragmatic randomised controlled trial (RCT). We developed a process for local adaptation and dissemination of the ICD-10 PHC (1996), intended to engender shared ownership between primary and secondary care practitioners. We evaluated this development of the guidelines in a pragmatic cluster RCT. Our hypotheses were that enabling GPs to adapt and extend the guidelines in conjunction with health care professionals from secondary services would improve practice detection rates of minor psychiatric morbidity, and patient outcomes at 3 months.
METHOD
Study area and eligibility of practices
The study was conducted in Bristol, UK (pre-intervention data collection: 9 October 1997 to 9 April 1998; post-intervention data collection: 2 September 1998 to 13 May 1999) in a mixed urban and rural area (population 178 000 aged 16-64). Mental Illness Needs Index social deprivation scores (Reference Glover, Robin and EmamiGlover et al, 1998) for electoral wards ranged from 83 to 118. All 43 general practices located within the catchment area of South Bristol Mental Health Services were eligible and invited to participate (by letter from G.H. and D.J.S.). Participating practices were reimbursed to cover costs of time spent in guideline adaptation meetings and administrative support for the study. Approval was obtained from local ethics committees.
Design and process of randomisation
We used a pair-matched, cluster RCT design (Reference Thompson, Pyke and HardyThompson et al, 1997). Practices were randomised in pairs after stratifying by social deprivation score. It was considered a priori that the socio-economic characteristics of patients and practice settings might influence outcomes. Using the rand function in Excel, 15 random numbers between 0 and 1 were generated (by T.C.). In each pair, the first practice was assigned to the intervention group if the number was ≤0.5, and the second if >0.5; 30 practices (70%) consented to randomisation. Figure 1 summarises the trial design and the recruitment and retention of practices.

Fig. 1 Trial design, recruitment and retention of practices. CMHT, community mental health team; GP, general practitioner; GHQ, General Health Questionnaire.
Sample size
Sample size calculations were based on patient-level outcomes at 3 months among those with General Health Questionnaire 12-item version (GHQ-12) scores > 3 at the screen. We aimed to detect a mean difference of 1 point (standard deviation=3) in the GHQ-12 score at 3-month follow-up using a two-tailed test, alpha=0.05, beta=0.20. This required 143 patients (in each group), and therefore an initial screen of approximately 1000 surgery attenders (assuming 30% score >3 at the screen).
Intracluster correlation
Baseline data (n=30 practices) were used to estimate the variance inflation factors, e.g. the intracluster correlation for the GHQ-12 scores from the screen was 0.012 (average cluster size, 37.04; design effect, 1.43). The intraclass correlation for change in GHQ-12 scores among those scoring > 3 at the screen (during baseline) was 0.038 when clustered by general practice. The average cluster size was 8.4 patients per practice followed up. The design effect for patient outcomes at follow-up was therefore 1.3, requiring 186 patients in each group or 372 in total.
Baseline screening and follow-up
During baseline and post-intervention periods we screened separate cross-sectional samples of consecutive attenders and followed them up by postal questionnaire at 3 months. Research workers visited each practice for at least two randomly selected surgeries to distribute copies of the GHQ-12 (Reference Goldberg, Gater and SartoriusGoldberg et al, 1997) to all surgery attenders aged between 16 and 64 years who gave verbal consent. During these surgeries, GPs completed a Physician Encounter Form (Reference Ustun and SartoriusUstun & Sartorius, 1995) for each patient. Practitioners were asked to record reasons for consultation, presenting symptoms, severity of disorder and diagnoses selected from a list based on the ICD-10 PHC chapter headings. Where no disorder was present, they were asked to indicate ‘No diagnosis of psychological disorder’. This process was repeated post-intervention. All consecutive attenders who scored >3 on the GHQ-12 at initial screening were followed up at 3 months (regardless of GP detection). Outcomes were collected via postal administration of four self-report questionnaires, which were returned in the stamped, addressed envelopes provided. Non-responders were sent second and third reminders.
The intervention
The intervention comprised the local development and dissemination of the WHO ICD-10 PHC guidelines (1996 version, which was ‘current’ at that time). Acknowledging evidence that emphasised the need for ownership of guidelines and active participation in their development (Reference Littlejohns, Cluzeau and BaleLittlejohns et al, 1999), we provided participating GPs with the opportunity to adapt the WHO guidelines in a shared-ownership model with colleagues from local psychiatric services. One GP from each intervention practice volunteered to become the guideline advocate, and took part in a series of guideline revision workshops based on a modified nominal group technique (Reference Trickey, Harvey and WilcockTrickey et al, 1998). During these workshops, attended by professionals from primary and secondary care (some jointly) the guidelines were:
-
(a) revised to reflect the consensus of participating practitioners from primary and secondary services;
-
(b) amended, e.g. to include recommendations concerning use of practice-based counsellors;
-
(c) extended, to include thresholds for specialist referral and to incorporate a list of local statutory National Health Service (NHS) and non-statutory services to which referrals could be made or who offered specific help.
An editorial team comprising primary care and psychiatric representatives of the research team incorporated the changes into a final document (South Bristol General Practitioners and Specialist Mental Health Services Guideline Adaptation Group, 1998) (‘the purple book’). In addition to the (indirect) dissemination through guideline-advocate participation in the above, participating GPs received a personal, desktop copy of the guidelines. Educational meetings (approved for Post-Graduate Education Allowance accreditation) were then organised in each intervention practice, facilitated by the guideline advocate and attended by a GP (C.C.) and psychiatrist (E.W.) from the research team. At these meetings the process of adaptation was described, and the guidelines were introduced and discussed.
Outcomes
Primary outcomes were: detection of minor psychiatric morbidity (sensitivity) at practice level, the unit of randomisation; and 3-month clinical outcomes for GHQ—12 cases. The latter were measured by GHQ—12 score at follow-up and the proportion who were still cases, i.e. scoring >3 (Reference Ustun and SartoriusUstun & Sartorius, 1995). Secondary outcomes were quality of life (QoL), disability, satisfaction with care and the specificity of detection performance (at practice level).
Measures
A GHQ—12 score of >3 (Reference Ustun and SartoriusUstun & Sartorius, 1995) was used to define a case for the purpose of calculating the GP identification indices (sensitivity and specificity) for detection of morbidity. Repeat GHQ—12 was used to record 3-month clinical outcomes. Impact on role-functioning was recorded using the sum of questions 2 to 6 on the Brief Disability Questionnaire (BDQ; Reference Von Korff, Ustun and OrmelVon Korff et al, 1996). This comprises five items: limitation in daily activities; limitation in functioning; motivation for work; personal efficiency; and deterioration in social relations. These were rated on a 3-point scale: 1=no, not at all; 2=yes, sometimes or a little; 3=yes, moderately or definitely. Total score ranged from 5 to 15, high indicating worse disability.
Quality of life was recorded by the five-item European Quality of Life (EuroQol) instrument (Reference Kind and SpikerKind, 1996). Items were summed to give a total score (range 5 to 15; high indicating worse QoL). A single question assessed satisfaction with care received: ‘How satisfied are you overall with the care you have recently received from your doctor?’ Responses were rated on a 5-point scale: 1=terrible; 2=mostly dissatisfied; 3=mixed views; 4=mostly satisfied; 5=excellent.
Analysis
Random effects meta-analysis (Reference Thompson, Pyke and HardyThompson et al, 1997) was used to provide graphical and statistical summaries of all primary (sensitivity, repeat GHQ—12) and secondary (specificity, disability, satisfaction and QoL) outcomes. This procedure generates a weighted average intervention effect (with 95% confidence intervals) pooled over the practice pairs, which were stratified by social deprivation. It also produced a z-score and P-value for the test that the intervention effect was significantly different from zero. Analyses were performed using the metan meta-analysis procedure in Stata version 6 for PC. Since measures of baseline performance (practice sensitivity and specificity before the introduction of the guidelines) were recorded, these were entered as covariates in a regression extension of the random effects meta-analysis procedure. We used the meta-regression approach recommended by Ukoumunne & Thompson (Reference Ukoumunne and Thompson2001) to correct for baseline imbalance in study outcomes (at the cluster level). Meta-regression analysis in a pair-matched cluster RCT provides an (analysis of covariance style) adjustment to the estimated risk difference that corrects for any baseline differences in outcomes that might have resulted from randomising a small number of experimental units (as is the case in cluster RCTs). To implement the adjusted analyses we used the metareg procedure in Stata with the additive between study variance (tau) estimated using the method of moments (option bs(mm)). To maximise sample size for the analysis of the outcomes at 3-month follow-up, patients were included even if the GP had not completed the Physician Encounter Form. No adjustment was made for patient-level covariates. All analyses were on an intention-to-treat basis.
RESULTS
Figure 2 summarises the flow of patients and practices.

Fig. 2 Flow of patients through screening and follow-up. PEF, Physician Encounter Form; GHQ, General Health Questionnaire.
The administrative characteristics of the consenting practices (30/43) and those who declined to participate are summarised in Table 1.
Table 1 Practice characteristics;1 values are number (percentage) unless otherwise specified
| Guideline practices (n=15) | Usual-care practices (n=15) | Practices declined (n=13) | |
|---|---|---|---|
| Mean practice list size (range) | 4090 (1416-7254) | 4395 (900-6309) | 4275 (900-7254) |
| Practices with single principal only | 3 (20) | 1 (7) | 1 (8) |
| Practices with fundholding status | 6 (40) | 6 (40) | |
| Mean number of principals per practice (total) | 3.73 (56) | 4.00 (60) | 3.61 (47) |
The characteristics of the participating GPs (Table 2) and of the sample of consecutive attenders for whom a matching Physician Encounter Form was collected (Table 3) appeared to indicate a balanced outcome of (cluster-level) randomisation, after stratifying by (practice) social deprivation score.
Table 2 Practitioner characteristics; values are number (percentage) unless stated otherwise
| Practitioners | Guideline practices (n=96) | Usual-care practices (n=88) | Practices declined (n=66) |
|---|---|---|---|
| Women (n=191) | 28 (39) | 34 (48) | 16 (33) |
| Locums/assistants (n=243) | 22 (24) | 19 (22) | 16 (25) |
| Part-time GPs (n=130) | 8 (16) | 14 (27) | 5 (18) |
| Registrars (n=243) | 5 (5) | 5 (6) | 6 (13) |
| Interested in mental health (n=176) | 10 (15) | 6 (9) | 6 (13) |
Table 3 Patient characteristics (for sample with complete GHQ and Physician Encounter Form); values are number (percentage) unless otherwise specified
| Baseline period | Intervention period | |||
|---|---|---|---|---|
| Guideline practices | Usual-care practices | Guideline practices | Usual-care practices | |
| Mean age, years (s.d.) | 39 (13.5) | 40 (13.5) | 41 (13.2) | 41 (13.5) |
| Women | 396 (63) | 347 (64) | 385 (68) | 365 (62) |
| Left school before 16 years of age | 228 (38) | 247 (48) | 190 (34) | 261 (45) |
| Unemployed | 258 (41) | 202 (38) | 229 (40) | 200 (34) |
| Median GHQ/%>3 | 2/38 | 2/36 | 2/36 | 2/30 |
| Mean GHQ (s.d.) | 3.5 (3.7) | 3.4 (3.7) | 3.5 (3.8) | 3.1 (3.6) |
Figure 3 shows the (very similar) cumulative distribution of GHQ—12 scores in guideline and usual-care practices, for consecutive attenders during the post-intervention period.
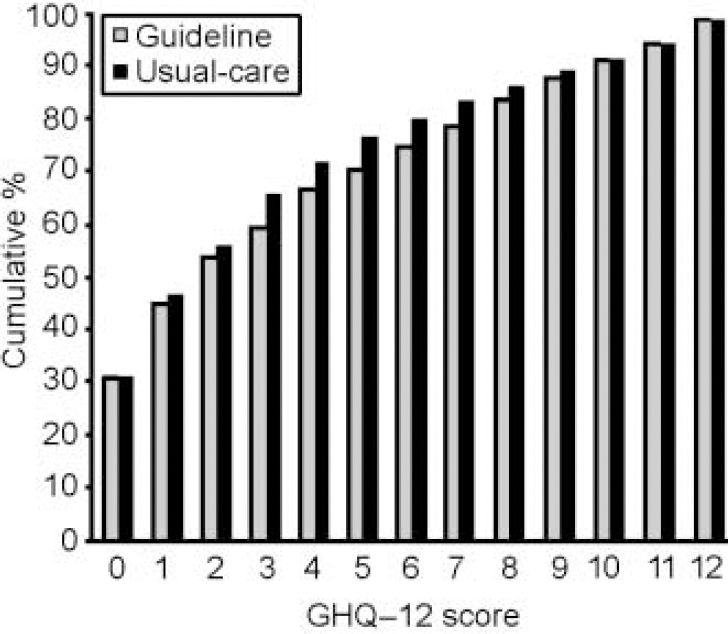
Fig. 3 General Health Questionnaire 12-item version (GHQ—12) scores in guideline and usual-care practices.
Primary cluster-level outcome: GP detection (sensitivity)
Identification of disorder required GPs to have indicated on the Physician Encounter Form the presence of at least one named psychological disorder from the list of ICD—10 PHC diagnoses. After intervention, the crude detection rate (sensitivity) for GPs in the guideline practices was 47%, compared with 55% in the usual-care practices (Table 4).
Table 4 Practice detection rates during baseline period
| Practice pair1 | Screen positives n | Named disorder on PEF n | Sensitivity % | Screen negatives n | No disorder on PEF n | Specificity % |
|---|---|---|---|---|---|---|
| Guideline practices | ||||||
| 1 | 21 | 6 | 29 | 37 | 31 | 84 |
| 2 | 10 | 5 | 50 | 12 | 11 | 92 |
| 3 | 10 | 4 | 40 | 22 | 17 | 77 |
| 4 | 17 | 7 | 41 | 33 | 31 | 94 |
| 5 | 11 | 5 | 46 | 26 | 21 | 81 |
| 6 | 14 | 5 | 36 | 24 | 20 | 83 |
| 7 | 12 | 9 | 75 | 28 | 20 | 71 |
| 8 | 7 | 4 | 57 | 13 | 10 | 77 |
| 9 | 25 | 13 | 52 | 35 | 22 | 63 |
| 10 | 11 | 8 | 73 | 22 | 17 | 77 |
| 11 | 17 | 9 | 53 | 16 | 10 | 63 |
| 12 | 28 | 11 | 39 | 23 | 17 | 74 |
| 13 | 11 | 5 | 46 | 15 | 10 | 67 |
| 14 | 3 | 1 | 33 | 8 | 4 | 50 |
| 15 | 3 | 1 | 33 | 12 | 12 | 100 |
| Total | 200 | 93 | 326 | 253 | ||
| Average | 46.5%2, 46.8%3 | 77.6%2, 76.8%3 | ||||
| Usual-care practices | ||||||
| 1 | 9 | 4 | 44 | 29 | 22 | 76 |
| 2 | 10 | 5 | 50 | 20 | 10 | 50 |
| 3 | 15 | 8 | 53 | 22 | 17 | 77 |
| 4 | 8 | 5 | 63 | 10 | 6 | 60 |
| 5 | 13 | 10 | 77 | 20 | 15 | 75 |
| 6 | 1 | 1 | 100 | 5 | 5 | 100 |
| 7 | 6 | 4 | 67 | 13 | 13 | 100 |
| 8 | 22 | 12 | 55 | 35 | 30 | 86 |
| 9 | 3 | 1 | 33 | 4 | 3 | 75 |
| 10 | 23 | 14 | 61 | 26 | 19 | 73 |
| 11 | 7 | 5 | 71 | 25 | 20 | 80 |
| 12 | 18 | 7 | 39 | 26 | 25 | 96 |
| 13 | 13 | 5 | 39 | 23 | 20 | 87 |
| 14 | 22 | 10 | 46 | 46 | 38 | 83 |
| 15 | 5 | 3 | 60 | 4 | 4 | 100 |
| Total | 175 | 94 | 308 | 247 | ||
| Average | 53.7%2, 57.1%3 | 80.2%2, 81.1%3 | ||||
The pooled risk difference between guideline and usual care was -10.8% (95% CI -24.0% to 2.4%), which was not significant (z=1.61, P=0.11). The unadjusted analysis is summarised in Fig. 4, which shows the risk difference for each pair and contributions to the pooled effect size (random-effects meta-analysis). The confidence limits for the intervention effect suggest that the guideline practices were less successful in identifying GHQ morbidity. However, this trend was reduced and estimated more precisely (evidenced by the reduction in width of the confidence interval) when the adjustment for baseline outcomes (Table 4) was made: after adjustment for baseline sensitivity, the difference was -6.6% (95% CI -19.0% to 5.9%; z=1.03%, P=0.304). The cluster-level correlation between baseline and post-intervention sensitivity was 0.45 (Pearson correlation, P=0.07). The significance of the baseline adjustment in the meta-regression analysis was P=0.03, which explains the slight increase in the precision of the estimated intervention effect from the meta-regression analysis. The estimated effect of the intervention was also reduced by almost half (from -10.8% to -6.6%).

Fig. 4 Random effects meta-analysis plot showing differences in practice detection by pair: (a) sensitivity and (b) specificity. Pooled estimates represent unadjusted and baseline-adjusted (meta-regression) weighted risk differences.
Secondary cluster-level outcome: GP detection (specificity)
After intervention, the crude specificities achieved by guideline and usual-care practices were 86% and 79%, respectively (Table 5). The pooled risk difference between guideline and usual care, for the secondary cluster-level outcome practice specificity, was 5.3% (-5.0% to 15.7%), which was not significant (z=1.01, P=0.31).
Table 5 Practice detection rates during post-intervention period
| Practice pair1 | Screen positives n | Named disorder on PEF n | Sensitivity % | Screen negatives n | No disorder on PEF n | Specificity % |
|---|---|---|---|---|---|---|
| Guideline practices | ||||||
| 1 | 15 | 7 | 46 | 33 | 24 | 72 |
| 2 | 6 | 4 | 66 | 9 | 8 | 88 |
| 3 | 5 | 1 | 20 | 19 | 19 | 100 |
| 4 | 11 | 5 | 45 | 27 | 27 | 100 |
| 5 | 5 | 4 | 80 | 11 | 10 | 90 |
| 6 | 9 | 1 | 11 | 29 | 26 | 89 |
| 7 | 19 | 13 | 68 | 17 | 13 | 76 |
| 8 | 13 | 6 | 46 | 24 | 17 | 70 |
| 9 | 18 | 10 | 55 | 17 | 12 | 70 |
| 10 | 11 | 8 | 72 | 23 | 16 | 69 |
| 11 | 18 | 6 | 33 | 28 | 23 | 82 |
| 12 | 15 | 6 | 40 | 23 | 21 | 91 |
| 13 | 6 | 4 | 66 | 6 | 6 | 100 |
| 14 | 6 | 0 | 0 | 3 | 3 | 100 |
| 15 | 2 | 1 | 50 | 6 | 5 | 83 |
| Total | 159 | 76 | 275 | 230 | ||
| Average | 47.7%2, 46.9%3 | 83.6%2, 85.8%3 | ||||
| Usual-care practices | ||||||
| 1 | 5 | 2 | 40 | 16 | 14 | 87 |
| 2 | 8 | 4 | 50 | 19 | 10 | 52 |
| 3 | 17 | 8 | 47 | 51 | 42 | 82 |
| 4 | 7 | 2 | 28 | 22 | 18 | 81 |
| 5 | 7 | 4 | 57 | 13 | 10 | 76 |
| 6 | 5 | 4 | 80 | 10 | 4 | 40 |
| 7 | 13 | 8 | 61 | 23 | 20 | 87 |
| 8 | 17 | 11 | 64 | 24 | 24 | 100 |
| 9 | 9 | 3 | 33 | 10 | 9 | 90 |
| 10 | 11 | 10 | 90 | 21 | 18 | 85 |
| 11 | 9 | 4 | 44 | 41 | 31 | 75 |
| 12 | 17 | 10 | 58 | 36 | 31 | 86 |
| 13 | 3 | 2 | 66 | 14 | 12 | 85 |
| 14 | 15 | 6 | 40 | 36 | 28 | 77 |
| 15 | 3 | 2 | 66 | 5 | 4 | 90 |
| Total | 146 | 80 | 341 | 276 | ||
| Average | 54.8%2, 55.3%3 | 80.9%2, 79.3%3 |
After adjustment for baseline specificity (Table 4), this difference increased slightly, to 6.2% (95% CI -4.4% to 16.8%; z=1.14, P=0.255). However, the baseline adjustment in the meta-regression analysis was not significant (P=0.416), explaining the decrease in the precision of the estimated intervention effect. The cluster-level correlation between baseline and post-intervention specificity was 0.21 (Pearson correlation, P=0.52). The baseline covariate was therefore not prognostic for intervention outcomes.
Postal questionnaire follow-up at 3 months
During both baseline and post-intervention periods, we followed up all consecutive attenders who scored >3 on the GHQ-12 screen. The response rate to the postal questionnaire follow-up during the post-intervention period was 61% for guideline and 62% for usual-care practices. Inspection of Tables 6 and 7 demonstrates that response rates were lower from practices in socially deprived areas. The response rate was unusually low for guideline practices during the pre-intervention baseline period (49%) (Table 6). The correlation between social deprivation score and response rate was greater than 0.3 (Spearman's rank correlation coefficient) during both baseline and post-intervention periods.
Table 6 Patient-level outcomes during baseline period; higher scores indicate worse outcomes (except for satisfaction)
| Practice pair1 | Returned questionnaires n (%) | General Health Questionnaire mean (s.d.) | GHQ change mean (s.d.) | At 3-month follow-up | |||
|---|---|---|---|---|---|---|---|
| At screen | At 3-month follow-up | GHQ≥4 n (%) | Satisfaction mean (s.d.) | Disability mean (s.d.) | |||
| Guideline practices | |||||||
| 1 | 17 (71) | 6.3 (2.5) | 4.5 (4.0) | -1.7 (4.5) | 10 (59) | 4.23 (0.56) | 8.0 (1.6) |
| 2 | 5 (42) | 7.4 (3.1) | 0.6 (0.8) | -6.8 (3.5) | 0 | 4.40 (0.89) | 7.0 (3.9) |
| 3 | 5 (38) | 8.0 (3.3) | 5.4 (2.7) | -2.6 (5.5) | 4 (80) | 4.40 (0.89) | 10.0 (3.4) |
| 4 | 11 (55) | 7.7 (3.1) | 6.0 (3.8) | -1.7 (3.6) | 7 (64) | 4.54 (0.52) | 8.7 (3.1) |
| 5 | 9 (75) | 7.2 (3.2) | 4.7 (4.0) | -2.4 (4.6) | 5 (56) | 3.77 (1.20) | 9.8 (2.6) |
| 6 | 10 (59) | 6.4 (2.4) | 4.2 (4.2) | -2.2 (3.2) | 6 (60) | 4.00 (0.81) | 8.5 (3.7) |
| 7 | 5 (31) | 7.4 (2.3) | 3.2 (3.2) | -4.2 (4.2) | 2 (40) | 4.20 (1.30) | 9.2 (3.7) |
| 8 | 4 (44) | 6.2 (1.5) | 5.7 (3.4) | -0.5 (4.4) | 3 (75) | 4.00 (0.81) | 9.0 (1.7); |
| 9 | 11 (41) | 8.0 (2.4) | 5.1 (3.7) | -2.9 (3.0) | 7 (64) | 4.45 (0.68) | 8.4 (3.0) |
| 10 | 8 (47) | 8.1 (2.6) | 8.6 (3.7) | 0.5 (5.4) | 7 (88) | 4.12 (0.64) | 11.2 (3.6) |
| 11 | 14 (67) | 8.4 (2.9) | 7.5 (3.6) | -0.8 (3.4) | 12 (86) | 4.61 (0.50) | 10.0 (2.6) |
| 12 | 15 (50) | 6.9 (2.9) | 7.4 (4.1) | 0.4 (4.2) | 10 (67) | 4.33 (0.81) | 10.7 (3.6) |
| 13 | 4 (33) | 5.2 (1.8) | 3.2 (3.4) | -2.0 (4.3) | 1 (25) | 3.75 (0.50) | 7.0 (1.8) |
| 14 | 2 (40) | 8.5 (0.7) | 3.5 (3.5) | -5.0 (2.8) | 1 (50) | 3.50 (0.70) | 9.0 |
| 15 | 2 (40) | 7.5 (4.9) | 4.0 (2.8) | -3.5 (2.1) | 1 (50) | 4.50 (0.70) | 9.0 (0.0) |
| Total | 122 | 76 | |||||
| Response rate | 49% | ||||||
| Usual-care practices | |||||||
| 1 | 7 (78) | 6.8 (2.9) | 3.8 (4.7) | -3.0 (6.0) | 3 (43) | 4.14 (0.90) | 8.2 (2.1) |
| 2 | 8 (80) | 6.8 (3.0) | 3.0 (4.3) | -3.8 (4.9) | 2 (25) | 4.50 (0.92) | 8.0 (3.5) |
| 3 | 13 (68) | 7.6 (2.0) | 6.0 (3.5) | -1.6 (3.6) | 8 (62) | 3.92 (1.38) | 9.3 (3.1) |
| 4 | 8 (100) | 8.5 (2.5) | 1.8 (2.1) | -6.6 (3.7) | 2 (25) | 4.50 (0.53) | 7.5 (2.5) |
| 5 | 12 (86) | 8.0 (2.4) | 5.5 (4.1) | -2.5 (5.0) | 8 (67) | 4.08 (0.90) | 8.8 (2.5) |
| 6 | 1 (100) | 6.0 | 4.0 | -2.0 | 1 (100) | 4.0 | 8.0 |
| 7 | 5 (63) | 9.8 (2.6) | 6.0 (4.7) | -3.8 (3.9) | 3 (60) | 4.40 (0.54) | 10.6 (2.4) |
| 8 | 13 (54) | 7.3 (2.5) | 4.6 (3.4) | -2.6 (4.5) | 8 (62) | 4.07 (0.64) | 9.0 (3.0) |
| 9 | 1 (25) | 4.0 | 0.0 | -4.0 | 0 | 5.00 | 5.0 |
| 10 | 18 (78) | 8.5 (2.9) | 5.5 (4.2) | -2.9 (3.5) | 11 (61) | 4.16 (0.70) | 9.4 (3.0) |
| 11 | 4 (40) | 9.5 (3.0) | 8.5 (5.7) | -1.0 (2.8) | 3 (75) | 3.50 (0.57) | 10.5 (5.1) |
| 12 | 10 (48) | 7.7 (2.7) | 6.1 (4.4) | -1.6 (4.9) | 7 (70) | 4.00 (0.94) | 10.4 (3.3) |
| 13 | 13 (87) | 6.3 (2.1) | 4.8 (2.6) | -1.5 (3.7) | 10 (77) | 4.25 (0.62) | 9.5 (2.3) |
| 14 | 15 (65) | 7.3 (2.6) | 3.8 (4.1) | -3.5 (4.4) | 7 (47) | 4.13 (0.83) | 8.8 (3.0) |
| 15 | 3 (60) | 11.0 (1.0) | 3.6 (3.2) | -7.3 (2.3) | 2 (67) | 3.66 (0.57) | 10.0 (4.0) |
| Total | 131 | 75 | |||||
| Response rate | 69% | ||||||
Table 7 Patient-level primary (GHQ) outcomes during post-intervention period
| Practice pair1 | Returned | General Health Questionnaire mean (s.d.) | GHQ change mean (s.d.) | At 3-month follow-up | ||||
|---|---|---|---|---|---|---|---|---|
| questionnaires n (%) | ||||||||
| At screen | At 3-month follow-up | GHQ≥4 n (%) | Satisfaction mean (s.d.) | Disability mean (s.d.) | EuroQol mean (s.d.) | |||
| Guideline practices | ||||||||
| 1 | 11 (73) | 6.2 (2.6) | 3.6 (3.0) | -2.6 (3.6) | 7 (64) | 4.30 (0.48) | 8.0 (1.7) | 7.2 (1.4) |
| 2 | 6 (60) | 7.3 (3.7) | 4.1 (5.1) | -3.1 (6.0) | 2 (33) | 4.16 (0.75) | 7.8 (2.3) | 7.5 (1.8) |
| 3 | 4 (66) | 9.5 (1.7) | 7.7 (5.3) | -1.7 (3.7) | 3 (75) | 4.25 (0.50) | 10.6 (4.1) | 9.7 (2.6) |
| 4 | 11 (68) | 6.8 (2.9) | 4.3 (3.5) | -2.4 (4.6) | 5 (45) | 4.10 (0.87) | 8.2 (3.6) | 7.4 (1.9) |
| 5 | 5 (71) | 9.2 (3.1) | 5.2 (4.3) | -4.0 (3.3) | 4 (80) | 4.60 (0.54) | 12.0 (3.3) | 9.2 (1.7) |
| 6 | 7 (70) | 8.1 (2.3) | 4.1 (4.0) | -4.0 (3.9) | 3 (43) | 3.28 (1.25) | 7.4 (2.5) | 7.2 (2.6) |
| 7 | 16 (64) | 8.7 (2.4) | 7.9 (5.0) | -0.8 (4.0) | 12 (75) | 4.00 (0.84) | 11.0 (3.9) | 9.5 (2.4) |
| 8 | 13 (92) | 7.3 (2.8) | 4.5 (4.5) | -2.8 (3.3) | 5 (38) | 4.30 (0.75) | 7.4 (2.6) | 7.8 (1.4) |
| 9 | 13 (44) | 6.9 (2.3) | 4.3 (4.7) | -2.6 (4.6) | 5 (38) | 4.07 (0.76) | 8.4 (3.3) | 7.7 (2.2) |
| 10 | 6 (46) | 9.5 (2.4) | 9.0 (2.3) | -0.5 (2.9) | 6 (100) | 3.33 (1.03) | 10.8 (3.1) | 7.1 (0.7) |
| 11 | 14 (53) | 8.0 (2.7) | 8.4 (3.2) | 0.3 (2.7) | 12 (86) | 3.92 (0.86) | 11.0 (2.9) | 8.8 (1.7) |
| 12 | 8 (47) | 8.5 (3.1) | 5.0 (3.4) | -3.5 (4.3) | 5 (62) | 4.25 (1.03) | 8.5 (3.2) | 7.1 (1.8) |
| 13 | 5 (62) | 7.8 (3.3) | 4.4 (1.6) | -3.4 (3.5) | 3 (60) | 4.80 (0.44) | 9.0 (1.8) | 8.4 (2.0) |
| 14 | 3 (42) | 6.0 (1.7) | 6.3 (4.5) | 0.3 (4.7) | 2 (67) | 4.66 (0.57) | 7.6 (2.3) | 8.0 (3.0) |
| 15 | 2 (50) | 10.0 (2.8) | 3.5 (4.9) | -6.5 (7.7) | 1 (50) | 5.00 (0.00) | 10.0 (4.2) | 8.0 (0.0) |
| Total | 124 | |||||||
| Response rate | 61% | |||||||
| Usual-care practices | ||||||||
| 1 | 5 (55) | 8.2 (2.7) | 3.8 (5.4) | -4.4 (5.1) | 2 (40) | 3.60 (0.89) | 7.2 (3.1) | 6.4 (1.5) |
| 2 | 7 (77) | 6.5 (2.5) | 2.2 (2.9) | -4.2 (4.8) | 2 (29) | 4.14 (0.90) | 8.2 (1.9) | 7.2 (1.3) |
| 3 | 14 (58) | 7.2 (2.7) | 4.7 (4.6) | -2.5 (2.7) | 7 (50) | 3.78 (1.05) | 8.3 (3.1) | 7.5 (1.6) |
| 4 | 3 (37) | 6.6 (2.5) | 5.6 (1.5) | -1.0 (1.7) | 3 (100) | 3.66 (0.57) | 7.0 (2.6) | 6.0 (0.0) |
| 5 | 7 (87) | 6.5 (2.6) | 4.4 (3.6) | -2.1 (2.9) | 4 (57) | 4.28 (0.75) | 9.2 (2.6) | 7.8 (1.9) |
| 6 | 3 (60) | 8.0 (2.6) | 5.0 (4.5) | -3.0 (4.3) | 2 (67) | 3.66 (0.57) | 8.6 (2.5) | 7.0 (1.7) |
| 7 | 12 (80) | 6.6 (2.6) | 3.6 (3.5) | -3.0 (2.5) | 7 (58) | 4.41 (0.79) | 7.6 (2.4) | 6.8 (1.1) |
| 8 | 10 (58) | 7.7 (3.1) | 3.4 (2.9) | -4.3 (4.0) | 6 (60) | 4.50 (0.70) | 9.5 (2.6) | 7.1 (1.5) |
| 9 | 7 (63) | 7.2 (2.8) | 6.2 (4.7) | -1.0 (4.3) | 4 (57) | 4.57 (0.53) | 8.8 (2.9) | 8.5 (1.8) |
| 10 | 11 (91) | 8.8 (2.7) | 7.0 (4.5) | -1.8 (4.3) | 8 (73) | 3.72 (1.34) | 11.5 (3.0) | 8.5 (1.3) |
| 11 | 7 (50) | 7.2 (3.2) | 2.7 (3.6) | -4.5 (4.3) | 2 (29) | 4.00 (1.15) | 8.1 (1.9) | 6.8 (1.2) |
| 12 | 9 (47) | 8.8 (3.4) | 7.3 (3.7) | -1.5 (3.7) | 7 (78) | 4.00 (0.70) | 8.1 (1.6) | 8.1 (2.0) |
| 13 | 3 (60) | 7.6 (4.0) | 4.0 (1.7) | -3.6 (5.5) | 1 (33) | 3.66 (0.57) | 8.0 (3.0) | 6.6 (0.5) |
| 14 | 7 (43) | 7.4 (3.7) | 5.5 (5.5) | -1.8 (7.0) | 3 (43) | 4.28 (0.75) | 7.8 (2.4) | 6.2 (1.2) |
| 15 | 3 (60) | 7.6 (2.5) | 7.3 (3.2) | -0.3 (1.5) | 3 (100) | 3.33 (2.08) | 9.6 (2.0) | 7.3 (1.1) |
| Total | 108 | |||||||
| Response rate | 62% | |||||||
| Weighted mean difference1 | 0.45 | 4.3% | 0.20 | 0.68 | 0.75 | |||
| 95% CI | -1.42 to 2.33 | -12.4 to 20.9 | -0.05 to 0.45 | -0.21 to 1.56 | -0.11 to 1.61 | |||
| P | 0.63 | 0.64 | 0.12 | 0.13 | 0.09 | |||
Primary outcome measure, patient-level: repeat GHQ—12
There was no evidence for any impact of the intervention on our primary clinical outcome for patients, i.e. the repeat GHQ—12 score (difference in mean GHQ—12 at 3 months guideline minus usual care (G—UC)=0.45, 95% CI -1.42 to 2.33; P=0.63), nor in the proportion of patients who were still scoring above the threshold for caseness (difference in proportion scoring >3 on GHQ—12 at 3 months, G—UC=4.3%, 95% CI -12.4% to 20.9%). Results indicated worse outcomes (higher GHQ—12 scores and more cases at 3-month follow-up) in the guideline practices than in usual care, although the confidence intervals were wide.
Secondary outcomes, patient-level: disability, satisfaction and QoL
There were no differences in satisfaction (difference in mean satisfaction, G—UC=0.20, 95% CI -0.05 to 0.45; P=0.12) or disability (difference in mean BDQ, G—UC=0.68, 95% CI -0.21 to 1.56; P=0.13) between patients managed by GPs who had received the guidelines and those in the usual-care group (Tables 6 and 7). The trend was for greater satisfaction among patients managed by guideline practices but worse disability (neither significant). The only difference to approach significance was for the EuroQol score (difference in mean Euro-Qol, G—UC=0.75, 95% CI -0.11 to 1.61; P=0.09), indicating worse QoL among patients managed by guideline practices (trend level P<0.10).
DISCUSSION
Many guidelines for the diagnosis and management of psychiatric morbidity in primary care have been developed (Reference Cornwall and ScottCornwall & Scott, 2000), but they vary in scope and quality (Reference Littlejohns, Cluzeau and BaleLittlejohns et al, 1999). Few have been evaluated in pragmatic RCTs. The WHO ICD—10 PHC guidelines (World Health Organization, 1996) have been widely disseminated. Upton and colleagues reported some benefits in a controlled before-and-after study (Reference Upton, Evans and GoldbergUpton et al, 1999).
Main findings
We evaluated a process of local adaptation and dissemination of the 1996 WHO guidelines to see whether there was any impact on clinician behaviour or clinical outcomes for patients. There were two main findings of this study. First, we found no evidence that implementing these guidelines, through our local process of adaptation and extension, which was intended to engender ‘shared ownership’, had an impact on practitioners' detection performance (sensitivity or specificity). Second, there was no effect on clinical outcomes for patients: repeat GHQ—12 scores (mean and proportion that remained cases), disability and satisfaction did not differ significantly between guideline and usual-care practices. Contrary to expectation, the guideline practices achieved higher average disability scores (indicating worse outcome), greater satisfaction with care received but worse quality of life. None of these comparisons was tatistically significant and confidence intervals around estimated intervention effects were quite wide. The trend for worse QoL (one of the four secondary outcomes) may simply be a type 1 error.
Strengths
Our results are based on a sample of practices from three sectors of a large, urban mental health service, more than 2000 screened patients and more than 100 GPs detecting disorder. Over two-thirds of the practices approached participated, including single-handed and fundholding practices. The characteristics of our sample correspond well with what is already known of the epidemiology of psychological distress in PHC and its detection by GPs. We therefore expect that our negative findings are widely generalisable. We used a pair-matched design (Reference Ukoumunne, Gulliford and ChinnUkoumunne et al, 1999) to ensure that the outcome of randomisation was balanced for social deprivation, which we thought would have an influence on our practice-and patient-level outcomes. Our decision to match a priori on social deprivation appears to be justified, since loss to follow-up at the 3-month postal questionnaire survey was correlated with deprivation.
Our criterion for evaluating GP detection performance was a score of >3 on the GHQ—12, not a clinical interview, and our outcomes were all self-report. These design considerations were pragmatic and made it possible to implement the study in a large number of practices.
Limitations
There were small differences in the baseline detection performance of the guideline and usual-care practices. Where possible — for practice detection outcomes — we applied a meta-regression approach that enabled us to adjust for baseline imbalance using cluster-level performance from the baseline detection phase as a covariate. This approach has been recommended (Reference Ukoumunne and ThompsonUkoumunne & Thompson, 2001) for cluster randomised trials with repeated cross-sectional designs, where different patients are surveyed during pre-intervention and post-intervention periods. It is preferred over analyses of change from baseline (estimated using an interaction of intervention group by time-period) because baselines are usually measured with low precision. An additional factor is that the baseline outcome may not be prognostic, i.e. may not correlate with intervention outcomes. These design features can lead to bias in results and increase the noise, leading to a reduction in the precision of the estimated intervention effect. Ideally, enough cluster (practices) would be recruited to reduce the potential for a poor outcome of randomisation. In our case the baseline adjustment did not alter the conclusions, with baseline performance proving useful (prognostic) for only one of the two cluster-level outcomes (practice sensitivity). When the baselines are not prognostic, Ukoumunne & Thompson (Reference Ukoumunne and Thompson2001) have argued that interpretation should focus on the unadjusted effect, since the adjusted analysis places too much weight on the baselines. Our baseline measures were based on small samples, which limited our potential to adjust for differences between the practices that arose as an outcome of randomisation. For one outcome (sensitivity), our meta-regression adjustment increased the precision of the estimated intervention effect. In the second, the approach simply added noise. A low response rate to follow-up questionnaires in the guideline practices during the baseline period prohibited use of the meta-regression procedure for clinical outcomes. It might otherwise have been possible to aggregate these outcomes to cluster level and use them as covariates.
It is possible that our use of a categorical diagnostic approach reduced the fidelity of measurement of practitioner and patient variation. It is, nevertheless, an accepted tradition in primary care psychiatric research. We do not know to what extent the GPs made use of our guideline handbook, nor do we know the extent to which the guideline advocate was able to disseminate their contents to other primary care colleagues. We did not measure, but were not made aware of, any contamination between the guideline and usual-care practices. The study could not be blinded since the development of the intervention comprised participation in a local adaptation process and receipt of a personal copy of the guidelines.
Hampshire Depression Project
Our findings are consistent with those of the Hampshire Depression Project (HDP), a larger cluster RCT of educational intervention for GPs on the recognition, management and treatment of depression (Reference Thompson, Kinmonth and StevensThompson et al, 2000). The HDP, which involved 60 practices and a self-selected sample of over 150 physicians, evaluated a more intensive educational approach to dissemination of a clinical practice guideline for depression, using a continuing medical education model (with quality testing of the educational component). The HDP screened and followed up more patients and involved more practitioners, but their sample of GPs was self-selected within participating practices. The participation rate among invited practices was much higher in our study than in the HDP (70% v. 26%) and all practitioners within participating practices were monitored, which may improve generalisability. Response rates to postal questionnaires were similar in both studies. In the HDP, response rates at 6 weeks ranged from 48% to 70%, depending on stage of study.
The future
Over the past few years, studies on guideline dissemination have consistently failed to demonstrate significant effectiveness in changing clinician behaviour. Evaluations of more structured implementation strategies have produced some favourable results, however, and we therefore designed and evaluated an education-based implementation strategy. Because of practical limitations, we were unable to measure important process variables, and in attempting to interpret our negative result we cannot discriminate between several possible explanations. These include failure of the GPs to read the guidelines, failure to implement them and failures in the content of the guidelines themselves in terms of their evidence base or relevance. Although there can be no doubt that guidelines such as those examined here are an important source of reference and guidance for PHC physicians, their effectiveness in changing clinician behaviour will require more complex and evidence-based strategies, probably involving multi-faceted targeting of interventions.
Since this study was carried out, the 1996 WHO guidelines have been further adapted. The latest version (currently unevaluated) is available free from the WHO collaborating centre website: http://www.rsm.ac.uk/pub/bkwhopdf.htm
Clinical Implications and Limitations
CLINICAL IMPLICATIONS
-
▪ Participation in a process of adaptation and extension of the ICD—10 Primary Health Care Guidelines failed to change practitioner behaviour (detection rates: sensitivity and specificity) or influence patient outcomes (General Health Questionnaire, disability, satisfaction, quality of life). Only specificity and satisfaction favoured guideline practices.
-
▪ These negative findings highlight limitations in the ability of guideline interventions to influence UK general practitioners' (GPs') management of psychiatric morbidity.
-
▪ These results are consistent with other studies in the UK that have adopted an intensive approach to dissemination of guidelines, e.g. medical education models.
LIMITATIONS
-
▪ We did not measure whether GPs used the guidelines, nor did we measure any contamination that may have influenced the performance of usual-care practices.
-
▪ Despite randomisation (at cluster level), there were small differences in baseline detection performance between practices. Poor response to the 3-month, postal questionnaire follow-up for guideline practices during the baseline period limited adjustment for baseline to detection outcomes only, and not for patient outcomes.
-
▪ Analysis did not take into account missing data from patients who did not respond to postal questionnaire follow-up, although stratification by social deprivation may have helped to reduce bias due to loss to follow-up (by ensuring balance). Power to detect small intervention effects for patient-level outcomes was low, and no adjustment was made for possible imbalance in patient-level covariates.
Acknowledgements
Guideline development and revision was performed by a panel comprising: Dr C. Ree, Dr T. J. Gollin, Dr M. Byron, Dr N. M. Reynolds, Dr P. Bagshaw, Dr M. Jones, Dr S. C. Pietersen, Dr D. S. Kessler, Dr S. Meehan, Dr D. R. Darvill, Dr J. E. Jones, Dr T. M. Southwood, Dr J. P. S. Parrott, Dr J. S. Wright, Dr T. H. Frewin, Dr N. P. Ring, Dr W. Mitchell, Dr M. Evans, T. Hext, K. Macleod, P. Appleton, P. Evans, M. Hilton, S. Summerhayes, M. Sharman, S. Smith, J. Baker, Dr M. Mitcheson, A. Hampshire, J. L. Llewelyn, Dr J. Potokar, R. Jones, Dr N. Moore, F. Williams.
The editorial team were: C. Crilly (Primary Care), J. Evans (Psychiatry), G. Harrison (Psychiatry), G. McCann, D. Sharp (Primary Care), C. Smith and E. Wilkinson (Psychiatry).
B. Blair assisted with the guide to the Mental Health Act and M. Fairfoot provided assistance with the resources directory and guide to statutory services. J. Colyer provided administrative support.
The Evaluating Guideline Outcomes (EGO) study was funded by the Department of Health (grant reference JRI26/0634). T.C. was supported by a Medical Research Council Training Fellowship in Health Services Research.


eLetters
No eLetters have been published for this article.