Abstract
Intrauterine growth retardation and diabetes mellitus during human gestation result in significant losses of fetal and neonatal brain iron. Brain iron deficiency is associated with impaired cognitive processes including memory and attention. The regional distribution of iron staining and cytochrome c oxidase (CytOx) activity have not been mapped in the iron-sufficient or -deficient neonatal rat. CytOx is the iron-containing terminal enzyme in oxidative phosphorylation; its activity reflects neuronal metabolism. We hypothesized that neonatal brain iron deficiency differentially decreases iron and CytOx activity in brain regions, with more pronounced losses in structures involved in recognition memory. Pregnant Sprague Dawley rats were fed either an iron-deficient or -fortified diet from gestational d 1 until postnatal d 10. Iron staining and CytOx activity of 20 brain structures were mapped histochemically in 25 rats from each group. Brain iron staining was reduced from 75% to 100% and CytOx staining was decreased from 0% to 42% in the iron-deficient group (p < 0.001). Areas with significantly reduced CytOx activity (p < 0.001) included all measured subareas of the hippocampus (CA1: 42%, CA3ab: 34%, CA3c: 33%, and dentate gyrus: 32%), the piriform cortex (17%), the medial dorsal thalamic nucleus (28%), and the cingulate cortex (41%). In contrast, the anterior thalamic nucleus, the lateral amygdaloid nucleus, and the medial habenula, areas not involved in higher cognitive functions, did not have significantly reduced CytOx activity (0%, 10%, and 16%, respectively). We conclude that perinatal iron deficiency differentially reduces neuronal metabolic activity, specifically targeting areas of the brain involved in memory processing.
Main
In human infants, dietary iron deficiency acquired between 6 and 24 mo postnatally is associated with cognitive impairments that may persist in spite of iron rehabilitation (1–5). These impairments include lower mental developmental index scores on the Bayley Scales of Infant Development and decreased responsiveness to examiners, as well as decreased reactivity to ordinary stimuli. Arguably, brain iron deficiency in the fetus or neonate could be more detrimental than postnatal iron deficiency because of the rapidity of brain growth during this critical developmental period (6). Diabetes mellitus and intrauterine growth retardation during pregnancy can result in up to a 40% reduction in neonatal brain iron concentration (7, 8). In addition, infants of diabetic mothers and intrauterine growth-retarded infants demonstrate electrophysiologic indices of abnormal recognition memory processing as newborns and at 6 mo of age (9, 10), and are at higher risk for poorer long-term neurocognitive outcomes (11, 12).
The biologic mechanisms leading to the neurocognitive behavioral sequelae of iron deficiency are not well understood. The major hypotheses that have been suggested revolve around the role of brain iron in enzyme systems that regulate brain growth (ribonucleotide reductase), myelination (delta-9 desaturase), dopamine D2 receptor synthesis (tyrosine hydroxylase), and energy production (cytochromes) (13–20). Cytochrome c oxidase (CytOx) is involved in the last step of the oxidative phosphorylation reaction. It has a critical role in the generation of ATP because it transfers the reducing equivalents of the respiratory chain to oxygen. As an integral component of cellular oxidative metabolism by neurons, CytOx is essential for normal neuronal cellular function and thus represents a quantifiable marker of neuronal metabolic activity (14). In vivo CytOx activity can be estimated by a histochemical assay, which has been shown to have a direct correlation with tissue CytOx concentration (21).
In the rat, the accretion of iron by the brain changes throughout late fetal and early postnatal life. Brain iron concentration peaks at birth and decreases through the weaning period, only to increase again during critical periods such as myelination (19). In humans, myelination begins in the prenatal period and continues for 15–20 y after birth (22), and in the rat begins around postnatal day (PND) 10 and continues throughout life (23). The distribution of iron within the postweanling and adult rat brain is heterogeneous and changes over time. In the adult, the basal ganglia, substantia nigra, and deep cerebellar nuclei have the highest concentrations (24), whereas the hippocampus has the highest concentration in the postweanling animal (25). Neither the distribution of iron staining in the brain nor the effect of perinatal iron deficiency on iron-containing bioactive compounds such as CytOx have been studied in the neonatal rat.
Because studies of iron-deficient (ID) infants consistently demonstrate cognitive impairment, we hypothesized that perinatal iron deficiency alters the regional distribution of CytOx activity in the neonatal brain and that circuits involved in cognitive processing, particularly memory, are preferentially affected. Accordingly, the effects of perinatal iron deficiency on both iron stain and neuronal metabolism, using CytOx as a marker, were quantified. Specific attention was given to brain structures associated with memory processing and emotional evaluation, including the hippocampal formation and amygdala. Several other areas that were hypothesized to be unrelated to these behavioral functions were studied, including the arcuate nucleus of the hypothalamus, the lateral nucleus of the thalamus, the medial and lateral habenula, the nucleus accumbens, and the substantia nigra. Although the nucleus accumbens is unrelated to memory processing, Youdim et al. have demonstrated decreased D2 receptor in this structure in ID postweanling rats (26).
METHODS
Animal preparation and study design.
The study was approved by the Animal Care Committee of the University of Minnesota and its guidelines were followed during the experiments. From gestational d 1 until PND 10, plug-positive pregnant Sprague Dawley rats (Harlan Sprague Dawley, Indianapolis, IN, U.S.A.) received either an iron-fortified diet (Teklad 4% Mouse/Rat Diet 7001, Harlan-Teklad, Madison, WI, U.S.A.) or a low-iron diet (Formula TD 80396, Harlan-Teklad). The iron-fortified diet contained 198 mg elemental Fe/kg and the low-iron diet 3–6 mg elemental Fe/kg chow. The pups born to dams on the iron-fortified diet served as iron-sufficient (IS) controls and those born to dams on the low-iron diet served as the ID experimental group. Animals had free access to food and water and were maintained in a 12-h, day-and-night cycle at room temperature.
Five pups from each group were killed on PND 10 to obtain liver nonheme iron concentrations. Twenty-five animals from each group had their brains removed on PND 10 for iron and CytOx histochemistry.
Animal preparation.
At the time of sacrifice, the pups were deeply anesthetized with sodium pentobarbital (60 mg/kg body weight, i.p.) and then perfusion fixed transcardially with normal saline, followed by 5% neutral buffered formalin solution (Sigma Chemical Co., St. Louis, MO, U.S.A.) and 5% sucrose in 0.1 M phosphate buffer (pH 7.4). The brains were rapidly removed from the skull, postfixed in the same fixative for 4 h at 4°C, and were cryoprotected by serial overnight passage in increasing sucrose concentrations (20% and 30%) in 0.05 M phosphate buffer at 4°C. The brains were mounted in a frozen tissue embedding solution (HISTOPREP™, Fischer Scientific, Fair Lawn, NJ, U.S.A.). Serial 15-μm coronal frozen sections were obtained throughout the brains of the experimental and control animals using a cryostat at −20°C to −25°C (Bright Instruments Co., Ltd., Huntingdon, England). Sections were mounted on poly-l-lysine coated slides and stored at −80°C until histochemical analysis was performed.
Study design.
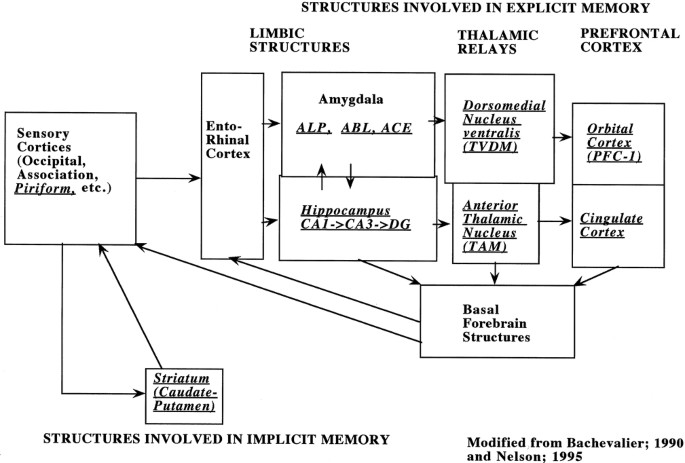
Based on recently published diagrams of the putative circuits involved in memory processing in humans (27) and in animals (28, 29) (Fig. 1), we studied brain structures involved in explicit and implicit forms of memory as well as brain structures without a known function in memory formation. Explicit memory was further subdivided into circuits involved in recognition memory, such as the hippocampus, and those involved in affective or emotional memory, such as the amygdala. Using an atlas of the developing rat brain (30), we then chose four brain sections that included the brain regions of interest (Table 1).
Tissue iron assay.
Liver iron concentrations were assayed as previously described (8, 31) and expressed as micrograms of elemental iron per gram dry tissue weight. Briefly, the tissues were thoroughly rinsed in normal saline and lyophilized for 72 h, after which dry weights were obtained. The tissues were digested in 10 mL of a 4:1 nitric:perchloric acid and their iron content was assayed by atomic absorption spectroscopy (31, 32). Values were compared with stock iron standards (Sigma Chemical Co.) diluted to the values in the expected range of tissue iron concentrations.
Iron histochemistry.
The brain sections were stained for iron by Benkovic and Connor's modification of Perls stain (33). Briefly, the sections were brought to room temperature and incubated in a 5% solution of DMSO (three changes of 5 min each) followed by 10% potassium ferrocyanide for 5 min. They were then incubated in a freshly made Perls solution (10% potassium ferrocyanide and 10% HCl in a 7:3 ratio with 0.1% Triton X-100) for 20 min at room temperature. For intensification of Perls reaction with 3,3′ diaminobenzidine, sections were thoroughly rinsed in distilled water (twice for 5 min each) and were incubated in a freshly made solution of 3,3′ diaminobenzidine (40 mg in 100 mL of 0.05 M PBS (PBS), to which 0.08 mL of 30% H2O2 was added just before the incubation) for 25 min at room temperature. The reaction was terminated by rinsing the sections in PBS (three changes of 5 min each). The sections were then serially submerged in increasing concentrations of ethyl alcohol (5 min each in 70% and 80%, followed by 10 min each in 95% and 100% ethanol) before being immersed in a clearing agent (HEMO-DE™, Fischer Scientific) for 10 min. They were then air dried and coverslipped using Permount (Fischer Scientific). Control sections were incubated in Perls solution with PBS substituted for potassium ferrocyanide. The control slides did not show any positive staining.
Iron histochemistry analysis.
Brain sections were visualized with light microscopy (Nikon Optiphot, Nippon Kogaku K.K., Tokyo, Japan) at ×400. A 100-mm2 calibrated grid was placed in an eyepiece and then placed once centrally within each nuclei of interest. All the iron-stained cells within the boundaries of the grid were counted. One observer (K.S.) completed the brain iron quantitation.
CytOx histochemistry.
Brain sections were stained for CytOx activity using the diaminobenzidine method of Hevner and Wong-Riley (21). Briefly, the tissue sections were incubated in 100 mL of 0.1 M phosphate buffer (pH 7.4) containing 50 mg 3,3′ diaminobenzidine, 25 mg cytochrome c, and 4 g sucrose (all reagents from Sigma Chemical Co.) at 37°C for 2 h in the dark. The reaction was terminated by immersing the slides three times for 5 min each in the 0.1 M phosphate buffer at room temperature. The sections were dehydrated, cleared, and coverslipped as described above for iron histochemistry.
CytOx histochemistry analysis.
The brain sections were visualized through a 4× objective in a light microscope (Model BH-2, Olympus America Inc., Melville, NY, U.S.A.) using a green filter (wave length 510–550 nm) to enhance the contrast and a neutral density filter (Schott Glass Technologies Inc., Duryea, PA, U.S.A.) to attenuate the light intensity.
Digital microscopic images were collected using a Cohu 4915 CCD camera (Cohu, Inc., San Diego, CA, U.S.A.), a Power Macintosh 7100 computer equipped with a model LG-3 frame grabber (Scion Corp., Frederick, MD, U.S.A.) and Scion Corporation's version of the public domain National Institutes of Health Image program (available on the Internet by anonymous FTP from zippy.nimh.nih.gov or on disk from the National Technical Information Service, Springfield, VA, U.S.A., part number PB95–500195GEI).
The intensity of background light was maintained at a constant level among the sections such that the histogram of the gray scale values (range: 1–254) of the overall image showed a normal distribution and did not stack at either the black or white end of the spectrum. Dark areas were assigned a higher value and lighter areas a lower value (white 1; black 254). Hence, a lower gray scale value indicated less staining and subsequently a greater loss of CytOx activity. The intensity of CytOx reactions in the brain structures of interest was measured from the image projected and frozen on the computer screen. Larger nuclei were outlined using a cursor. For very narrow brain regions where the cursor could not be used reliably, an 11 × 11-pixel grid was randomly placed three times within the nuclei and the average OD value obtained.
Nissl histochemistry.
Because iron, as a component of ribonucleotide reductase, may play a role in cell division and cell growth, brain sections were stained for Nissl substance via Vogt's method (34) to assess for cell density. The brain sections were brought to room temperature for 10 min and subsequently incubated in a working solution of cresyl violet acetate [625 mM cresyl violet acetate (Dye content 70%, Sigma Chemical Co.) in a buffer containing 15 mM sodium acetate buffer and 3 mL/L glacial acetic acid] at room temperature for 60 min. Sections were briefly immersed in 95% ethyl alcohol, dehydrated in absolute alcohol (twice for 10 min each), then cleared and coverslipped as described above for iron histochemistry.
Nissl histochemistry analysis.
Brain sections were visualized with light microscopy (Nikon Optiphot, Nippon Kogaku K.K., Tokyo, Japan) at ×400. A 100-mm2 calibrated grid was placed in an eyepiece and subsequently placed once within hippocampal subarea CA1 and the caudate putamen of a representative number of sections (n = 10). Using landmarks identified by Sherwood (30), an attempt was made to place the grid in the same location across the specimens. All the Nissl stained cells within a 10-mm × 3-mm boundary of the grid were counted. One observer (J.W.) completed the brain Nissl quantitation.
Statistical analysis.
The mean ± SEM for the number of iron-positive cells, the number of neurons/30 mm2 and the CytOx activity, as expressed by OD values, were compared between ID and IS groups by two-tailed unpaired t tests. Given the number of comparisons made, a p value of < 0.01 was considered statistically significant.
RESULTS
The ID pups had lower liver iron concentrations compared with IS controls (59.5 ± 4.0 versus 404.0 ± 19.3, p < 0.001), which is in agreement with previous studies from our lab both in infants (8, 35) and in rats (36). The mean litter sizes were equivalent between groups (ID: 9 pups/mother versus IS: 10 pups/mother).
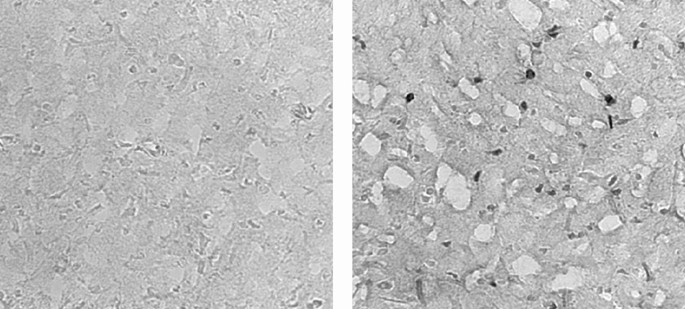
The ID brains had a mean of 88 ± 4% less iron staining among the 20 structures assessed compared with the IS brains. Iron-positive cells in the perihippocampal region of an ID and an IS brain are shown in Figure 2. Each ID brain structure had significantly less iron staining than control Tables 2A–C). Areas with ≥90% loss of iron staining in descending order included hippocampal subareas CA3ab and CA1, the central nucleus of the amygdala, the medial habenula, the dentate gyrus, the lateral habenula, the dorsomedial nucleus of the thalamus, the reticulate zone of the substantia nigra, and hippocampal subarea CA3c. The entorhinal cortex, which has projections to both recognition memory and emotional or affective memory circuits, had 85% less iron staining (0.2 ± 0.5 iron-positive cells/grid in the ID group versus 1.3 ± 1.9 in the IS group;p = 0.005). The caudate putamen, which is the primary structure used in implicit memory, had 93% less iron staining (0.2 ± 0.5 versus 2.9 ± 3.3 iron-positive cells;p = 0.002).
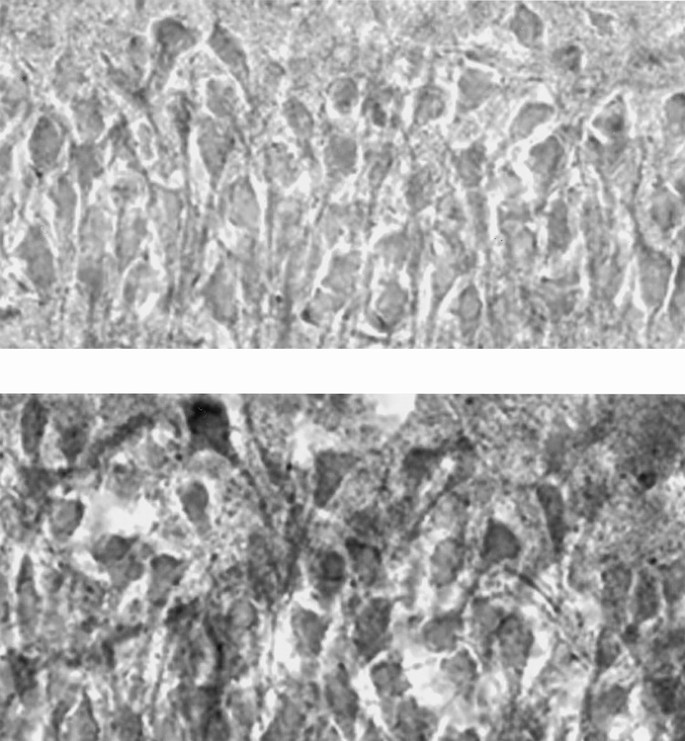
The ID brains had a mean of 27 ± 3% less CytOx activity among the 20 structures. An example of CytOx activity in hippocampal subarea CA1 of an ID and IS brain is shown in Figure 3. Unlike iron staining, significant differences in CytOx activity between the ID and control groups were present in only 14 of the 20 structures Tables 3A–C). Areas with significantly reduced CytOx activity in descending order included hippocampal subarea CA1, the anterior portion of the piriform cortex (also referred to as the orbital cortex), the substantia nigra-zona compacta, hippocampal subarea CA3ab, hippocampal subarea CA3c, the dentate gyrus, and the periventricular arcuate nucleus of the hypothalamus. Interestingly, the 14 structures with significant loss of CytOx activity and the 6 structures with insignificant loss of CytOx activity had similar loss of iron staining (85 ± 4%versus 90 ± 4%). No relationship was found between the percent loss of iron staining and the loss of CytOx activity across the 20 structures (r = 0.07;p = 0.77). Neither the entorhinal cortex nor the caudate putamen had significant CytOx loss.
Photomicrograph of hippocampal subarea CA1 of the rat brain after completion of the diaminobenzidine reaction for cytochrome c oxidase (CytOx) activity. The neurons of the iron sufficient (IS) brain (bottom) are more richly stained and thus have more CytOx activity than the iron-deficient (ID) brain (top). Magnification ×500.
To determine whether the decrease in CytOx staining in the 14 structures was potentially due to decreased cell number rather than to decreased staining in each cell, we assessed neuronal density by Nissl staining in one representative brain area with significant CytOx loss (CA1) and in one brain area without any CytOx loss (caudate putamen). No differences in cell number per 3 × 10 mm grid were seen between the ID and IS brains in either region. In CA1, the ID animals had a neuronal density of 150 ± 11 neurons/30 mm2 whereas the ID animals had a density of 153 ± 15. Similarly, in the caudate putamen, the ID animals had a neuronal density of 86 ± 5 cells/30 mm2 whereas the IS animals had a density of 72 ± 14.
DISCUSSION
Perinatal iron deficiency differentially alters the regional distribution of CytOx activity in the neonatal rat brain, with the hippocampal formation and its prefrontal connections having the greatest percent CytOx loss. These differences in CytOx activity were not due to decreased neuronal density and thus were most likely due to decreased intracellular CytOx activity. In contrast, other structures such as the amygdala and caudate putamen had insignificant loss of CytOx activity. The fact that CytOx loss ranged from 0% to 42% among the structures, in spite of relatively uniform loss of iron staining, implies that there is prioritization of iron incorporation into bioactive compounds within brain regions.
There is ample evidence that prioritization of available iron occurs among organs as well as among iron-containing compounds within organs during ID states. Inter-organ prioritization in the ovine fetus and neonate occurs when hepatic storage iron is lost initially, followed by myocardial and CNS iron to preserve iron delivery to the red cell mass (37–39). Similar prioritization has been demonstrated in human infants of diabetic mothers where hepatic iron is reduced by 93%, cardiac iron by 55%, and brain iron by 40% (8, 39). Evidence for intra-organ prioritization of iron is demonstrated in neonatal sheep and guinea pigs, where myocardial cytochrome c is preserved at the expense of myoglobin during progressive iron deficiency (31, 39, 40). The current study supports the concept of regionalization of iron in the form of bioactive compounds among brain structures during significant iron deficiency.
The presence of iron in various brain structures changes throughout early postnatal development in the rat, implying that regional iron accretion and utilization is highly developmentally regulated. Overall brain iron concentration peaks at birth and decreases through the weaning period, only to increase again during critical periods such as myelination (41). In the IS adult brain, iron is heterogeneously distributed; the basal ganglia, substantia nigra, and deep cerebellar nuclei have the highest concentrations (24). Brain iron is also heterogeneously distributed in the IS postweanling rat, with the hippocampus having the highest concentration (25, 42). Imposition of iron deficiency in postweanling rats preferentially decreases hippocampal and cortical brain iron. Although Erickson et al. did not measure whether bioactive iron compounds such as CytOx were preserved in those structures, they did demonstrate increased transferrin concentration in the hippocampus (25). Higher levels of transferrin may represent an attempt to up-regulate iron delivery to this structure to preserve concentrations of bioactive compounds like CytOx during the ID state.
The effect of iron deficiency on regional brain iron staining has not been studied in the fetal/neonatal rat before the current study. With a degree of perinatal iron deficiency similar to that seen in humans (7, 8), significant iron loss is seen across all structures of the rat brain.
In contrast to iron, the wider range of CytOx loss implied greater regional differences in uptake of iron for synthesis of this bioactive compound. The data demonstrating no differences in the amount of iron loss when comparing the regions with significant CytOx loss with the regions with no CytOx loss supported this concept, along with the fact that there was no correlation between iron loss and CytOx loss. The regulatory elements promoting this differential uptake in various brain regions in the perinatal rat are currently unknown, but may be related to regional transferrin/transferrin receptor expression. Morris et al. have demonstrated that CytOx activity has a similar distribution to that of transferrin receptor in the human CNS (43).
CytOx activity is a reasonable indicator of neuronal activity (21). The potential neurophysiologic consequences of selected areas of CytOx loss during perinatal iron deficiency can be viewed in light of the proposed schematic diagram, drawn from comparative human, primate, and rat data, of the flow of information involved in explicit and implicit memory formation among different brain structures (Fig. 1) (27–29). Implicit memory function is characterized by perceptual and motor learning processes that do not involve conscious awareness. The caudate putamen is central to this type of memory. Explicit memory involves the learning of facts and experiences of which we are consciously aware (27, 44). This type of memory encompasses emotional/affective circuits and recognition memory pathways. The amygdala, an element of the emotional circuit, appears to participate in learning, especially when the reinforcement is highly arousing, and thus tends to focus our attention on a given task. The hippocampal formation, the central structure in recognition memory, and its multiple prefrontal connections are essential for spatial memory processing and transferring short-term memory items into long-term storage (27, 44, 45).
Overall, the main targeted areas of iron deficiency were the hippocampal formation and the prefrontal projections for the entire explicit memory circuit. In our study, two structures of the emotional/affective memory circuit had significant loss of CytOx activity, the orbital cortex and the dorsomedial thalamic nucleus. Six out of seven of the brain structures in the recognition memory circuit also demonstrated CytOx loss. Of great concern, CytOx was decreased in each structure of the hippocampal formation (subareas CA1, CA3a,b, and CA3c, the dentate gyrus, and the subiculum). The cingulate cortex, the prefrontal projection of the hippocampal formation and a structure critically involved in attention, also demonstrated CytOx loss.
The hippocampus seems particularly vulnerable to toxic and metabolic insults (46–48). Felt and Lozoff, using a similar perinatal iron deficiency model, demonstrated significant abnormalities in hippocampally based recognition memory tasks at 2–1/2 to 3 mo of age despite dietary iron repletion (49). Although they did not study regional brain iron metabolism, their results are consistent with the neurobehavioral manifestations of abnormal hippocampal function and provide behavioral confirmation of our metabolic findings. The combined results also suggest there may be a critical window early in life for iron rehabilitation, which, if missed, results in permanent cognitive deficits.
The relevance of the findings in this rat model of perinatal iron deficiency to the human condition must be carefully considered because of the extrapolations that needed to be made in creating the model. The autopsy studies of newborn infants of diabetic mothers and intrauterine growth-retarded infants demonstrated a 40% reduction in cortical brain iron concentrations (7, 8). This loss of cortical iron was assumed to be representative of the degree of loss throughout the brain and was supported by the relatively homogenous loss of Perls staining in our rat model. The perinatal ID rat model used in the current study was the same as previously used by Rao et al. (36) in which they achieved a 45% reduction in whole brain iron concentration. Because Perls and CytOx staining of brain sections was not performed in the human autopsy studies, the degree of ferritin (Perls) or cytochrome iron (CytOx) loss in human populations with a 40% loss of brain iron concentration is unknown. Furthermore, the growth velocity of perinatal rats is greater than humans, likely exaggerating their iron requirements and perhaps the CytOx loss. Thus, extrapolations of the functional implications of the loss of storage or bioactive iron compounds from the rat to newborn humans remain speculative.
Nevertheless, our study may also help explain recent neurobehavioral findings in human infants. Nelson et al. demonstrated electrophysiologic evidence of abnormal hippocampal functioning in newborn infants of diabetic mothers when tested using an auditory recognition paradigm (9, 10). In this study, newborn infants of diabetic mothers were less able compared with control infants to distinguish a familiar voice, that of their mother, from a stranger's voice. These differences seem to persist when infants are retested at 6 mo of age. This auditory discrimination task is thought to be hippocampally mediated (27). Thus, it may be reasonable to hypothesize that these electrophysiologic findings may be related to abnormal hippocampal neuronal metabolism due to fetal iron deficiency.
In summary, perinatal iron deficiency of the magnitude seen in human newborns causes significant loss of CytOx activity in selected brain structures. The hippocampus and its prefrontal projections appear most vulnerable—a finding consistent with the known behavioral sequelae of perinatal iron deficiency.
Abbreviations
- CytOx:
-
cytochrome c oxidase
- ID:
-
iron deficient
- IS:
-
iron sufficient
- PND:
-
postnatal day
References
Lozoff B, Wolf AW, Urrutia JJ, Viteri FE 1985 Abnormal behavior and low developmental test scores in iron-deficient anemic infants. J Dev Behav Pediatr 6: 69–75.
Lozoff B, Brittenham GM, Wolf AW, McClish DK, Kuhnert PM, Jimenez E, Jimenez R, Mora L, Gomez I, Krauskoph D 1987 Iron deficiency anemia and iron therapy effects on infant developmental test performance. Pediatrics 79: 981–995.
Lozoff B, Jimenez E, Wolf AW 1991 Long-term developmental outcome of infants with iron deficiency. N Engl J Med 325: 687–694.
Lozoff B, Wolf AW, Jimenez E 1996 Iron deficiency anemia and infant development: effects of extended oral iron therapy. J Pediatr 129: 382–389.
Walter T, De Andrace I, Chadud P, Perales CG 1989 Iron deficiency anemia: adverse effects on infant psychomotor development. Pediatrics 84: 7–17.
Dobbing J 1990 Vulnerable periods in developing brain. In: Dobbing J (ed) Brain, Behaviour, and Iron in the Infant Diet. Springer-Verlag, London, 1–17.
Georgieff MK, Petry CD, Oyer CE 1996 Liver and brain iron deficiency in newborn infants with bilateral renal agenesis (Potter's syndrome). Pediatr Pathol 16: 509–519.
Petry CD, Eaton MA, Wobken JD, Mills MM, Johnson DE, Georgieff MK 1992 Iron deficiency of liver, heart and brain in newborn infants of diabetic mothers. J Pediatr 121: 109–114.
deRegnier RA, Nelson CA, Thomas K, Wewerka S, Tribby-Walbridge S, Georgieff MK 1998 Auditory brain maturation and recognition memory in newborn infants of diabetic mothers. Pediatr Res 43: 212Aabstr
Nelson CA, deRegnier RA, Wewerka SS, Tribby-Walbridge SR, Georgieff MK 1998 Electrophysiologic assessment of recognition memory in 6-month-old infants of diabetic mothers and growth retarded infants. Pediatr Res 43: 223Aabstr
Rizzo T, Nikkel LJ, Jakus MR, Metzger BE 1994 Neuropsychological developments in offspring of diabetic mothers. In: Tejani N (ed) Obstetrical Events and Developmental Sequelae. CRC Press, Boca Raton, 95–106.
Winer EK, Tejani N 1994 Four-to-seven-year evaluation in two groups of small-for-gestational-age infants. In: Tejani N (ed) Obstetrical Events and Developmental Sequelae. CRC Press, Boca Raton, 77–94.
Youdim MBH, Green AR, Bloomfield MR, Mitchell BD, Heal DJ, Grahame-Smith DG 1980 The effects of iron deficiency on brain biogenic monoamine biochemistry and function in rats. Neuropharmacology 19: 259–267.
Dallman P 1985 Biochemical basis for the manifestations of iron deficiency. Annu Rev Nutr 6: 13–40.
Larkin EC, Jarratt BA, Rao GA 1986 Reduction of relative levels of nervonic to lignoceric acid in the brain of rat pups due to iron deficiency. Nutr Res 6: 309–317.
Yu GS, Steinkirchner TM, Rao GA, Larkin EC 1986 Effect of prenatal iron deficiency on myelination in rat pups. Am J Pathol 125: 620–624.
Yehuda S 1990 Neurochemical basis of behavioural effects of brain iron deficiency in animals. In: Dobbing J (ed) Brain, Behaviour, and Iron in the Infant Diet. Springer-Verlag, London, 63–81.
Larkin EC, Rao GA 1990 Importance of fetal and neonatal iron: adequacy for normal development of central nervous system. In: Dobbing J (ed) Brain, Behaviour, and Iron in the Infant Diet. Springer-Verlag, London, 43–62.
Connor JR 1994 Iron acquisition and expression of iron regulatory proteins in the developing brain: manipulation by ethanol exposure, iron deprivation and cellular dysfunction. Dev Neurosci 16: 233–247.
Tanaka M, Kariya K, Kaihatsu K, Nakamura K, Asakura T, Kuroda Y, Ohira Y 1995 Effects of chronic iron deficiency anemia on brain metabolism. Jpn J Physiol 45: 257–263.
Wong-Riley MTT 1989 Cytochrome oxidase: an endogenous metabolic marker for neuronal activity. Top Neurosci 12: 94–101.
Yakovlev PI, Lecours AR 1967 Myelogenetic cycles of regional maturation of the brain. In: Minkowski A (ed) Regional Development of the Brain in Early Life. Blackwell, Oxford, 3–70.
Davison AN 1969 Biochemistry and the myelin sheath. Sci Basis Med Annu Rev, 220–235.
Hill JM 1988 The distribution of iron in the brain. In: Youdim MBH (ed) Brain Iron: Neurochemistry and Behavioural Aspects. Taylor and Francis, London, 1–24.
Erikson KM, Pinero DJ, Connor JR, Beard JL 1997 Regional brain iron, ferritin and transferrin concentrations during iron deficiency and iron repletion in developing rats. J Nutr 127: 2030–2038.
Youdim MBH 1990 Neuropharmacological and neurobiochemical aspects of iron deficiency. In: Dobbing J (ed) Brain, Behaviour, and Iron in the Infant Diet. Springer-Verlag, London, 83–106.
Nelson CA 1995 The ontogeny of human memory. Dev Psychol 31: 723–738.
Bachevalier J 1990 Ontogenetic development of habit and memory formation in primates. Ann N Y Acad Sci 608: 457–477.
Steckler T, Drinkenburg WHIM, Sahgal A, Aggleton JP 1998 Recognition memory in rats—II. Prog Neurobiol 54: 313–332.
Sherwood NM, Timiras PS 1970 A Stereotaxic Atlas of the Developing Rat Brain. University of California Press, Berkeley
Georgieff MK, Schmidt RL, Radmer WJ, Mills MM, Widness JA 1992 Tissue iron status following fetal erythropoietin stimulation. Am J Physiol 262:R405–491.
Kreeftenberg HG, Koopman BJ, Huizenga JR, van Vilsteren T, Wolthers BG, Gips CH 1984 Measurement of iron in liver biopsies: a comparison of three analytical methods. Clin Chim Acta 144: 255–262.
Benkovic SA, Connor JR 1993 Ferritin, transferrin and iron in selected regions of the adult and aged rat brain. J Comp Neurol 338: 97–113.
Luna LG 1968 Vogt's method for nerve cell products. In: Luna LG (ed) Manual of Histologic Staining Methods of the Armed Forces Institute of Pathology, 3rd Ed. McGraw Hill Book Co, New York 212–213.
Georgieff MK, Mills MM, Gordon K, Wobken JD 1995 Reduced neonatal liver iron concentrations after uteroplacental insufficiency. J Pediatr 127: 308–311.
Rao R, de Ungria M, Sullivan D, Wu P, Wobken JD, Nelson CA, Georgieff MK 1999 Perinatal brain iron deficiency increases the vulnerability of rat hippocampus to hypoxic ischemic insult. J Nutr 129: 199–206.
Huebers HA 1989 Nonhematological manifestations of iron deficiency. In: Lonnerdal B (ed) Iron Metabolism in Infants. CRC Press, Boca Raton, 7–20.
Guiang SF III, Georgieff MK, Lambert DJ, Schmidt RL, Widness JA 1997 Intravenous iron supplementation effect on tissue iron and hemoproteins in chronically phlebotomized lambs. Am J Physiol 273:R2124–R2131.
Georgieff MK, Landon MB, Mills MM, Hedlund BE, Faassen AE, Schmidt RL, Ophoven JJ, Widness JA 1990 Abnormal iron distribution in infants of diabetic mothers: spectrum and maternal antecedents. J Pediatr 117: 455–461.
Guiang SF III, Merchant JL, Eaton MA, Fandel KB, Georgieff MK 1999 Intracardiac iron distribution in newborn guinea pigs following isolated and combined fetal hypoxemia and fetal iron deficiency. Can J Physiol Pharmacol 76: 930–936.
Roskams AJI, Connor JR 1994 Iron, transferrin, and ferritin in the rat brain during development and aging. J Neurochem 63: 709–716.
Hill JM, Switzer RC III 1984 The regional distribution and cellular localization of iron in the rat brain. Neuroscience 11: 595–603.
Morris CM, Candy JM, Bloxham CA, Edwardson JA 1992 Distribution of transferrin receptors in relation to cytochrome oxidase activity in the human spinal cord, lower brainstem and cerebellum. J Neurol Sci 111: 158–172.
Kandel ER 1991 Cellular mechanisms of learning and the biologic basis of individuality. In Kandel ER, Schwartz JH, Jessell TM (eds) Principles of Neural Science. Appleton & Lange, Norwalk, CT, 1009–1031.
Zola-Morgan S, Squire LR, Amaral DG 1986 Human amnesia and the medial temporal region: enduring memory impairment following a bilateral lesion limited to field CA1 of the hippocampus. J Neurosci 6: 2950–2967.
Bliss TVP, Lomo T 1973 Long lasting potentiation of synaptic transmission in the dentate area of the anaesthetized rabbit following stimulation of the perforant part. J Physiol 232: 331–356.
Ben-Ari Y 1992 Effects of anoxia and aglycemia on the adult and immature hippocampus. Biol Neonate 62: 225–230.
Walsh TJ, Emerich DF 1988 The hippocampus as a common target of neurotoxic agents. Toxicology 49: 137–140.
Felt BT, Lozoff B 1996 Brain iron and behavior of rats are not normalized by treatment of iron deficiency anemia during early development. J Nutr 126: 693–701.
Acknowledgements
The authors thank Ginny Lyson for editorial expertise, and Kimberly Smith, Quoc-Hong Tran, and Jennifer Welle for laboratory assistance.
Author information
Authors and Affiliations
Additional information
Supported in part by a grant from the National Institutes of Health (NICHD—HD 29421–05).
Rights and permissions
About this article
Cite this article
de Ungria, M., Rao, R., Wobken, J. et al. Perinatal Iron Deficiency Decreases Cytochrome c Oxidase (CytOx) Activity in Selected Regions of Neonatal Rat Brain. Pediatr Res 48, 169–176 (2000). https://doi.org/10.1203/00006450-200008000-00009
Received:
Accepted:
Issue Date:
DOI: https://doi.org/10.1203/00006450-200008000-00009
This article is cited by
-
Effects of Dietary Supplementation with Iron in Breeding Pigeons on the Blood Iron Status, Tissue Iron Content, and Full Expression of Iron-Containing Enzymes of Squabs
Biological Trace Element Research (2023)
-
Iron transport across the human placenta is regulated by hepcidin
Pediatric Research (2022)
-
Maternal anemia type during pregnancy is associated with anemia risk among offspring during infancy
Pediatric Research (2019)
-
Lower Serum Iron and Hemoglobin Levels are Associated with Acute Seizures in Patients with Ruptured Cerebral Aneurysms
Neurocritical Care (2019)
-
Reticulocyte hemoglobin content as an early predictive biomarker of brain iron deficiency
Pediatric Research (2018)

