


Abstract
Calcium receptor proteins are an essential link between hormones that alter intracellular calcium levels and the generation of cellular responses. However, there is no information available regarding the role of calcium receptor proteins, in particular the S100 family, in insulin action and/or diabetes. This study examines the effects of streptozotocin-induced type I diabetes on the expression of the individual S100A1 and S100B isoforms as well as their binding proteins. Diabetes did not increase (or initiate) S100B expression in any non-S100B-expressing tissue (skeletal muscle, heart, kidney, liver, spleen, and pancreas). In all S100B-expressing tissues examined (brain, white fat, and testes), S100B protein levels increased approximately 2-fold while steady state S100B messenger RNA (mRNA) levels decreased. S100A1-expressing tissues exhibited increased (kidney and lung), decreased (skeletal muscle), and unchanged (brain and heart) S100A1 protein levels. While noncoordinate changes in S100A1 protein and steady state mRNA levels were observed in heart, other S100A1-expressing tissues (brain, slow twitch skeletal muscle, and kidney) exhibited coordinate changes in S100A1 protein and steady state mRNA levels. Altogether, these results suggest that the effects of diabetes on S100 expression are isoform as well as tissue-specific. Gel overlay analysis of the S100-binding protein profile revealed both increases and decreases in binding proteins in all tissues examined. In summary, changes in the expression of S100A1, S100B, and S100-binding proteins occur in type I diabetes and represent important molecular events in the effects of insulin/insulin insufficiency on cell function.
TYPE I diabetes is characterized by a complete lack of insulin. Even with hormone replacement therapy, patients with type I diabetes suffer from a number of sequela including hypertension, macrovascular and microvascular disease, cataracts, cardiomyopathy, neuropathy, and premature aging (reviewed in Ref.1). Abnormal calcium metabolism is a common defect in both experimentally induced type I diabetes as well as in patients with type I diabetes (1). Furthermore, defective intracellular calcium metabolism has been detected in all type I and type II diabetic tissues examined, suggesting that it is a fundamental disorder of the diabetic state. How these changes in calcium metabolism are transduced into cellular dysfunction is an important issue that has not been resolved. Since the calmodulin/troponin C/S100 superfamily of calcium receptor proteins is responsible for transducing changes in intracellular calcium levels into cellular responses and linking calcium homeostasis to cell function, they will play a key role in this process. In fact, changes in the calcium sensitivity of the troponin complex have been directly linked to altered contractility in the type I diabetic heart (2). Calmodulin has been directly linked to insulin secretion in the pancreas (3–5) as well as effects on insulin target tissues including liver, heart, adipose tissue, kidney, and skeletal muscle (6–10). The contribution of increased calmodulin expression to the diabetic phenotype has not been determined.
Despite their importance in linking calcium homeostasis and cell function, very little information is available regarding the effects of diabetes on the function of the S100 family of calcium receptor proteins. The name S100 was derived from the observation that the two original members of this family, S100α and S100β (reviewed in Ref.11), are soluble in 100% ammonium sulfate. A new nomenclature, which reflects the genomic organization of the family members, has been recently adopted and is used throughout this report; S100α is now designated S100A1, and S100β is now designated S100B. Each S100A1 and S100B subunit contains two EF-hand calcium-binding domains. Like calmodulin and troponin C, binding of calcium to S100A1/S100B results in conformational change that exposes a hydrophobic patch. Calcium-modulated proteins possess no known enzymatic activity and function by interaction with other proteins, termed target proteins, via this hydrophobic patch. Unlike calmodulin, S100 proteins are a diverse family with 17 current members and at least three additional members to be reported (Heizmann, C. W., personal communication). In addition, expression of each member of the family is restricted to a unique set of cell types. For example, S100A1 is expressed in neurons, renal tubule cells, slow-twitch skeletal muscle fibers, and cardiomyocytes. These characteristics make S100 proteins ideal candidates for providing cell-type specificity to calcium signal transduction. Alterations in the expression of S100 proteins have been documented in numerous disease states including cardiomyopathy (12), Alzheimer’s disease, cancer, and diabetes (reviewed in Ref.11).
Previous studies on S100 expression in diabetes were limited to one tissue (13), white fat, even though S100 proteins are expressed in many other cell types (reviewed in Ref.11). In addition, these previous studies did not determine which S100 isoform(s) were altered by type I diabetes. As a first step in determining the molecular events that link S100 calcium receptor proteins to type I diabetes and abnormal cell function, we have quantitated the effects of streptozotocin-induced diabetes on S100A1 and S100B expression in nine different tissues. Included in the study were tissues associated with insulin synthesis and action (pancreas, heart, skeletal muscle, liver, and fat) as well as tissues that have been reported to express S100A1 and/or S100B. Quantitative Northern dot blots demonstrated that S100B steady state messenger RNA (mRNA) levels are coordinately down-regulated in diabetic tissues while S100A1 mRNA levels are up-regulated, down-regulated, or unchanged, depending on the tissue. Furthermore, S100A1 and S100B steady state mRNA levels and protein levels are not necessarily coordinately regulated. Altogether, these results demonstrate that the effects of type I diabetes on S100A1 and S100B expression are tissue-specific and involve transcriptional/posttranscriptional as well as translational/posttranslational mechanisms. In addition, changes in the complement and level of the target proteins/enzymes regulated by S100 proteins also occur in diabetic tissues. Thus, type I diabetes alters S100A1/S100B function at three levels: activation of S100-regulated processes by increased intracellular calcium; activation or inhibition of S100-regulated processes by increasing or decreasing S100 expression; and/or activation or inhibition of S100-regulated process by increasing or decreasing the expression of S100 target proteins.
Materials and Methods
Induction of type I diabetes
Type I diabetes was induced in Sprague-Dawley rats (Charles River Laboratories, Wilmington, MA) as previously described (14). After 4–6 weeks, only those animals with a blood glucose greater than 400 mg/dl were designated diabetic. Tissues were removed from anesthetized animals, quick frozen, and stored at −80 C. All animal studies were approved by the Committee on Animal Care Use of the University of South Alabama and conducted in accordance with the NIH Guidelines for the Care and Use of Animals.
Quantification of S100A1 and S100B steady state mRNA levels
Total RNA was isolated from frozen tissue (brain, fast-twitch skeletal muscle (vastus lateralis), slow-twitch skeletal muscle (soleus), heart, kidney, liver, spleen, white fat, and pancreas) using RNA STAT-60 (TEL-TEST “B” Inc., Friendswood, TX) and the protocol provided by the supplier. After resuspension in water, the RNAs were extracted with phenol, ethanol precipitated, resuspended in water, and quantitated by absorbance readings at 260 and 280 nm. After denaturation in glyoxal, total RNA samples were size-fractionated on 1.2% agarose gels containing 10 mm NaH2PO4, pH 7.0 (15). The RNAs were transferred to Gene Screen Hybridization Membranes (New England Nuclear, Boston, MA) and immobilized by UV cross-linking; the glyoxylation reaction was reversed by boiling in 10 mm Tris-base. Probes for Northern blots were prepared by PCR amplification using Taq DNA polymerase (Promega, Madison, WI) with buffer and nucleotide conditions recommended by the supplier. PCR consisted of 30 cycles of denaturation at 94 C for 1 min, annealing at 55 C for 1 min, and extension at 75 C for 3 min. The S100A1 primers [5′-GACCCTCATCAATGT-3′ (Operon Technologies, Inc., Almeda, CA) and 5′-CTGTTCTCCCAGAAGAAGTT-3′ (DNAgency, Aston, PA)] produced a 252-bp fragment whose sequence corresponds to nucleotides 85–337 of the rat S100A1 cDNA (16). The S100B primers [5′-GATGTGTTCCATCAGTACTCT-3′ (Operon Technologies) and 5′-CTCATGTTCAAAGAACTCAT-3′ (DNAgency)] produced a 239-bp fragment whose sequence corresponds to nucleotides 37–276 of the rat S100B cDNA (17). For quantitative dot blots, samples were denatured in glyoxal, diluted in 10× SSC (1× SSC = 0.15 m NaCl, 0.015 m sodium citrate) and applied to Gene Screen Hybridization Membranes using a BRL Hybri-Dot Apparatus (BRL, Gaithersburg, MD). After 30 min, the samples were drawn through the membrane with vacuum and each well was washed two times with 10× SSC. The membranes were then UV cross-linked and boiled, and duplicate blots were probed for S100A1 or S100B mRNA as described above. After multiple exposures of each filter were obtained, the probe was removed by boiling, and the filters were rehybridized with a mouse 18S ribosomal cDNA probe (American Type Culture Collection, Rockville, MD). The ribosomal oligonucleotide primers (5′-TCTAGAGCTAATACATGCCGACG-3′ and 5′-GGACTCATTCCAATTACAGGGCC-3i (Operon Technologies) produced a 420-bp fragment containing 5′-sequences of the 18S mRNA (18). All blots were scanned using a GS-250 Molecular Imager (Bio-Rad Laboratories, Hercules, CA), and the peak area of each dot was determined with Phosphor-Analyst software (Bio-Rad Laboratories). The relative S100A1/S100B mRNA level was calculated as the ratio of S100A1/B probe bound/ribosomal probe bound. This ensured that the quantity of total RNA bound to the membrane did not affect the quantification. Data were expressed as the mean ± se of a minimum of three different RNA preparations from tissues obtained from different animals. For populations that exhibited equal sd values, a t test was used to determine the statistical significance of differences between S100A1/B mRNA levels in control and diabetic tissues (Graph Pad Instat, Graph-Pad Software, San Diego, CA). For populations that had unequal sd values (S100B in brain; S100A1 in fast-twitch, kidney, and heart) the nonparametric Mann-Whitney U test was used (Graph Pad Instat) to determine statistical significance.
Quantification of S100A1 and S100B protein levels
Competition RIAs were used to quantitate S100A1 and S100B protein levels (19). Soluble extracts of control and diabetic brain, skeletal muscle, heart, kidney, liver, testes, and lung were prepared by homogenization in 50 mm Tris-HCl, pH 7.5, 1 mm EGTA, 1 mm β-mercaptoethanol and centrifugation at 10,000 × g for 1 h. Our previous studies on S100 protein levels in tissues and cell lines have demonstrated that the greatest variability in the RIA arises from animal to animal variation (20, 21). Therefore, all extracts were prepared from tissues obtained from a minimum of three different animals. For each extract, duplicate competition curves generated using serial dilutions that ranged from neat to 1:300 were assayed. For each sample that exhibited a competition curve, the amount of S100A1 or S100B in nanograms was extrapolated from the midpoint of the linear range of the S100A1 or S100B competition curve, respectively. The variability in duplicate competition curves for these samples was less than 15% and is similar to that reported previously (19–21). Only differences that were 200% or larger were considered significant.
Detection of S100A1 and S100B target proteins
Normal and diabetic brain, fast-twitch skeletal muscle, slow-twitch skeletal muscle, heart, kidney, liver, spleen, white fat, and pancreas were homogenized in 50 mm Tris-base, pH 7.5, 1 mm EDTA, 1 mm β-mercaptoethanol. Particulate (pellet) and soluble (supernatant) fractions were obtained by centrifugation at 10,000 × g. After fractionation on duplicate 12.5% polyacrylamide-SDS gels, S100A1 and S100B binding proteins were visualized using a gel overlay procedure (21).
Results
S100 expression in the diabetic brain
Since the brain expresses high levels of both S100A1 and S100B, it was chosen as the first tissue for analysis of S100 expression in type I diabetes. As shown in Fig. 1, total RNA isolated from normal brain expressed a single S100A1 mRNA species 500 bp in size (panel A) and a single S100B mRNA species 1500 bp in size (panel B). The fact that these mRNAs were identical in size to those previously reported (16, 22) confirm that the probes and hybridization conditions used in this particular study are appropriate. Total RNA from diabetic brain also contained a single S100A1 and a single S100B-hybridizing RNA, which were identical in size to the respective RNAs in normal brain. These results demonstrate that diabetic tissues express the same S100A1 and S100B mRNAs as normal tissues. However, the hybridization signals for both S100A1 and S100B mRNAs were decreased in total RNA isolated from diabetic brain when compared with total RNA isolated from control brain. Quantitative Northern dot blots were used to determine whether S100A1 and/or S100B mRNA levels were decreased in the brain in response to type 1 diabetes/insulin insufficiency. As shown in Fig. 2, S100A1 steady state mRNA levels decreased approximately 50% in diabetic brain when compared with normal brain (P < 0.05). S100B steady state mRNA levels also decreased, but only by approximately 25% (P < 0.05). These data confirm that diabetes results in decreased S100A1 and S100B steady state mRNA levels in the brain.
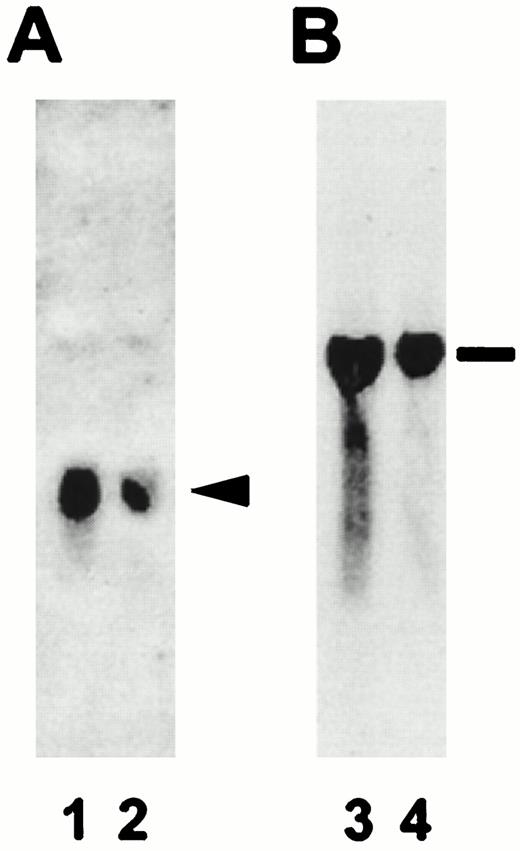
Specificity of S100A1 and S100B PCR-labeled probes. The resulting autoradiographs obtained after incubation of duplicate Northern blots in 32P-labeled S100A1 (panel A) or S100B (panel B) probes are shown. Lanes 1 and 3 contain total RNA isolated from control brain tissue, and lanes 2 and 4 contain total RNA isolated from diabetic brain tissue. The arrowhead denotes the 500-bp S100A1 mRNA and the line indicates the 1500-bp S100B mRNA.
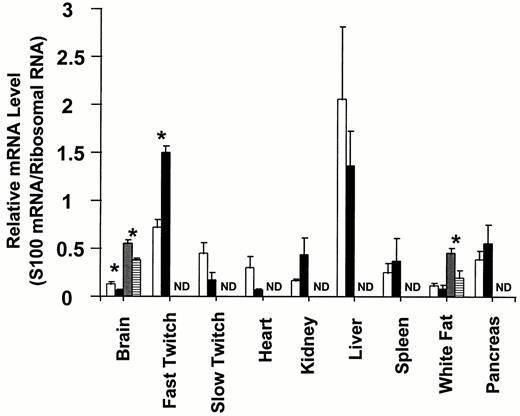
S100A1 and S100B steady state mRNA levels in various tissues from normal and type I diabetic rats. Steady state S100A1 and S100B mRNA levels were determined by quantitative Northern dot blot analysis as described in Materials and Methods. The data are expressed as the mean S100 mRNA/ribosomal RNA ± the se of three independent determinations. The S100A1 mRNA levels for control and type I diabetic tissues are shown in the open and black bars, respectively. S100B mRNA levels in control and diabetic tissues are shown in the dotted and horizontally hatched bars, respectively. Asterisks denote P < 0.05, and ND denotes no detectable mRNA.
Previous studies on S100 expression have concluded that the mechanisms that regulate S100 protein and mRNA levels are complex and that there is not always a direct correlation between protein and mRNA levels (16). Therefore, RIAs were used to quantitate S100A1 and S100B protein levels in normal and diabetic brains. As shown in Fig. 3, S100A1 protein levels were approximately the same in normal and diabetic brain. These data suggest that translational/posttranslational mechanisms allow S100A1 protein levels to remain unchanged in diabetic brain despite a 50% reduction in S100A1 steady state mRNA levels. In contrast, S100B protein levels were approximately 100% higher in the diabetic brain. These data suggest that translational/posttranslational mechanisms allow S100B protein levels to increase in diabetic brain despite a 25% reduction in S100B steady state mRNA levels. Since previous studies have demonstrated that the mechanisms that regulate S100 mRNA and protein levels are tissue-specific (16), conclusions regarding the effects of type I diabetes on S100 expression in other tissues cannot be extrapolated from studies on diabetic brain.
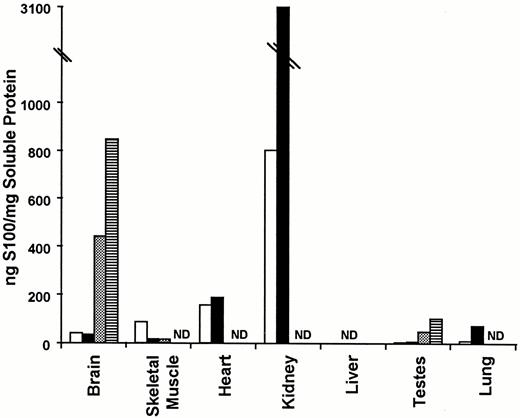
S100A1 and S100B protein levels in various tissues from normal and type I diabetic rats. S100A1 and S100B protein levels were determined by RIA as described in Materials and Methods. The data are expressed as the mean nanograms of S100/mg soluble protein ± the se of two determinations. The open and black bars represent S100A1 protein levels in normal and type I diabetic tissues, respectively. The dotted and horizontally hatched bars represent S100B levels in control and type I diabetic tissues, respectively. ND denotes no detectable protein.
S100B expression in other diabetic tissues
To determine whether S100B expression is coordinately regulated in different tissues in response to type I diabetes/insulin insufficiency, S100B steady state mRNA and protein levels were determined by quantitative Northern dot blots and RIA, respectively. Included in the Northern analyses were tissues that synthesize insulin (pancreas), insulin target tissues (skeletal muscle, heart, kidney, and liver), tissues that express S100B (white fat), and tissues that have been reported to have undetectable levels of S100B (skeletal muscle, heart, kidney, liver, spleen and pancreas) (16). Only two tissues, brain and white fat, expressed S100B mRNA (Fig. 2). This is in agreement with previous studies on S100B mRNA tissue distribution in the rat using random prime-labeled probes (14). Furthermore, in the diabetic animal, S100B expression was detected only in tissues that expressed S100B in the control animals, i.e. brain and white fat. These results demonstrate that S100B expression is not up-regulated in nonexpressing tissues in response to type I diabetes/insulin deficiency. Like brain, diabetic white fat contained less S100B mRNA than control white fat. However, the 50% decrease in S100B mRNA in white fat (P < 0.05) was larger than the 25% decrease observed in brain. These results suggest that insulin insufficiency/type I diabetes down-regulates S100B steady state mRNA levels in all S100B-expressing tissues. Further experiments that include additional S100B-expressing tissues will have to be completed before the universality of S100B down-regulation in type I diabetes can be ascertained.
Next we wanted to know whether S100B protein levels were increased in other tissues, in addition to the brain, in response to type I diabetes. Therefore, S100B protein levels were measured by RIA in seven different tissues (brain, skeletal muscle, heart, kidney, liver, testes, and lung). First, like the mRNA studies, S100B protein distribution was consistent with previous tissue distribution studies (reviewed in Ref.16). Furthermore, only those tissues with detectable S100B protein in control animals contained S100B in diabetic animals. Once again, these data confirm that diabetes does not result in S100B expression in tissues that do not normally express S100B. Second, for control tissues that expressed detectable S100B protein (brain and testes), S100B protein levels were 100% higher in diabetic tissues, which is significantly greater than the 15% variability in the assay. These results suggest that S100B protein levels are up-regulated in all S100B-expressing tissues in response to diabetes. The universality of this conclusion cannot be determined without data from additional S100B-expressing tissues. Nonetheless, the down-regulation of S100B steady state mRNA levels and concomitant up-regulation of S100B protein levels in response to type I diabetes occurs in multiple tissues.
S100A1 expression in other diabetic tissues
Unlike S100B, whose expression is limited to only a few cell types, S100A1 is expressed in a large number of tissues (16). To determine whether S100A1 and S100B expression is coordinately regulated by type I diabetes, quantitative Northern dot blots were used to measure steady state S100A1 mRNA levels in control and diabetic tissues. The same tissues that were used for quantitating S100B mRNA levels were used to quantitate S100A1 mRNA levels: insulin-synthesizing tissues (pancreas), insulin target tissues (skeletal muscle, heart, kidney, and liver), and tissues that express S100A1 (white fat, skeletal muscle, heart, kidney, liver, and spleen)(16). All nine tissues examined contained detectable levels of S100A1 mRNA. All of these tissues have been previously reported to express S100A1 mRNA (16). Interestingly, some diabetic tissues exhibited statistically significant (P < 0.05) increases in S100A1 mRNA levels (fast-twitch skeletal muscle); others exhibited statistically significant (P < 0.05) decreases in S100A1 mRNA levels (brain); and still others exhibited no significant change in S100A1 mRNA levels (spleen, liver, white fat, and pancreas). Although the S100A1 mRNA levels in heart and slow-twitch skeletal muscle fibers decreased, these differences were not quite significant. Thus, unlike S100B mRNA levels, which are coordinately down-regulated in all diabetic tissues examined, the effects of type I diabetes/insulin insufficiency on S100A1 steady state mRNA levels are tissue-specific.
The next question to be examined was whether S100A1 protein levels were coordinately regulated in different tissues in response to type I diabetes. S100A1 protein levels were measured by RIA in the same tissues used to quantitate S100B protein expression (brain, skeletal muscle, heart, kidney, liver, testes, and lung). First, S100A1 protein was detected in brain, skeletal muscle, heart, kidney, testes, and lung. All of these tissues have been reported previously to express S100A1 (reviewed in Ref.16). In contrast to previous studies on S100A1 protein distribution that have reported S100A1 protein in liver (reviewed in Ref.16), we detected no S100A1 protein in this organ. Since these studies have used the same antibodies and RIA techniques, it is unlikely that these differences are technological. It is more likely that animal variability and/or nutritional status are responsible. It will be important in future studies to clarify the expression of S100A1 protein in the liver. Interestingly, S100A1 protein levels in the diabetic kidney were 400% higher than control kidney and in the diabetic lung they were 800% higher than control lung. In diabetic skeletal muscle S100A1 protein levels were 20% of control. These changes were significantly greater than the 10% variability in the RIA. In the remaining tissues (brain, heart, and testes) differences in S100A1 protein levels in normal and diabetic tissues were not significant and could be accounted for by variability in the RIA. Altogether, these data suggest that changes in S100A1 protein expression in response to type I diabetes/insulin insufficiency are tissue-specific.
When S100A1 RNA and protein levels were compared, each tissue exhibited a different response. In the kidney, S100A1 protein and mRNA levels coordinately increased. In the brain and heart, S100A1 protein levels were unchanged, despite a statistically significant reduction in S100A1 steady state mRNA levels in both tissues. In contrast, S100A1 protein levels in skeletal muscles either increased (fast-twitch fibers) or remained unchanged (slow-twitch fibers) despite a significant reduction in S100A1 protein in skeletal muscle. Thus, the mechanisms that regulate these changes are complex and involve transcriptional/posttranscriptional as well as translational/posttranslational mechanisms. Regardless of mechanism, these results clearly demonstrate that changes in S100A1 expression do occur in response to type I diabetes.
S100-binding proteins in diabetes
Changes in the expression of calcium receptor proteins is only one way in which the function of these proteins can be altered. Alterations in their subcellular distribution and the complement of target proteins that they regulate can also have a significant impact on their function (11, 23). Therefore, a gel overlay procedure was used to examine the complement of S100- binding proteins in normal and diabetic tissues. The gel overlay procedure is a qualitative technique that allows rapid screening and detection of binding proteins in crude extracts (19–21, 24, 25). As in previous studies (21), the S100A1 and S100B-binding protein profiles were indistinguishable, and each tissue possessed a unique complement of S100-binding proteins. When the S100- binding protein profiles of normal and diabetic liver, white fat, spleen, fast-twitch skeletal muscle, slow-twitch skeletal muscle, heart, brain, and kidney were compared, the overall complement of binding proteins, as well as intensity of individual binding proteins in liver, white fat, and spleen, was indistinguishable (data not shown). In heart, kidney, and brain, the complement of binding proteins did not change; however, the levels of some binding proteins did change (Fig. 4). For example, binding proteins with apparent mol wts of 27,000 and 16,000 decreased in intensity in diabetic brain. Interestingly, a binding protein with an apparent mol wt of 30,000 decreased in intensity in diabetic heart, kidney, and slow-twitch skeletal muscle fibers and increased in diabetic fast-twitch skeletal muscle fibers. It will be interesting to determine whether this binding protein is the same in all of these tissues.
![S100-binding proteins in tissues from normal and type I diabetic rats. S100A1 and S100B-binding proteins were detected using the gel overlay technique described in Materials and Methods. The odd numbered lanes contain tissue homogenates from control animals (lanes 1, 3, 5, 7, 9, 11, 13, and 15), and the even numbered lanes contain tissue homogenates from diabetic animals (lanes 2, 4, 6, 8, 10, 12, 14, and 16). All samples are supernatant fractions with the exception of kidney, which is a pellet fraction. The left-hand portion of each box contains Coomassie Blue-stained gel profiles (lanes 1, 2, 5, 6, 9, 10, 13, and 14), and the right-hand portion contains the resulting autographs obtained after incubating gels in[ 125I]S100A1 (panel A) or [125I]S100B (panel B) in the presence of 1 mm CaCl2. Mol wt markers are shown (× 10−3) on the left.](https://oup.silverchair-cdn.com/oup/backfile/Content_public/Journal/endo/138/12/10.1210_endo.138.12.5579/2/m_ee1275579004.jpeg?Expires=1716353808&Signature=owum0MpRdDSDbyu4TmokHc45-bqGGDg0F4IuoTt0pni7~gZmOZIL9iKPZG2QNejtXbXwa8CRd1cb1PpIU2IjAPH3LL-eb8vhJLqQ8N4aJS0PrIqa1kuQNQbZeXnyEO6ToH0JswferYarvUc05IuNkinzOAP0utdNm8yPGgnyixO~ml4o8m3gCebt6Vxzl58mCZgFGHVG3mbKWra917yB6BHnKb346BH1JlDuUEQhhh406WxQs4VC4zTnqi7p2fsV-J58n0~UYpyDYaPWHDWNpV~xdMKIApL5LL7M1NmAIB7lmryZPJn7aQZJog-6K5g9Zcgcb3DceIU2FrBjSYsVcQ__&Key-Pair-Id=APKAIE5G5CRDK6RD3PGA)
S100-binding proteins in tissues from normal and type I diabetic rats. S100A1 and S100B-binding proteins were detected using the gel overlay technique described in Materials and Methods. The odd numbered lanes contain tissue homogenates from control animals (lanes 1, 3, 5, 7, 9, 11, 13, and 15), and the even numbered lanes contain tissue homogenates from diabetic animals (lanes 2, 4, 6, 8, 10, 12, 14, and 16). All samples are supernatant fractions with the exception of kidney, which is a pellet fraction. The left-hand portion of each box contains Coomassie Blue-stained gel profiles (lanes 1, 2, 5, 6, 9, 10, 13, and 14), and the right-hand portion contains the resulting autographs obtained after incubating gels in[ 125I]S100A1 (panel A) or [125I]S100B (panel B) in the presence of 1 mm CaCl2. Mol wt markers are shown (× 10−3) on the left.
The most dramatic differences were observed in fast-twitch and slow-twitch skeletal muscle fibers (Fig. 4); both of these tissues exhibited major changes in the complement of binding proteins expressed. While the Coomassie Blue-stained gel profiles for fractions prepared from normal and diabetic tissues were indistinguishable for all tissues including the pellet fractions from skeletal muscles, the supernatant fractions prepared from fast- and slow-twitch skeletal muscle fibers were significantly different (Fig. 4). In fact, the normal slow-twitch fiber Coomassie Blue-stained gel profile (Fig. 4, lane 5) was almost identical to the diabetic fast-twitch fiber Coomassie Blue-stained gel profile (Fig. 4, lane 10). The normal fast-twitch fiber Coomassie Blue-stained gel profile (Fig. 4, lane 9) was indistinguishable from the diabetic slow-twitch fiber Coomassie Blue-stained gel profile (Fig. 4, lane 6). In four different animals the conversion of slow- to fast-twitch fibers with type I diabetes occurred in all four animals, while the conversion of fast-twitch fibers to slow-twitch fibers with type I diabetes occurred in three of the four animals. While this is not the first report that type I diabetes differentially affects fast- and slow-twitch skeletal muscle fibers (26), it is the first study to suggest that type I diabetes may result in partial interconversion of skeletal muscle fiber types. In any case, our data support the conclusion that changes in the target proteins regulated by S100A1 and S100B occur in type I diabetes.
Discussion
Previous studies on S100 expression in type I diabetes did not determine which S100 isoform, S100A1 and/or S100B, was affected and were limited to one tissue type, white fat (13). This study examines the effects of streptozotocin-induced type I diabetes on the expression of the individual S100A1 and S100B isoforms as well as their binding proteins. Our results indicate that normal and diabetic tissues express the same S100A1 and S100B mRNAs as normal tissues. In addition, S100B protein and mRNA levels were coordinately regulated by type I diabetes. In all S100B-expressing tissues examined (brain, white fat, and testes), S100B protein levels increased approximately 2-fold while steady state S100B mRNA levels in brain and white fat decreased. This is in contrast to previous reports on S100 expression in white fat, which demonstrated a significant reduction in S100 protein in streptozotocin-induced diabetes (13). These discrepancies are most likely due to the fact that previous studies used animals that were acutely diabetic (4–7 days) while our study used animals that were chronically diabetic (4–6 weeks). Diabetes did not increase (or initiate) S100B expression in any non-S100B-expressing tissue (skeletal muscle, heart, kidney, liver, spleen, and pancreas). In contrast, the effects of type I diabetes on S100A1 expression were tissue-specific; various tissues exhibited increased (kidney and lung), decreased (skeletal muscle), and unchanged (brain and heart) S100A1 protein levels. While noncoordinate changes in S100A1 protein and steady state mRNA levels were observed in heart, skeletal muscle, and brain, the kidney exhibited coordinate increases in S100A1 protein and steady state mRNA levels. Altogether, these results demonstrate that the effects of diabetes on S100 expression are isoform as well as tissue-specific.
The alterations in S100A1 and S100B mRNA levels in response to type I diabetes suggest that these genes are regulated at the transcriptional/posttranscriptional levels by insulin. The presence of several cis-acting DNA sequences that have been implicated in transcriptional regulation of other genes by insulin in the S100A1 and S100B genes support the hypothesis that at least some of the changes in S100 mRNA levels documented in this study occur at the transcriptional level. Of the seven different insulin response elements reported (27–31), two, cgga (27) and tgttttg (29), are present in the S100A1 gene (32) and represent potential insulin-responsive S100A1 sequences. Three putative insulin response elements, tggttcttg (30), cgga (27), and tgttttg (29), are present in the S100B genes (33–35). AP-1 sequences (36), E-boxes (37), CarG or serum response elements (38), and cAMP response elements (CREs) (39) have also been implicated in insulin regulation of gene transcription. Thus, the four AP-1 elements, two E-boxes, and single CRE in the S100A1 gene (32) could be responsible for transcriptional regulation of the S100A1 in response to insulin/insulin insufficiency. Furthermore the two AP1 sites, two serum response elements, two E-boxes, and single CRE present in the S100B genes (33–35) could alter its expression at the transcriptional level in response to insulin.
Recent reports of posttranscriptional regulation of the S14 gene by insulin suggest that transcriptional effects may not be entirely responsible for altered S100A1 and/or S100B expression in diabetic tissues (40). Since the mechanism(s) by which insulin alters S14 gene processing has not been identified, it is not possible to speculate on the probability that a similar mechanism is involved in regulating S100A1 or S100B expression. However, an examination of other elements implicated in message stability demonstrates the presence of a MKEL amino acid sequence in the S100A1 molecule that is 50% identical and 100% similar in charge and hydrophobicity to the MREI sequence that participates in regulation of β-tubulin mRNA stability (41). In summary, the presence of elements that act at the transcriptional and posttranscriptional level to regulate gene expression in the S100A1 and S100B genes is consistent with our observations that the expression of these genes is regulated at the transcriptional/posttranscriptional levels in type I diabetes and that these effects are direct effects of insulin.
The noncoordinate regulation of S100B mRNA and protein levels in all diabetic tissues and S100A1 mRNA and protein levels in the diabetic heart demonstrate that translational/posttranslational mechanisms also participate in altered S100 expression in these tissues. These are the first gene products in which translational/posttranslational mechanisms have been implicated in regulation of gene expression by insulin/insulin insufficiency. It is also possible that translational/posttranslational mechanisms contribute to altered S100 expression in tissues that exhibit coordinate changes in S100 protein and mRNA levels. Because the S100 proteins are extremely stable, it is unlikely that changes in the protein half-life will significantly contribute to altered protein expression. The more likely hypothesis is that altered translational rates are responsible. Since the S100A1 and S100B contain no sequence previously implicated in translational control (41, 42), one cannot propose a mechanism for this regulation.
S100 proteins are calcium-modulated proteins and possess no known enzymatic activity. They function by interacting with and modulating the activity of other proteins termed target proteins. Thus, changes in the complement of S100 target proteins and/or the level of individual target proteins could also result in an alteration in S100-regulated processes in diseased tissues. Using a gel overlay technique, we observed both increases and decreases in S100-binding proteins in all tissues examined. Interestingly, the expression of a 30,000-kDa S100-binding protein significantly decreased in three S100A1- expressing tissues (kidney, heart, and skeletal muscle). Once this binding protein has been identified, it will be possible to determine whether it is the same protein in all three of these tissues. While numerous S100-binding proteins have been identified, primarily in brain and skeletal muscle, none have a mol wt of 30,000, making it impossible to speculate on the identity of this very interesting binding protein. It is essential that the other S100-binding proteins whose expression is altered by diabetes are also identified and the effects of S100 interaction with each binding protein documented to fully understand how insulin and calcium homeostasis are related. However, the lack of such information does not alter the conclusion that changes in S100-binding proteins occur in type I diabetes.
Interestingly, the Coomassie Blue-stained gel profiles for normal and diabetic tissues were indistinguishable for supernatant and pellet fractions with the exception of supernatant fractions from slow- and fast-twitch skeletal muscle fiber types. These data suggest that major changes in the complement of proteins expressed in various tissues do not occur in type I diabetes. Since the one-dimensional gels used in this study would not detect changes in minor protein constituents or changes in isozymes/isoforms, these results are not inconsistent with the numerous reports of insulin-responsive gene products. Furthermore, these studies confirm that identification of proteins/gene products whose expression is regulated by insulin require sensitive molecular techniques and/or prior identification of the protein in question. The exception would be supernatant fractions of slow- and fast-twitch skeletal muscles, which did exhibit major changes in protein complement on one-dimensional gels. In fact, our results suggest that there is an interconversion of fast- and slow-twitch skeletal muscle in type I diabetes. While changes in muscle strength (43) and multiple RNA species (44) have been reported to occur in specific skeletal muscle fiber types in response to type I diabetes, a differential effect of type I diabetes on slow- and fast-twitch fibers has been reported only for ouabain binding, contraction velocity, and relaxation (26). Further studies will be needed to determine whether the interconversion of skeletal muscle fiber types observed in this study are unique to the soleus and vastus lateralis and/or the rat.
In summary, this study demonstrates that changes in the expression of S100A1 and S100B and their binding proteins occur in type I diabetes. While previous studies have identified numerous proteins whose activity is regulated by S100 proteins in vitro (see Ref.11), which of these proteins are regulated in vivo by S100 proteins and the calcium dependency of these in vivo interactions are not known. Further studies on the in vivo function of S100A1 in normal cells will be required before it can be determined whether S100 protein are involved in the expression of the diabetic phenotype or part of the compensatory mechanisms that counter the diabetic state. What we do know is that the mechanisms involved will vary from tissue to tissue. Furthermore, these changes in S100 proteins, along with changes in the expression of other calcium-modulated proteins, such as troponin C and calmodulin, as well as the changes in intracellular calcium levels, will have to be included in any model explaining how type I diabetes/insulin insufficiency affects the function of particular cell types. Identification of the cis-acting DNA sequences, trans-acting factors, and amino acid sequences involved in regulating S100 expression in type I diabetes will significantly expand our knowledge regarding the molecular events involved in insulin action and suggest strategies for the normalization of these events in type I diabetes.
References
Author notes
These studies were supported by grants from the National Institutes of Health (NS-30660 to D.B.Z. and ES-03456 to G.L.W.), the American Heart Association (AL-G-940003 to W.E.Z.), and the National Science Foundation (BIO9200038 to D.B.Z.).
