

Abstract
Attention improves auditory performance in noisy environments by either enhancing the processing of task-relevant stimuli (“gain”), suppressing task-irrelevant information (“sharpening”), or both. In the present study, we investigated the effect of focused auditory attention on the population-level frequency tuning in human auditory cortex by means of magnetoencephalography. Using complex stimuli consisting of a test tone superimposed on different band-eliminated noises during active listening or distracted listening conditions, we observed that focused auditory attention caused not only gain, but also sharpening of frequency tuning in human auditory cortex as reflected by the N1m auditory evoked response. This combination of gain and sharpening in the auditory cortex may contribute to better auditory performance during focused auditory attention.
Introduction
The ability to encode specific sounds in noisy environments is important in daily life. In most day-to-day situations, we are exposed to many different types of sound signals simultaneously. Nevertheless, we can easily perceive selected sound signals simply by paying attention to them. The processing might be tuned by both enhancement of neural responses corresponding to task-relevant stimuli (gain) and suppression of task-irrelevant neural activities (sharpening). Despite extensive research, the tuning effects of attention in the human auditory cortex remain to be exactly determined (Alain and Arnott, 2000).
A functional magnetic resonance imaging (fMRI) study (Murray and Wojciulik, 2004) of the visual system showed that attention not only increased the activation (gain), but also enhanced the selectivity of the neural population representing an attended object. In a manner comparable with the visual system, auditory attention might cause an overall increase in auditory neural activity (gain) and also increase the resolution of the tonotopic map, contributing to finer neural population-level coding for attended sound signals (sharpening), as illustrated in Figure 1A. The gain functions of attention in the human auditory system have also been investigated using fMRI and other neuroimaging techniques (Grady et al., 1997; Benedict et al., 1998; Murray and Wojciulik, 2004). Previous electroencephalography (EEG) (Hillyard et al., 1973; Picton and Hillyard, 1974) and magnetoencephalography (MEG) (Woldorff et al., 1993) studies also observed that focused auditory attention increased the N1 auditory response, a component thought to originate in lateral aspects of Heschl's gyrus and the posterior temporal plane (Pantev et al., 1995; Eggermont and Ponton, 2002). A sharpening effect of attention, however, has not yet been shown in this area.
The effect of the efferent (top-down) neural system on frequency tuning has been studied at single-neuron level. Polley et al. (2006) investigated whether bottom-up sensory inputs or top-down task-dependent processes controlled cortical reorganization in adult rats. Between two groups of rats, the authors used identical auditory stimuli, but different attention tasks. The results showed that only top-down signals played an important role in the reorganization of primary and secondary auditory cortex and, thus, attention focused on frequency cues might also intensify efferent neural inputs and expand the representation of the target frequency range within the cortical tonotopic map.
Based on the aforementioned results, the major goal of the present study was to investigate gain as well as sharpening effects of focused auditory attention on the population-level frequency tuning in human auditory cortex by means of MEG. We posit that attention might strengthen not only excitatory neural connections, but also inhibitory networks (see Fig. 1A), which would contribute to finer frequency tuning and better auditory performance.
Materials and Methods
Subjects
Participants were 13 healthy subjects between 22 and 28 years of age (seven females; mean, 24.2 years) with no history of psychological or neurological disorders. All subjects were right handed (assessed with the Edinburgh Handedness Inventory) and their hearing thresholds were within norms for the frequency range of 250–8000 Hz, as tested by means of clinical pure tone audiometry. Participants gave written informed consent for participation in the study in accordance with procedures approved by the Ethics Commission of the Medical Faculty, University of Muenster.
MEG measurement
Experimental design and stimuli.
To evaluate gain and sharpening effects of attention, we presented a test stimulus (TS) either independently or simultaneously with four different band-eliminated noises (BENs) queued in a random sequence. Neuronal activities evoked by BEN and TS can be divided into three categories: activity evoked exclusively by BEN, activity evoked exclusively by TS, or activity evoked by both BEN and TS (Fig. 1B, light gray, dark gray, black areas, respectively). Activities of auditory neurons, which can be activated by both BEN and TS, decrease with BEN becoming wider and/or with frequency tuning becoming sharper. Thus, the diminution of overlapping areas (Fig. 1B, black areas) and the enlargement of areas activated solely by TS (Fig. 1B, dark gray areas) illustrate improved population-level frequency tuning. In this study, neurons in areas of overlap (Fig. 1B, black areas) could be activated by both BEN and TS, but in fact they were already activated by BEN when TS was presented (Fig. 2A). Thus, the N1m response measured in this study reflects the activity of the neural group activated solely by TS onset (Fig. 1B, dark gray areas). If the effect of attention were gain only, the ratios of TS-related neural activities evoked in the case of each BEN condition (Fig. 1B, dark gray areas) compared with no BEN (Fig. 1B, dark gray and black areas) would not differ between active versus distracted listening conditions. In contrast, if attention sharpened the population-level frequency tuning, the ratio would become larger in the active compared with the distracted listening condition. Thus, the combination BEN plus TS allows us to measure population-level frequency tuning of the alert human auditory cortex by means of MEG.

Attentional modulation of frequency tuning. A, The figure illustrates how different effects of attention [gain model vs sharpening model vs combined (gain plus sharpening) model] would modulate population-level neural activities corresponding to the 1000 Hz test stimulus. Gain is reflected by increased amplitudes, sharpening is reflected by narrow frequency distributions. B1–B4, The figures illustrate the relationship of neural activities elicited by BEN and TS as predicted by the different attention models. Light gray areas represent neural activities exclusively elicited by BEN, and dark gray areas represent neural activities exclusively elicited by TS. Black areas indicate overlap: neurons in these areas could be activated by both BEN and TS but in fact had already been activated by BEN when TS appeared. Dark gray areas represent N1m source strength reflecting TS onset. B1 displays neural activities evoked without focused auditory attention (i.e., broad frequency tuning and weak neural activities as indicated by rather wide frequency distributions and rather small amplitudes). B2 illustrates the gain model (i.e., broad frequency tuning and strong neural activities as indicated by rather wide frequency distributions and rather large amplitudes). B3 illustrates the sharpening model (i.e., sharp frequency tuning and weak neural activities as indicated by rather narrow frequency distributions and rather small amplitudes). B4 displays the combined (gain plus sharpening) model (i.e., sharp frequency tuning and strong neural activities as indicated by rather narrow frequency distributions and rather large amplitudes). Left diagrams illustrate BENs with broad spectral notch; right diagrams illustrate BENs with narrow spectral notch. Of note, the neural activities in both gain and combined models are enhanced because of the gain effect of attention. In addition, size ratios of dark gray areas between narrow BEN and wide BEN differ between models: for B3 and B4, ratios are much closer to 1 compared with B1 and B2, reflecting the sharpening effect of attention on population-level frequency tuning.
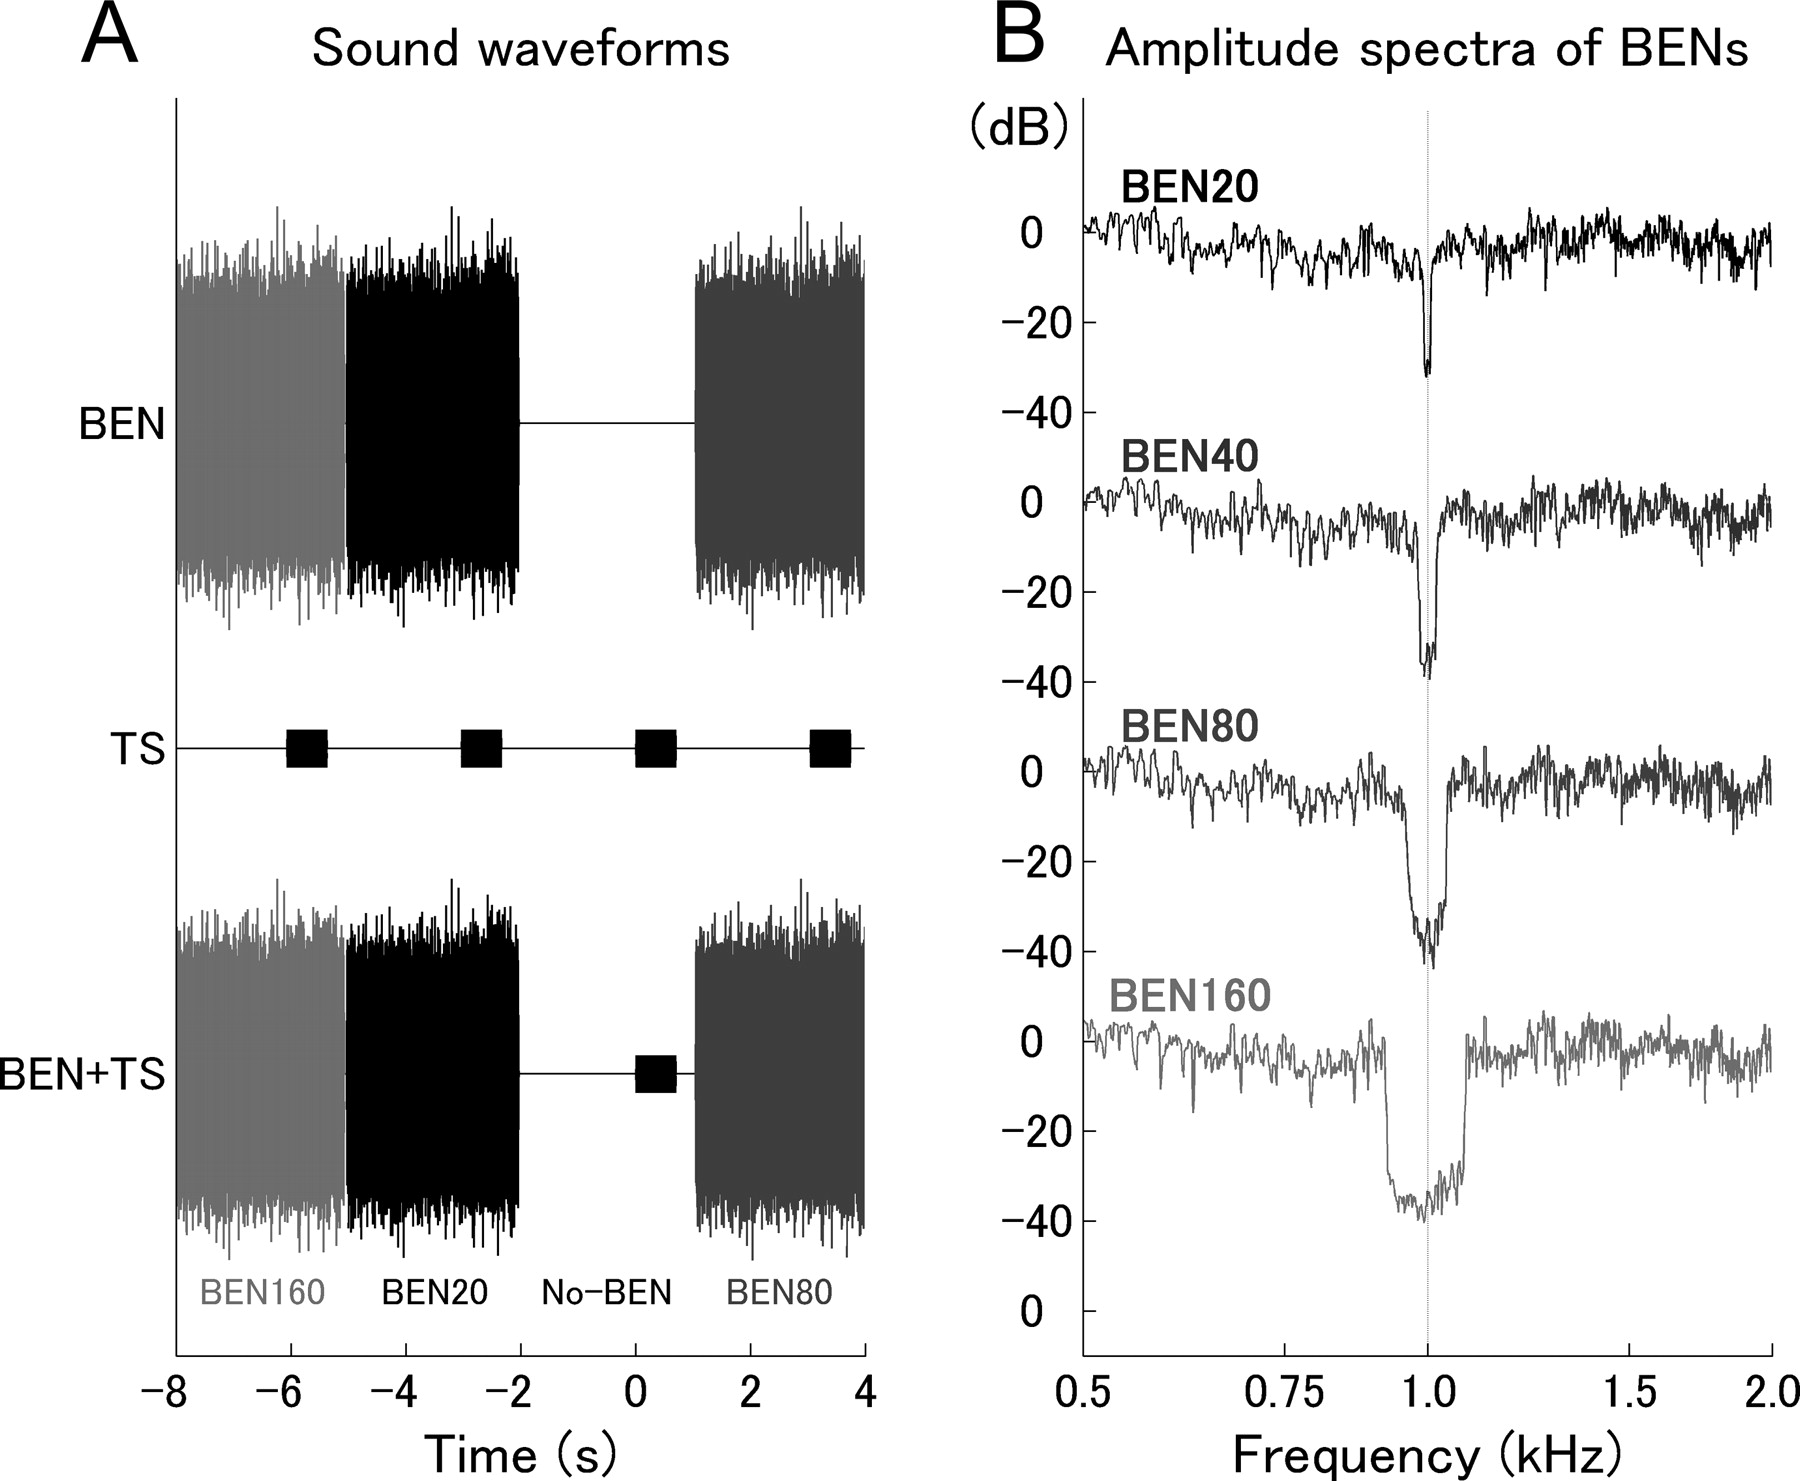
Experimental design. A, Schematic representation of the stimulation sequence. BENs of 3 s duration and the TS of 700 ms duration are displayed individually in the top and middle rows, respectively. The combined stimulation sequence (BEN+TS) is displayed in the bottom row. Note that the TS waveform is not clearly visible in the combined waveform in the bottom row because of its 15 dB lower amplitude compared with BEN power. B, Amplitude spectra of the 3 s BENs measured at the earpiece. The eliminated bandwidths are 20 Hz (BEN20), 40 Hz (BEN40), 80 Hz (BEN80), and 160 Hz (BEN160). The center frequency of the eliminated region was always 1000 Hz, which corresponded to the carrier frequency of the TS.
The TS was a 40 Hz 100% amplitude-modulated tone (12.5 ms rise and fall time) with a carrier frequency of 1000 Hz and a duration of 0.7 s. The sound onset asynchrony between two subsequent TS was 3.0 s. In 10% of the trials, the TS deviated in structure from the standard TS. In these “deviant” trials, the TS contained a silent period of 50 ms duration (“temporal gap,” 12.5 ms fall and rise time) starting randomly at 50, 100, 150, 200, 250, 300, 350, 400, 450, 500, 550, or 600 ms after TS onset. The deviant stimuli served to control for subject's compliance. Deviant stimuli could not be analyzed appropriately because of low signal-to-noise ratio as a result of few trials and contamination by artifacts, and were therefore excluded from additional analysis.
BENs were prepared as follows: spectral frequency bands with widths of either 20 Hz (BEN20), 40 Hz (BEN40), 80 Hz (BEN80), or 160 Hz (BEN160) centered around the 1000 Hz TS carrier frequency (Fig. 2B) were eliminated from 8000 Hz low-pass filtered white noise (corresponding to the upper frequency limit of the sound delivery system). All BENs (duration of 3.0 s with 12.5 ms rise and fall times) were presented starting 2.0 s before TS onset and ending 0.3 s after termination of TS (Fig. 2A). All sound stimuli were prepared as sound files and presented via Presentation (Neurobehavioral Systems, Albany, CA). Between BENs, there were silent intervals of 40 ms duration because of time delays produced by the sound presentation system. Frequency tags of 18000 Hz (which were not perceivable by the subject) were attached to the head of the TS to obtain precise timing of the sound stimulation. SRM-212 electrostatic earphones (Stax, Saitama, Japan) were used as transducers. Sounds were delivered through 60 cm silicon tubes with an inner diameter of 5 mm and terminating at silicon earpieces fitting to the subject's ears. The hearing threshold for the TS was determined for each individual and for each ear at the beginning of the MEG session. The TS was presented binaurally at an intensity of 35 dB above individual sensation level; corresponding sound pressure levels varied between 41 and 51 dB (mean ± SD, 47.7 ± 3.7). The power of all BENs, which were also presented binaurally, was 15 dB larger than TS power. In each session, 180 trials of the standard TS for each BEN condition were presented in randomized order.
To investigate the effects of attention, we contrasted two different attentional conditions per subject: active listening and distracted listening. During active listening, subjects were instructed to focus their attention on the auditory stimuli and were required to press a response button as quickly as possible with their left or right index finger (randomized between subjects) for each detection of deviant TS. During distracted listening, no task was required; subjects watched a silent movie of their choice. The movie served to distract attention from the auditory modality. We decided not to present the silent movie during active listening because, despite clear instructions, the movie might have distracted attention from the auditory stimuli which, in turn, might have resulted in less contrast in the evoked response between the two different attentional states (Suzuki et al., 2005). The sound stimulation was identical between the two sessions, which were performed on different days. Session order was balanced across subjects.
Data acquisition and analysis.
Auditory evoked fields (AEFs) were measured with a helmet-shaped 275-channel whole-head neurogradiometer (Omega; CTF Systems, Coquitlam, British Columbia, Canada) in a silent magnetically shielded room. Participants were comfortably seated upright. Head position was fixed with pads and subjects were instructed not to move. Alertness and compliance were verified via video monitoring. The measured magnetic response fields were digitally sampled at a rate of 600 Hz. Epochs of data elicited by standard TS, including a 300 ms pre-TS-onset interval and a 400 ms post-TS-onset interval, were averaged selectively for each BEN condition after rejection of artifact epochs containing field changes larger than three picotesla. The evoked field source locations and orientations were determined in a head-based Cartesian coordinate system with the origin at the midpoint of the mediolateral axis (y-axis), which joined the center points of the entrances to the ear canals (positive toward the left ear). The posterior–anterior axis (x-axis) ran between nasion and origin, the inferior–superior axis (z-axis) ran through the origin perpendicularly to the x–y plane.
The N1m response is known to be generated in a relatively focused cortical area (posterior temporal plane and lateral aspects of Heschl's gyrus) (Pantev et al., 1995; Eggermont and Ponton, 2002). We estimated N1m source locations and orientations by means of two single equivalent current dipoles (one for each hemisphere) based on the no-BEN condition using a spherical head model and assuming identical locations and orientations for the BEN conditions, because a previous MEG study (Sams and Salmelin, 1994) showed that simultaneously presented BENs did not influence the calculated locations and orientations of the N1m components elicited by the test tone. For analysis of the N1m component, the averaged magnetic field signals were 30 Hz low-pass filtered initially followed by a baseline correction relative to the 300 ms prestimulus interval. The cortical sources were approximated individually for each subject. Initially, the time point of maximal global field power, measured as the root-mean square across all sensors around 100 ms after stimulus onset, was identified. Afterward, the 10 ms time window before the peak was used for spatiotemporal source estimation. The estimated source for each hemisphere of each subject was fixed in its location and orientation, and the source strengths were calculated for all time points and each BEN condition (BEN160, BEN80, BEN40, and BEN20). The maximal N1m source strengths were calculated in time windows between 75 and 175 ms (no-BEN condition), 125 and 225 ms (BEN 160 condition), and 150 and 250 ms (BEN80, BEN40, and BEN20 conditions), respectively. The estimated N1m locations with respect to each axis were evaluated by repeated-measures ANOVAs using two factors (attention: active vs distracted; hemisphere: left vs right). In this article, the p values provided for repeated-measures ANOVA results are Greenhouse–Geisser corrected.
The 40 Hz amplitude modulated tone used as TS in this study is known to generate the so-called “auditory steady-state response” (Makela and Hari, 1987; Pantev et al., 1996; Engelien et al., 2000; Ross et al., 2000). However, it was not possible to clearly extract this response for the BEN conditions because of low signal-to-noise ratio and, thus, it was not possible to perform an auditory steady-state response analysis.
For the evaluation of the sharpening effect of attention on the population-level frequency tuning, the maximal source strength of the N1m elicited by the TS for each BEN condition in each hemisphere was normalized with respect to the maximal N1m source strength in the no-BEN condition for each subject and each hemisphere individually. Normalization was used to reduce the impact of the typically observed interindividual and intersession variability in N1m source strength. The normalization procedure was not applied to N1m latency given that the variability of latency among subjects was negligible compared with that of source strength. The normalized source strengths and latencies were then evaluated by repeated-measures ANOVA using three factors (BEN type: BEN160, BEN80, BEN40, and BEN20; hemisphere: left vs right; attention: active vs distracted). Post hoc comparisons were performed using Bonferroni–Dunn's multiple-comparisons correction (significance threshold, p < 0.0083). In addition, non-normalized maximal N1m source strength was similarly analyzed because the hypothesized “gain” effect of attention would get lost in normalized data.
Behavioral measurement
To evaluate the deviant detection performance of the subjects, we conducted additional behavioral measurements in a third session. These measurements took place in the MEG room and therefore stimulation devices, stimuli, and experimental parameters were identical to the “active” MEG session with the exception of likelihood of stimulus appearance: both standard and deviants appeared with a probability of 50%. Stimulus order was pseudorandomized; each deviant stimulus was presented eight times in each BEN condition, resulting in 96 standard and 96 deviant trials for each BEN condition. Participants were instructed to press a button with their right index finger as quickly as possible when detecting a deviant stimulus. Reaction time and error rate (misses plus false alarms) were recorded. Data were analyzed with repeated-measures ANOVA (BEN type: BEN160, BEN80, BEN40, and BEN20) and post hoc comparisons were performed using Bonferroni–Dunn's multiple-comparisons correction (significance threshold, p < 0.0083).
Theoretically, the possibility that participants have changed the amount of allocated attention based on BEN condition cannot completely be ruled out. In this study, subjects might have paid more attention to narrower BENs compared with wider BENs. Such strategic behavior might have been reflected by larger attentional effects for narrower compared with wider BENs. To rule out this possibility, just after the termination of the behavioral measurement, we investigated whether subjects were able to categorize the BENs with respect to task difficulty by asking the participants whether she/he had noticed that different BENs had been presented. Ten participants did not notice this at all, but three participants commented that BENs and task difficulties had differed. For these three participants, we extended the behavioral measurement to find out whether they could link BEN type to task difficulty. Participants were asked to rank BENs via button press [button 1 (easy) to button 4 (difficult)]. Each BEN was presented 15 times for 3 s in randomized order.
Results
MEG measurement
Clearly identifiable AEFs were obtained from all subjects in all conditions. After artifact rejection, a number of 156–180 (mean, 170) trials remained in each condition to be used for AEF averaging. Waveforms, contour maps, and estimated source localizations of the N1m elicited by no-BEN during active listening overlaid on the MRI of one representative subject are displayed in Figure 3(supplemental Fig. 1, movies 1, 2, available at www.jneurosci.org as supplemental material). Clear dipolar patterns over the right and left hemispheres were observed. The goodness-of-fit of the underlying dipolar model for dipole estimation was in a range of 91.8–98.2% (mean ± SD, 95.8 ± 1.78%), confirming the adequacy of the chosen equivalent current dipole approach. Figure 4 displays the group-averaged dipole locations of the N1m for the active and distracted listening conditions with the 95% confidence interval limits of the relative differences around the distracted listening condition.

Representative single-subject result. A, Auditory evoked magnetic fields obtained in the no-BEN condition. Thirty hertz low-pass-filtered MEG waveforms are displayed in a flattened sensor position projection. B, Isocontour maps of the magnetic fields corresponding to the maximal N1m response showing dipolar patterns above both hemispheres at a latency of 0.1067 s. Red areas represent inward flows of magnetic fields from the brain, whereas blue areas represent outward flows. C, Calculated dipole locations and orientations overlaid on an individual MRI.

Estimated source locations of N1m. Localization of the N1m sources in the y–x plane (medial–lateral vs posterior–anterior directions) and the y–z plane (medial–lateral vs inferior–superior directions). Filled symbols represent active listening; open symbols represent distracted listening. The ellipses around the open symbols denote the 95% confidence interval limits of the differences between active and distracted listening.
The repeated-measures ANOVA applied to the dipole source locations of the N1m response resulted in significant main effects for hemisphere in the posterior–anterior dimension (x-axis; F(1,12) = 5.8; p < 0.05), the mediolateral dimension (y-axis; F(1,12) = 6.3; p < 0.05), and the inferior–superior dimension (z-axis; F(1,12) = 20.5; p < 0.001). There was no significant interaction or main effect of attention. Hence, the estimated source locations of the neural activities measured differed slightly between hemispheres regardless of whether the subjects focused their attention on the stimuli or not. This asymmetric N1m location between hemispheres most likely reflects anatomical hemispheric differences (Rademacher et al., 2001). At first glance, no significant source location difference between active and distracted conditions seems to be inconsistent with previous fMRI results revealing significantly larger cortical activations during focused auditory attention (Grady et al., 1997; Benedict et al., 1998), until it is considered that the dipole fit approach only allows estimating the center of gravity of the neural responses and not the extent of activated areas. Thus, the extent of activated neural areas may have differed between the two sessions, but the centers of gravity of the neural responses were not significantly different.
The grand-averaged N1m cortical source waveforms across all subjects (time range, −300 to +400 ms) are displayed in Figure 5. This figure demonstrates a clear N1m response peaking at ∼100 ms after TS onset for the no-BEN condition. The N1m-responses in the BEN conditions are delayed and show smaller peaks compared with the no-BEN condition.

Grand-averaged source strength waveforms. The top graph displays grand-averaged (n = 13) source waveforms for the N1m for all BEN conditions during active listening. The bottom graph displays waveforms during distracted listening.
The averaged normalized N1m source strengths and the N1m latencies for the left and right hemispheres and each BEN condition with 95% confidence limit error bars are presented in Figure 6. The repeated-measures ANOVA applied to the normalized N1m source strengths resulted in significant main effects of BEN type (F(3,36) = 22.8; p < 0.0001), hemisphere (F(1,12) = 7.4; p = 0.019), and attention (F(1,12) = 19.4; p < 0.001) as well as a significant interaction between BEN type and attention (F(3,36) = 5.3; p = 0.014). Post hoc comparisons showed significant differences between BEN160 and BEN80 (p < 0.0003), BEN160 and BEN40 (p < 0.0001), BEN160 and BEN20 (p < 0.0001), and BEN80 and BEN20 (p < 0.003).

Normalized N1m source strengths and latencies. The graphs display the group means (n = 13) of the normalized N1m source strengths (top graphs) and latencies (bottom graphs) for each BEN condition with error bars denoting the 95% confidence intervals for the group means. Filled circles denote the responses during active listening, and open circles denote the responses during distracted listening.
Moreover, because there was no significant interaction of hemisphere with any factor, we collapsed data across hemispheres and calculated planed comparisons (paired two-tailed t tests; Bonferroni–Dunn-corrected significance threshold, p < 0.0127) between active and distracted attentional states on normalized N1m source strength within each BEN condition to directly compare active and distracted conditions. The results showed significant differences between BEN160-active and BEN160-distracted (p < 0.008), BEN80-active and BEN80-distracted (p < 0.0003), BEN40-active and BEN40-distracted (p < 0.0001) as well as between BEN20-active and BEN20-distracted (p < 0.0001). Furthermore, we compared estimated linear slopes of change for active and distracted conditions by means of paired t test. The results show that the slope for distracted was significantly steeper than the slope for active (t(12) = 2.84; p = 0.015).
Hence, statistical analyses of normalized N1m source strength indicated that attention as well as BEN type and hemisphere significantly influenced the strength of the neural activities measured. Crucially, effects of attention and BEN type were not independent from each other, but interacted: the effect of auditory focused attention increases with narrowing BEN.
The repeated-measures ANOVA applied to N1m latency revealed significant main effects of attention (F(1,12) = 8.1; p = 0.016) and BEN type (F(3,36) = 63.7; p < 0.0001), but no significant interaction between factors. Significant differences between BEN160 and all other BEN types (p < 0.0001) as well as between BEN80 and BEN20 (p < 0.0001) were found using post hoc comparisons. Hence, both attention and BEN type influenced the timing of the neural activities measured, whereas the timing did not differ between hemispheres. The repeated-measures ANOVA applied to the non-normalized maximal N1m source strengths resulted in significant main effects for attention (F(1,12) = 61.2; p < 0.0001) and BEN type (F(3,36) = 23.0; p < 0.0001). Thus, N1m source strength was significantly larger during active listening compared with distracted listening. Attention as well as BEN type influenced the strength of the neural activities measured. This gain effect caused by focused auditory attention did not differ between hemispheres.
Behavioral measurement
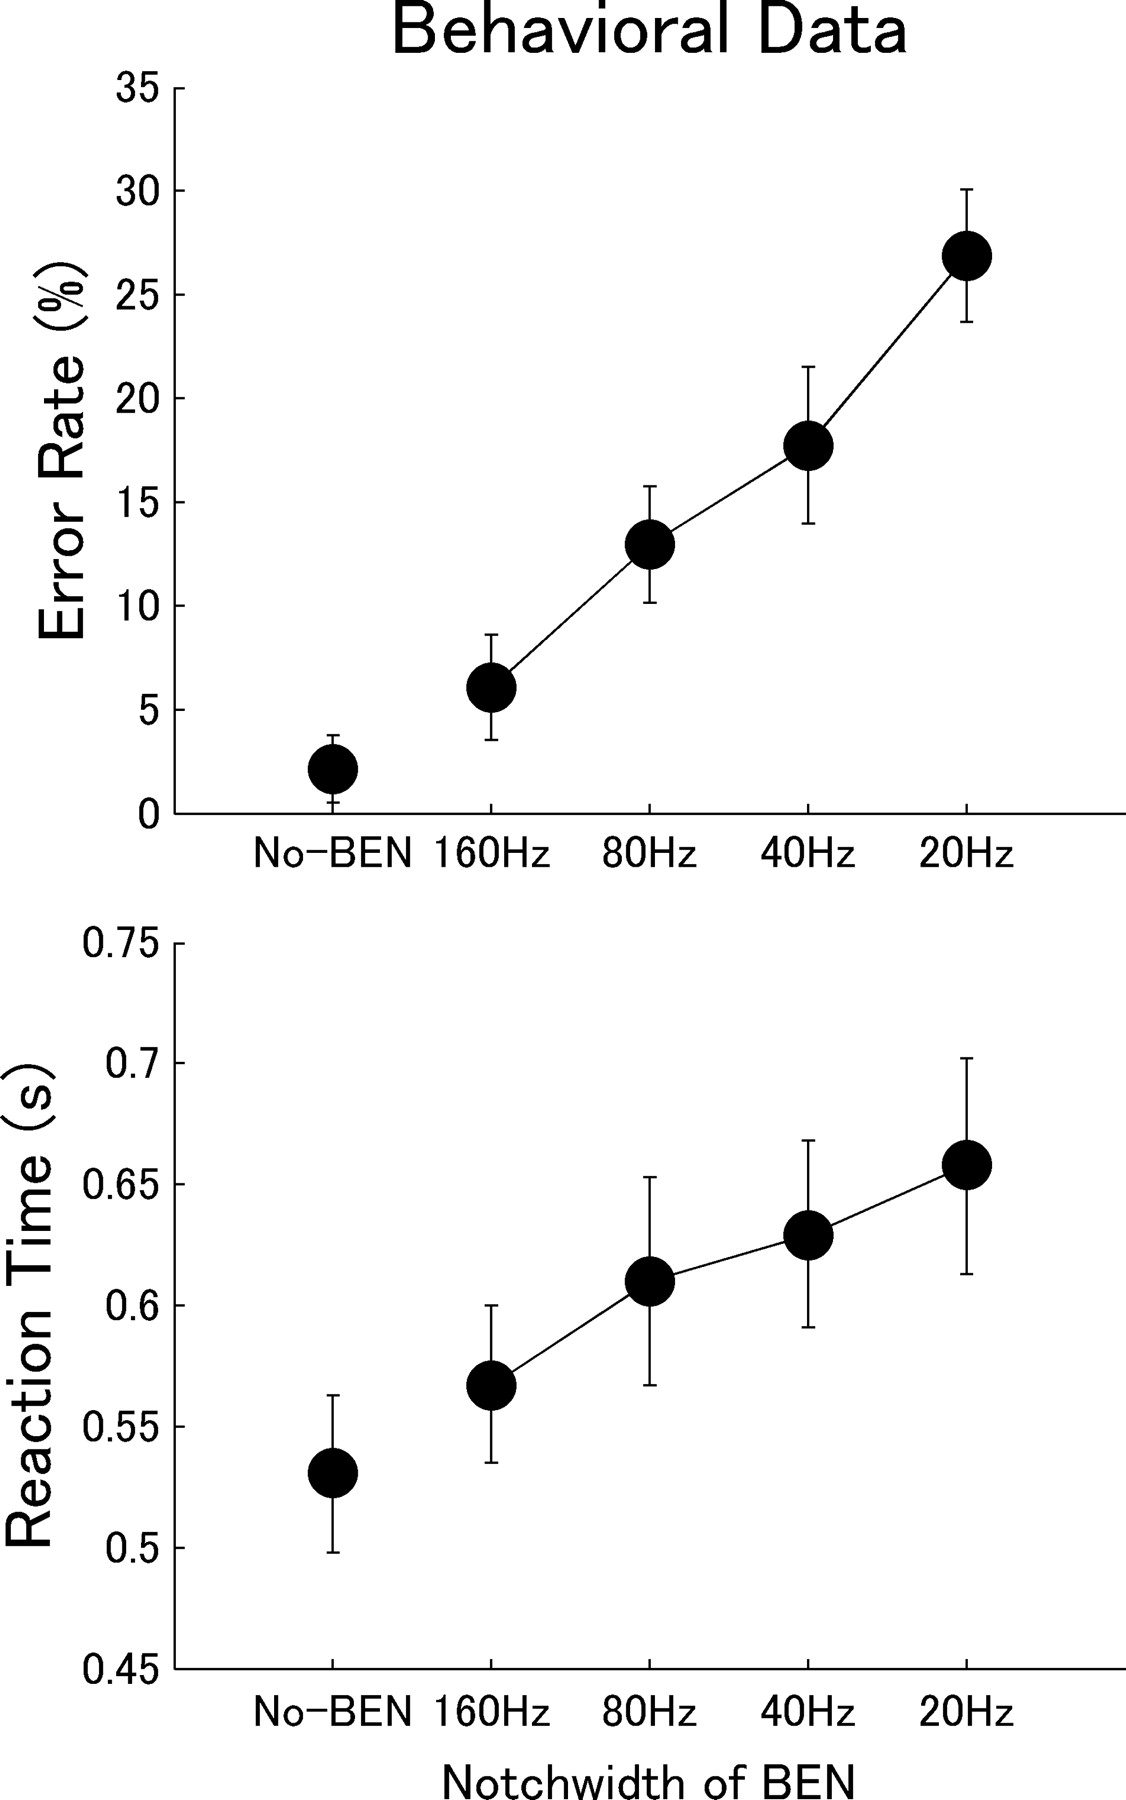
Error rates (false alarms plus misses) became larger and reaction times became longer with narrowing BENs as shown in Figure 7. The repeated-measures ANOVA applied to error rate showed a significant main effect of BEN type (F(3,36) = 103.1; p < 0.0001), and post hoc comparisons revealed significant differences between all BEN types (p < 0.0005). Also, the repeated-measures ANOVA applied to reaction time showed a significant main effect of BEN type (F(3,36) = 46.5; p < 0.0001), and again post hoc comparisons revealed significant differences between all BEN types (p < 0.001) except for BEN40 vs BEN80 (p = 0.024).

Behavioral measurement: error rate and reaction time. The diagrams display the error rate (top diagram) and reaction time (bottom diagram) as a function of BEN type, with error bars denoting the 95% confidence interval limits of the group (n = 13) means.
The results of the BEN ranking test showed that those subjects who had noticed differences between BENs were unable to rank them properly [mean, 1 (easy) to 4 (difficult) ± SD: BEN20, 2.62 ± 0.41; BEN40, 2.64 ± 0.60; BEN80, 2.69 ± 0.15; BEN160, 2.76 ± 0.65). Hence, participants were not able to identify the different BENs reliably.
Moreover, to verify relationships between behavioral and electro-neurophysiological responses, we performed additional correlation analyses. For MEG variables (normalized N1m source strength during active listening and N1m latency during active listening) we obtained the means per BEN condition (BEN160, BEN80, BEN40, and BEN20) across hemispheres and subjects; for behavior variables (reaction time and error rate), we obtained the means per BEN condition across subjects. Product-moment correlations (df = 2; critical value, 0.95) revealed significant relationships between normalized N1m source strength active and reaction time (r = −0.961; p = 0.039), N1m latency active and reaction time (r = 0.969; p = 0.031), as well as a correlation trend between N1m latency active and error rate (r = 0.913; p = 0.087).
Discussion
The present study experimentally confirmed the hypothesis that AEFs elicited by TS depend on the type of simultaneously presented BEN as well as the subject's attentional state. The results showed that N1m responses were significantly larger during active compared with distracted listening, especially when BENs with relatively narrow eliminated frequency bands were presented. Identical auditory stimuli (BENs and TS) were used during active and distracted listening conditions; the attentional state of the subjects differed between sessions. Therefore, afferent auditory inputs alone cannot explain the significant differences. Our results strongly suggest that focused auditory attention impacts the generators of the N1m, possibly via top-down neural connections.
In this study, we have successfully investigated neural population-level frequency tuning by means of MEG. Each BEN activated a neural population overlapping with the population corresponding to the TS. The degree of overlap differed between BENs (Fig. 1B, black areas); in the case of narrow BENs, fewer neurons were newly activated by the delayed TS onset (Fig. 1B, dark gray areas) compared with wide BENs. N1m source strength elicited by TS onset represents the number of newly activated neurons, which in turn reflects population-level frequency tuning, as has been shown by Sams and Salmelin (1994). Using a distracted listening condition, we replicated these results showing that wider BENs caused larger N1m amplitudes. Most importantly, in addition, we were able to demonstrate that the effect of BEN type significantly differed as a function of attention.
Previous EEG studies (Hillyard et al., 1973; Picton and Hillyard, 1974) showed significantly increased N1 responses during focused auditory attention. The authors suggested that focused auditory attention could modulate neural activities at an early stage of auditory analysis. In contrast, Naatanen et al. (1978) and Naatanen (1982) argued that the overlapping “processing negativity,” a component of endogenous origin characterized by a source differing from N1 source (Woods and Clayworth, 1987), caused the N1 amplitude enlargement. In the present experiment, however, N1m location differences between active and distracted conditions were not observed, a result that has already been found previously (Fujiwara et al., 1998). Therefore, it is likely to assume that the N1m enlargement was caused by modulation of neural activities affecting transmission, analysis, and representation of stimulus information in the auditory pathway (Hansen, 1990). Moreover, normalized N1m source strength showed significant differences between the two attentional conditions, including a significant interaction between attention and BEN type: the normalized N1m source strength difference between active and distracted listening conditions became systematically larger with decreasing spectral notch (Fig. 6). These results imply that focused auditory attention did not only amplify neural activity, but also sharpened the frequency tuning in the auditory cortex.
A series of previous psychoacoustical studies (Schlauch and Hafter, 1991; Hafter et al., 1993; Hubner and Hafter, 1995) also supports this hypothesis. It could be demonstrated that reducing frequency uncertainty by presenting frequency cues leads to sharpened frequency tuning and improved tone-detection performance. In the present study, we used one single TS fixed in frequency for all conditions. Hence, frequency uncertainty was minimal, whereas frequency selectivity around TS frequency was maximal. Thereby, the present results may reflect the modulation of neurophysiological filtering by focused auditory attention around the test stimulus frequency.
Inhibitory neural interactions might play an essential role for this sharpening effect. Previous studies have shown that the classical lateral inhibition concept (von Békésy, 1967; Suga, 1995; Pantev et al., 2004; Okamoto et al., 2005, 2007) can account for sharpening of frequency tuning in the central auditory system. Afferent neural inputs consist not only of excitatory, but also of broadly tuned inhibitory inputs, which suppress surrounding neural activities resulting in improved spectral contrast. However, a cotuned excitatory and inhibitory neural model based on previous single-neuron studies (Wehr and Zador, 2003; Oswald et al., 2006) can also explain the sharpening effect. Those studies demonstrated that frequency tuning curves of excitatory and inhibitory inputs are similar. However, inhibitory inputs follow excitatory inputs with a few milliseconds delay. Cotuned neural activities can improve temporal coding by shortening the duration of excitatory neural activities and also induce finer frequency tuning by suppressing excitatory activity (Tan et al., 2004). Thus, attentional enhancement of cotuned neural activities could also improve frequency tuning.
In the present study, the inhibitory system, intensified by focused auditory attention, might have sharpened the population-level frequency tuning via the top-down auditory pathway. As a consequence, neurons corresponding to edge frequencies of the BENs might have been less activated by the initial part of the BENs during active listening because of steeper frequency tuning characteristics (Fig. 1B). Hence, relatively more neurons could be activated by the delayed TS onset because of relatively small overlap with neurons already activated by the initial part of the BENs, resulting in increased N1m source strength during active compared with distracted listening, especially in case of narrow BENs. To summarize, the intensified inhibitory system in the auditory cortex may explain the sharpening effect observed in response to attended stimuli.
Single-cell recording studies revealed that frequency tuning can be modulated by learning-induced plasticity in the inferior colliculus (Gao and Suga, 1998), medial geniculate body (Edeline and Weinberger, 1992; Lennartz and Weinberger, 1992), primary auditory cortex (Weinberger et al., 1984; Ohl and Scheich, 1996; Fritz et al., 2005), and secondary auditory cortical fields (Diamond and Weinberger, 1984). Suga et al. (2002) showed that electrical stimulations in auditory cortex could cause expanded or compressed reorganization in this area and also subcortical auditory nuclei via efferent inputs. The tuning curves of neurons either shifted toward the parameter values of behaviorally important sounds (expanded reorganization, gain) or away from those values (compressed reorganization, sharpening). Thus, attention might also modulate receptive fields of the cortex and subcortical auditory nuclei via the efferent auditory pathway.
However, the comparison between plasticity of frequency tuning observed in single-cell responses and attentional modulation of population-level frequency tuning of human auditory cortical responses might be inappropriate (Ohl and Scheich, 2005). Woldorff et al. (1993) observed significant attentional gain effects on both P1m and N1m, but the effect was larger on N1m. An fMRI-study also showed that the mesial part of the human auditory cortex is a stimulus-driven area that was always activated by a sound stimulus regardless of the subject's state of attention, whereas the activation of the lateral auditory cortex depended on the state of attention regardless of sound properties (Petkov et al., 2004). Although the lowest stage on which attentional sharpening occurs remains to be determined, these results indicated that attentional modulation of population-level neural activities might take place mainly on the cortical level. Thus, it is reasonable to assume that in the present study attention mainly modulated the inhibitory neural conductance of the lateral auditory cortex.
Furthermore, we observed significant hemispheric differences in normalized N1m source strength, which was larger for the left hemisphere during both active and distracted listening. These laterality effects cannot be explained by the mere presence of the task during active listening. Previous studies have shown that the left hemisphere may be dominant for processing requiring fine temporal resolution (Zatorre and Belin, 2001), and temporal coherence seems to be crucial for the segregation of target sounds from nontarget sounds (Barbour and Wang, 2002). Other authors (Poeppel, 2003; Boemio et al., 2005) have suggested the “asymmetric sampling in time” hypothesis. This model suggests that the left auditory cortex dominantly exploits short temporal integration windows (20–40 ms), whereas the right auditory cortex exploits longer ones (150–250 ms). In the present study, information from short temporal integration windows would be important for detection of the TS onset inside the BENs. Thus, the left hemispheric dominance observed here may imply that the left hemisphere plays a more important role for monitoring and analyzing auditory signals in noisy environments.
One can hypothesize that subjects may allocate more or less attention to solving a task depending on its difficulty. In this study, subjects were unable to strategically adjust the degree of attention allocated before TS onset based on BEN type. Moreover, transient and sustained AEFs elicited by the initial part of the different BENs did not differ systematically, but were generally larger in case of focused auditory attention. Sustained AEFs evoked by BENs overlapped with neural activities elicited by TS. However, by applying baseline correction, we eliminated the sustained neural activities elicited by BENs (Fig. 1B, black and light gray areas) and were able to successfully extract neural responses elicited by the test stimulus only (dark gray areas).
In conclusion, this study has shown for the first time that focused auditory attention cannot only amplify neural activities in general (gain effect), but also can sharpen population-level frequency tuning in the human auditory cortex, possibly via the inhibitory system. Auditory cortical neurons seem to be influenced by both: bottom-up physical sound features and top-down attentional processes. Effects of bottom-up and top-down neural inputs on excitatory and inhibitory neural networks within the human auditory cortex result in enhanced and sharpened population-level neural responses, which are reflected by the N1m response during focused auditory attention.
Footnotes
-
This work was supported by the Deutsche Forschungsgemeinschaft Pa 392/10-2. We thank Andreas Wollbrink for technical assistance and Claude Alain, Markus Junghoefer, and Patrick Bermudez for reading this manuscript and for helpful comments.
- Correspondence should be addressed to Dr. Christo Pantev, Institute for Biomagnetism and Biosignalanalysis, Westfalian Wilhelms-University Muenster, Malmedyweg 15, 48149 Muenster, Germany. pantev{at}uni-muenster.de


