 Irene Roalkvam1 Håkon Dahle1 Yifeng Chen2 Steffen Leth Jørgensen1 Haflidi Haflidason3 Ida Helene Steen1*
- 1 Center for Geobiology, Department of Biology, University of Bergen , Bergen, Norway
- 2 Guangzhou Institute of Geochemistry, Chinese Academy of Sciences, Guangzhou, China
- 3 Department of Earth Science, University of Bergen, Bergen, Norway
To obtain knowledge on how regional variations in methane seepage rates influence the stratification, abundance, and diversity of anaerobic methanotrophs (ANME), we analyzed the vertical microbial stratification in a gravity core from a methane micro-seeping area at Nyegga by using 454-pyrosequencing of 16S rRNA gene tagged amplicons and quantitative PCR. These data were compared with previously obtained data from the more active G11 pockmark, characterized by higher methane flux. A down core stratification and high relative abundance of ANME were observed in both cores, with transition from an ANME-2a/b dominated community in low-sulfide and low methane horizons to ANME-1 dominance in horizons near the sulfate-methane transition zone. The stratification was over a wider spatial region and at greater depth in the core with lower methane flux, and the total 16S rRNA copy numbers were two orders of magnitude lower than in the sediments at G11 pockmark. A fine-scale view into the ANME communities at each location was achieved through operational taxonomical units (OTU) clustering of ANME-affiliated sequences. The majority of ANME-1 sequences from both sampling sites clustered within one OTU, while ANME-2a/b sequences were represented in unique OTUs. We suggest that free-living ANME-1 is the most abundant taxon in Nyegga cold seeps, and also the main consumer of methane. The observation of specific ANME-2a/b OTUs at each location could reflect that organisms within this clade are adapted to different geochemical settings, perhaps due to differences in methane affinity. Given that the ANME-2a/b population could be sustained in less active seepage areas, this subgroup could be potential seed populations in newly developed methane-enriched environments.
Introduction
Anaerobic methanotrophs (ANME) play a vital role in the global carbon cycle budget, acting as methane sinks in marine systems. Through anaerobic oxidation of methane (AOM) they are estimated to consume >90% of the 85–300 Tg CH4 annually produced, and thereby contribute to a strong reduction of methane emission to the atmosphere (Knittel and Boetius, 2009). Their main niche in marine sediments is the sulfate-methane transition zone (SMTZ) which is formed when methane from subsurface reservoirs meets sulfate penetrating from the water column through advection (Berelson et al., 2005; Treude et al., 2005b; Knittel and Boetius, 2009). The location of the SMTZ ranges from a few decimeters to several hundred meters below the seafloor, and is influenced by the local geological settings such as the depth of the methane production zone, the flux of methane, and sulfate through the sediment column and their consumption rates (Knittel and Boetius, 2009). Sequences from all the currently defined ANME clades, ANME-1, ANME-2, and ANME-3, have been retrieved from SMTZs from areas like the Gulf of Mexico (Lloyd et al., 2006), Skagerrak (Parkes et al., 2007), Haakon Mosby Mud Volcano (HMMV; Niemann et al., 2006) respectively, and the present understanding is that no specific ANME clade is considered characteristic for the SMTZ.
Although the SMTZ is often dominated by members of the ANME clade, other archaeal taxa besides ANME have been found to be enriched within the SMTZ. Uncultured Archaea like Marine Benthic Group B (MBG-B) [also named Deep Sea Archaeal Group (DSAG)], Miscellaneous Crenarchaeotic group (MCG), and Marine Benthic Group D (MBG-D) are among the most abundant taxa in systems like the Peru margin, Aarhus bay, Benguela Upwelling System, and Santa Barbara Basin (Sørensen and Teske, 2006; Schafer et al., 2007; Harrison et al., 2009; Webster et al., 2011). No ANME population was identified in sediments from the Peru margin and Cascadian margin in the study by Inagaki et al. (2006), despite the presence of gas hydrates located close to the SMTZ (present at 50–110 mbsf and below), while ANME was found among the low-abundance taxa in the other locations mentioned above. The highly abundant DSAG in Peru margin sediments has been suggested to be involved in the consumption of methane or in sulfate reduction (D’Hondt et al., 2004; Biddle et al., 2006; Inagaki et al., 2006), although the metabolic capability of this taxon remains unsolved. Furthermore, the methane fluid flux into the SMTZ in Peru margin has been estimated to 1.6–8.8 mmol/m2 year (Biddle et al., 2006), which is considerably lower than the flux in ANME-dominated areas like Hydrate Ridge (11–33 × 103 mmol/m2 year; Torres et al., 2002), the Gulf of Mexico (500–2300 mmol/m2 year; Lloyd et al., 2010), and Eckernförde Bay (240–690 mmol/m2 year; Treude et al., 2005a). Hence, the microbial community composition and abundance of various archaeal taxa in marine sediments could be related to the supply of methane through the system over time, and whether the available methane is sufficient to sustain an ANME-dominated community over other uncultured Archaea.
For the G11 pockmark at Nyegga (the southern Vøring Plateau, offshore Mid-Norway) located at water depth of 730 m the methane flux rate is estimated to 300–500 mmol/m2 year (Chen et al., 2010). New high-throughput pyrosequencing technologies allow a deeper sampling of the ecosystems of interest, and approaches involving barcodes or unique DNA sequence identifiers have been developed for multiplex sequencing (Huber et al., 2007; Parameswaran et al., 2007; Hamady et al., 2008). The stratification of microorganisms in sediments from the G11 pockmark was recently analyzed by using FISH, quantitative PCR, and 16S rRNA gene amplicon libraries of several subsamples (Roalkvam et al., 2011). The sediment core was sampled inside the G11 pockmark in a pingo structure, which is characterized by an elevated seafloor due to the local accumulation of gas hydrates below (Hovland and Svensen, 2006), where the methane flux is relatively high. The horizons in the shallower parts of the core [0–3 cm below seafloor (cmbsf)] were dominated by aerobic methanotrophs within Gammaproteobacteria, and sulfur oxidizing taxa within Epsilonproteobacteria. At depths below 4–5 cmbsf, a stratification of ANME clades was observed with transitions between horizons dominated by ANME-2a/b, ANME-1, and ANME-2c with increasing depth.
Here, we used 454-pyrosequencing of 16S rRNA tagged PCR-amplicons combined with quantitative PCR to investigate the stratification of the microbial communities in a Nyegga sediment with a relatively low methane flux 80 mmol/m2 year and deep SMTZ at 205–255 cmbsf (Chen et al., 2011). Furthermore, we compare the microbial diversity and dominating ANME phylotypes in sediments with low methane flux with those present in sediments with higher methane flux from a pingo structure within the G11 pockmark (Roalkvam et al., 2011). Overall, we demonstrate that the local fluid flow regimes influence the abundance and diversity of microbial populations in cold seep sediments at Nyegga, and possibly in cold seep sediments in general.
Materials and Methods
Site Description and Sampling
The Nyegga area is located on the upper Mid-Norwegian continental slope, at the northeast flank of the Storegga Slide (Figure 1), and is characterized by a high density of pockmarks and fluid seepage structures (Evans et al., 1996; Hustoft et al., 2010; Reiche et al., 2011). The area has been a field for multidisciplinary studies on gas hydrates, authigenic carbonates, fluid flow, and pore-water geochemistry the last decade with a special focus on the active micro-seeping area around pockmarks G11 and CN03 (also called CNE03; Hovland et al., 2005; Hovland and Svensen, 2006; Mazzini et al., 2006; Chen et al., 2010; Hustoft et al., 2010; Ivanov et al., 2010; Plaza-Faverola et al., 2010, 2011; Vaular et al., 2010; Reiche et al., 2011). Recent 2D/3D seismic and multibeam mapping of the Nyegga area has revealed an area with a high density of pockmark structures, many with underlying gas blanking areas extending down to a pronounced bottom simulating reflector (BSR) at 250–300 m depth below seafloor (mbsf; Bünz et al., 2003; Hustoft et al., 2007, 2009, 2010; Hjelstuen et al., 2010; Plaza-Faverola et al., 2010; Reiche et al., 2011). During a cruise with R/V G.O.Sars to the Nyegga area in August of 2008, the 3 m long gravity core GS08-155-15GC (referred to as 15GC hereafter) was retrieved from the CN03 area (64°45.274′N 05°04.088′E) at 725 m water depth. The ambient seawater temperature was measured with CTD to be between −0.6 and −0.7°C. After retrieval of 15GC, one half of the core was immediately sampled for detailed microbial diversity studies and geochemical measurements while the other half was stored at 4°C as an archive for non-destructive MST and XRF core scanner studies in laboratories on land. Rhizon samplers were used to extract pore-water from eight horizons throughout the core; at 24, 57, 89, 129, 171, 244, 258, and 290 cm below seafloor (cmbsf). The subsamples were preserved in glass vials and kept cool until they were analyzed according to the approach in Chen et al. (2010) in order to determine the concentration of dissolved sulfate () and total dissolved hydrogen sulfide (ΣH2S). Subsamples for DNA extraction were aseptically retrieved at 10, 30, 50, 80, 100, 120, 140, 160, 180, 200, 220, 240, 255, 270, and 300 cmbsf (±0.5 cm) by using sterile 1 mL tip cut plastic syringes before they were snap-frozen in liquid N2 and stored at −80°C.
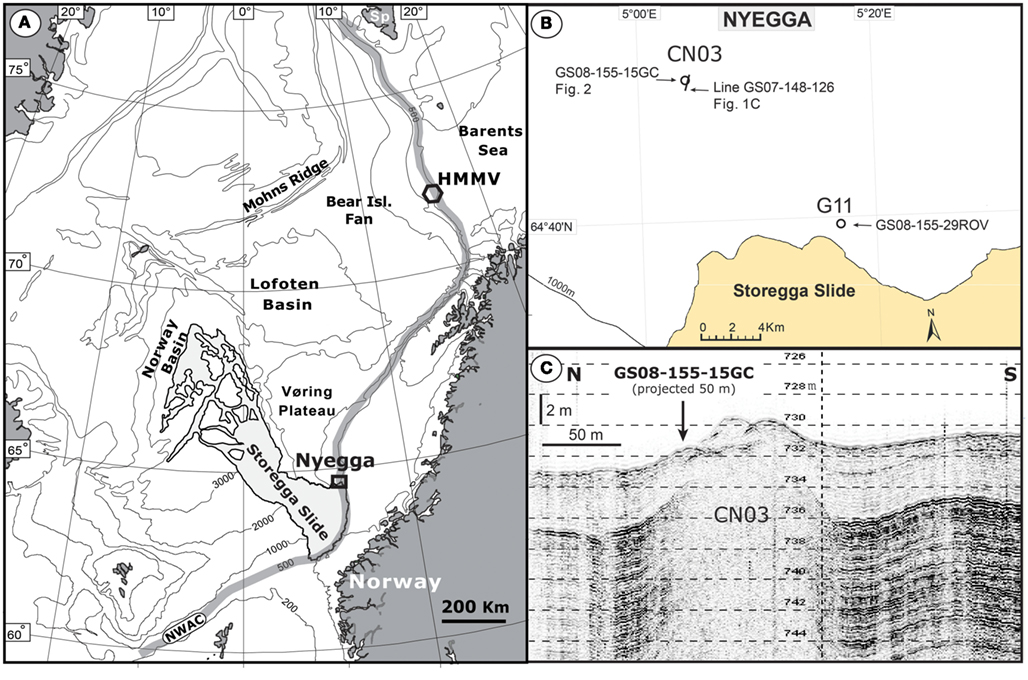
Figure 1. Overview map of the Norwegian Sea and the surrounding land areas with the location of the Nyegga study area and the HMMV (Håkon Mosby Mud Volcano). The position of the main pathway of the warm surface current NWAC (Norwegian Water Atlantic Current) is outlined (A). Location of the CN03 target site and the pockmark G11 at the Nyegga area (B). A high-resolution TOPAS profile (Line GS07-148-126) across the CN03 gas seeping area with inserted the location of the studied core GS08-155-15GC (C).
Estimation of Methane Flux
Sulfate gradients may be used to estimate the in situ methane flux (Borowski et al., 1996). The sulfate diffusive flux is obtained from the linear zone in the concentration profile, i.e., from the depth range in which there is no production or consumption. Fick’s first law (Krom and Berner, 1980) was used to calculate the sulfate diffusive flux in the core, as described by Chen et al. (2010). As the consumption of sulfate and methane has the stoichiometry 1:1 during AOM (Boetius et al., 2000), the sulfate diffusive flux is equivalent to the methane flux. The flux was estimated to ∼80 mmol/m2 year in 15GC, when a core porosity of 63% was used (Chen et al., 2011).
DNA Extraction and 16S rRNA Gene Amplicon Library Preparation
Total genomic DNA was extracted from ∼0.5 g of sediment from all subsamples using FastDNA Spin kit for soil (MP Biomedicals), and was subsequently quantified by A260/A280 ratio measurements, as described in Roalkvam et al. (2011). The pipeline of 16S rRNA gene amplicon library preparation, sequence filtering, and taxonomical classification of amplicons is described elsewhere (Lanzén et al., 2011; Roalkvam et al., 2011). In short, DNA from seven subsamples in 15GC (10, 30, 80, 120, 180, 240, and 270 cmbsf) was applied in a two step PCR in order to generate a 16S rRNA gene amplicon library for each horizon where both PCR’s followed a previously described protocol (Roalkvam et al., 2011). In order to evaluate the accuracy of the PCR and the sequencing step, subsample 270 cmbsf from 15GC was analyzed in triplicates. Template DNA from all subsamples were amplified in triplicates using the primers Un787f (5′-ATTAGATACCCNGGTAG; Roesch et al., 2007) and Un1392r (5′-ACGGGCGGTGWGTRC; modified from Lane et al., 1985). The triplicates were pooled, and impurities were removed using MinElute® PCR purification kit (Qiagen). Purified amplicons were used as template in a second PCR where the above mentioned primers were modified to specifications in Lib-L chemistry: the GS FLX Titanium Primer A sequence and a specific MID sequence of 10 bp for each sample was included in forward primer Un787f, while the GS FLX Titanium Primer B sequence was included in reverse primer Un1392r. The final amplicons were purified as described above and the concentration was determined by SYBR-Green quantification, as described in Roalkvam et al. (2011). Prior to the pyrosequencing all samples were pooled, and a final purification using Agencourt AMPure XP (Beckman Coulter genomics) was applied to ensure removal of all impurities. The GS FLX instrument (Roche) at the Norwegian Sequencing Centre was used with 450 bp chemistry for 454-pyrosequencing of all amplicons. The raw sff-files of 16S tag-encoded amplicons from all subsamples in gravity core 15GC from Nyegga have been submitted to the Sequence Read Archive under the accession number SRA026733.
Quality Filtering of 16S Amplicon Sequences and Taxonomic Classification
Quality filtering and noise removal of pyrosequencing reads of amplicons were carried out using AmpliconNoise (Quince et al., 2011) as described in Roalkvam et al. (2011). In summary, noise, and errors introduced during PCR and pyrosequencing are corrected during four steps: filtering, flowgram clustering, sequence-clustering, and chimera removal. The filtered sequences were aligned to a reference database prepared from Silva SSURef release 102 (Lanzén et al., 2011) using blastn (default parameters). Sequences with a bit-score above 150 were assign to their equivalent taxa in the modified Silva Taxonomy described above based on the taxonomy of the best blastn bitscores within a 10% range, using MEGAN version 3.7 (Huson et al., 2007). Finally, the assignments were exported and weighed according to its cluster’s copy number.
The amplicon library from 270 cmbsf was made in triplicates prior to sequencing to test the precision and reproducibility of our primers and the pipeline for amplicon construction and filtering. The relative abundance of the taxa listed at all taxonomical levels was compared between the parallel samples, all showing nearly the same relative taxa distribution (maximum deviation at any given taxonomic level was 0.014%). The triplicates were therefore merged and treated as one subsample, comprising 61268 reads, due to the low deviation in relative abundance.
Operational Taxonomic Unit Assignment and Diversity Index Estimations
To compare the microbial communities in GC15 from the CN03 area with those in the more active area within the pingo structures at G11 pockmark (Roalkvam et al., 2011) on operational taxonomical units (OTU)-level, the individual 16S rRNA gene tagged amplicon files were merged and grouped into OTUs using the AmpliconNoise software and its incorporated features (Quince et al., 2011). In AmpliconNoise, a quick pre-clustering of flow-grams was performed prior to the pair-wise alignment of sequences using the Needleman–Wunsch algorithm (Needleman and Wunsch, 1970), followed by a hierarchical maximum linkage clustering with of 97% sequence identity. In order to assign a taxon to each cluster, one representative sequence from each OTU was selected and aligned to the Silva Taxonomy using MEGAN. The sequences representing each OTU were aligned to the Silva SSURef release 104 in Arb, and a total of 23 sequences were excluded due to short length (<220 bp) or chimeras, leaving 3299 sequences.
Diversity indices were calculated by the Shannon–Weaver index (Weaver and Shannon, 1949) and Rao’s quadrate entropy index (Rao, 1982) using R (version 2.13.1) with the Vegan package integrated or an in-house R script, respectively. The distance matrix needed for Rao’s quadrate entropy index was generated using Phylogeny Inference Package (PHYLIP; Felsenstein, 1989) in Arb (Version 5.0). Diversity indices, such as the Shannon index, may be influenced by sampling size. To compare diversity indices across pyrosequencing libraries of variable size, all sequence tags from all samples were first clustered into OTUs. Then each library were randomly subsampled using a subsampling size equal to the sample size of smallest library (796 reads) and by keeping the original OTU assignments for each sequence tag. Reported mean values and standard deviations were calculated from indices calculated from 1000 subsampling iterations per sample.
Quantitative PCR
The number of 16S rRNA genes from both Archaea and Bacteria in each subsample of 15GC were enumerated using real-time quantitative PCR, as described in Roalkvam et al. (2011). In short, genomic DNA from subsamples was quantified in duplicates, where each reaction (20 μl) contained 1× Power SYBR-Green PCR Master Mix (Applied Biosystems), 1 μM of each primer, and 1 ng template. The 16S rRNA genes of bacterial origin were amplified using the primers B338f (5′-ACTCCTACGGGAGGCAGC; Amann et al., 1995) and B518r (5′-ATTACCGCGGCTGCTGG; Muyzer et al., 1993) and 40 cycles of the thermal program described by Einen et al. (2008). The standard curve was generated using DNA from Escherichia coli, and genomic DNA from Archaeoglobus fulgidus was used as negative control. Similarly, archaeal 16S rRNA genes were amplified using primers Un519f (5′-TTACCGCGGCKGCTG; Ovreas et al., 1997) and A907r (5′-CCGTCAATTCCTTTRAGTTT; modified from Muyzer et al., 1995) and 40 cycles of the thermal program described by Roalkvam et al. (2011). The linearized fosmid 54d9 was used to generate standard curve and genomic DNA from E. coli was used as negative control. For each subsample, the mean number of 16S rRNA gene copies/g sediment and corresponding standard deviation was used as enumeration of Bacteria or Archaea in the core.
Results
Geochemistry
The concentration of dissolved sulfate () and total dissolved hydrogen sulfide (ΣH2S) in pore-water from core 15GC from the CN03 area was determined. The results show a linear decrease in the concentration of with depth, ranging from 27.2 mM at 24 cmbsf to 2.7 mM at 290 cmbsf, concomitant with a gradual increase in the concentration of ΣH2S from 1.2 to 6.28 mM for the same depth interval, respectively (Figure 2). However, the highest concentration of ΣH2S was measured to 13.38 mM at 244 cmbsf. The methane flux was estimated to ∼80 mmol/m2 year in 15GC, based on the linear zone in the sulfate concentration profile. The SMTZ in 15GC was estimated to be at ∼205–255 cmbsf, which is supported by the peak at 244 cmbsf in the δ13CDIC measurements (Chen et al., 2011). Consumption of sulfate is mainly ascribed to AOM (85%) and oxidation of other organic material (15%; Chen et al., 2011). A characteristic SMTZ was not observed in 29ROV. In 15GC, the methane concentration in the headspace of pore-water samples ranged from 0.012 to 0.38 mmol/L in horizons above the SMTZ, and gradually increased values from 0.16 to 3.6 mmol/L between 243 and 290 cmbsf (Vaular, 2011).
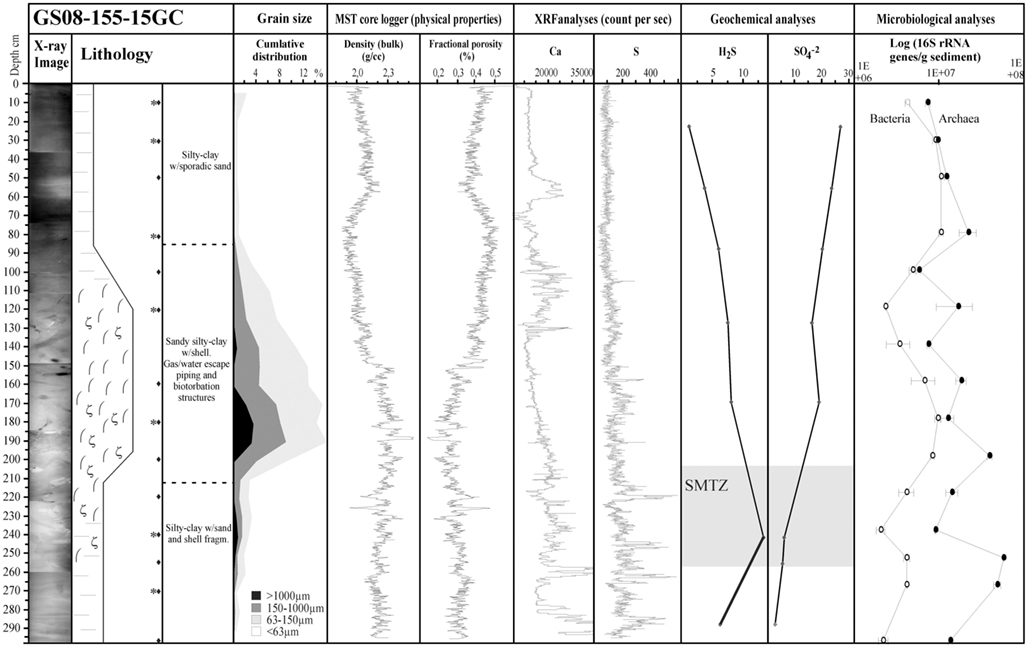
Figure 2. The analyzes of geological parameters and physical properties in core 15GC show (from left to right): X-ray image of the core, Lithological log, Grain size, Bulk density, and fractional porosity based on MST logger unit, Ca, and S (count per second) based on XRF element core scan, Geochemical analyzes of H2S and , Enumeration of archaeal and bacterial 16S rRNA gene copies/g sediments based on quantitative PCR. Legends for Lithology: (−) silty-clay, ( ) piping, and bioturbation, (ζ) shell/shell fragments, (♦) subsamples for DNA extraction, (*) subsamples for 16S rRNA gene tagged amplicon library construction.
The 15GC core consists of silt and clay rich sediments with a high bulk density (1.9–2.3 g/cm3) and low porosity, presented as fractional porosity (∼25–45%), and a low permeability (Figure 2). The sediment interval starting at 80–90 cmbsf and ending at ∼230–240 cmbsf, within the present SMTZ, is pierced by piping structures and chemosynthetic shells and shell fragments, indicating that the core site has been an active methane seeping area at earlier stage. The high variability in the carbonate content, represented by the XRF analysis on the Ca element, shows that that episodic activity of biogenic production is also found in more recent times, at a depth of ∼30 cm (Figure 2).
Quantitative PCR
Both Bacteria and Archaea in 15GC were enumerated as 16S rRNA gene copies/g sediment using quantitative PCR. The relative abundance of 16S rRNA gene copies/g sediment throughout the core was 2.05 × 10⁶–1.06 × 10⁷ for Bacteria and 5.76 × 10⁶–5.75 × 10⁷ for Archaea (Figure 2). At all depths Archaea dominated over Bacteria, accounting for 51.7–93.3% of all 16S rRNA gene copies. The number of 16S rRNA gene copies of archaeal origin increased toward the SMTZ and decreased below this zone. In comparison, bacterial 16S rRNA gene copies dominated 29ROV in the horizons from the sediment surface to 7–8 cmbsf, ranging between 6.72 × 10⁶ and 9.1 × 10⁸ 16S rRNA gene copies/g sediment (Roalkvam et al., 2011). The bacterial population in 15GC was thus between two and three orders of magnitude lower than in 29ROV, except for the deepest horizon in 29ROV where the bacterial population decreased rapidly. Finally, the increase in the archaeal population with increasing depths was one order of magnitude for 15GC and three orders of magnitude for 29ROV.
In summary, the 16S rRNA gene quantifications showed two to three orders of magnitude lower relative cells numbers in the core from the micro-seepage CN03 area than in the active G11 pockmark.
Taxonomy
The application of pyrosequencing of 16S rRNA gene tagged PCR-amplicons to obtain detailed knowledge on the community structure has recently been proven efficient in studying stratification of microorganisms in sediment cores at a much higher resolution than has been done previously (Lanzén et al., 2011; Roalkvam et al., 2011). This approach was used to examine the community structure in 15GC, from seven depth horizons (10, 30, 80, 120, 180, 240, and 270 cmbsf) were analyzed by 454-pyrosequencing yielding 3344-26491 reads, whereof 16.4–29.0% were removed due to poor quality or chimeric sequences. The remaining number of reads in the dataset were between 2388 and 21400 for 15GC subsamples (Table 1).
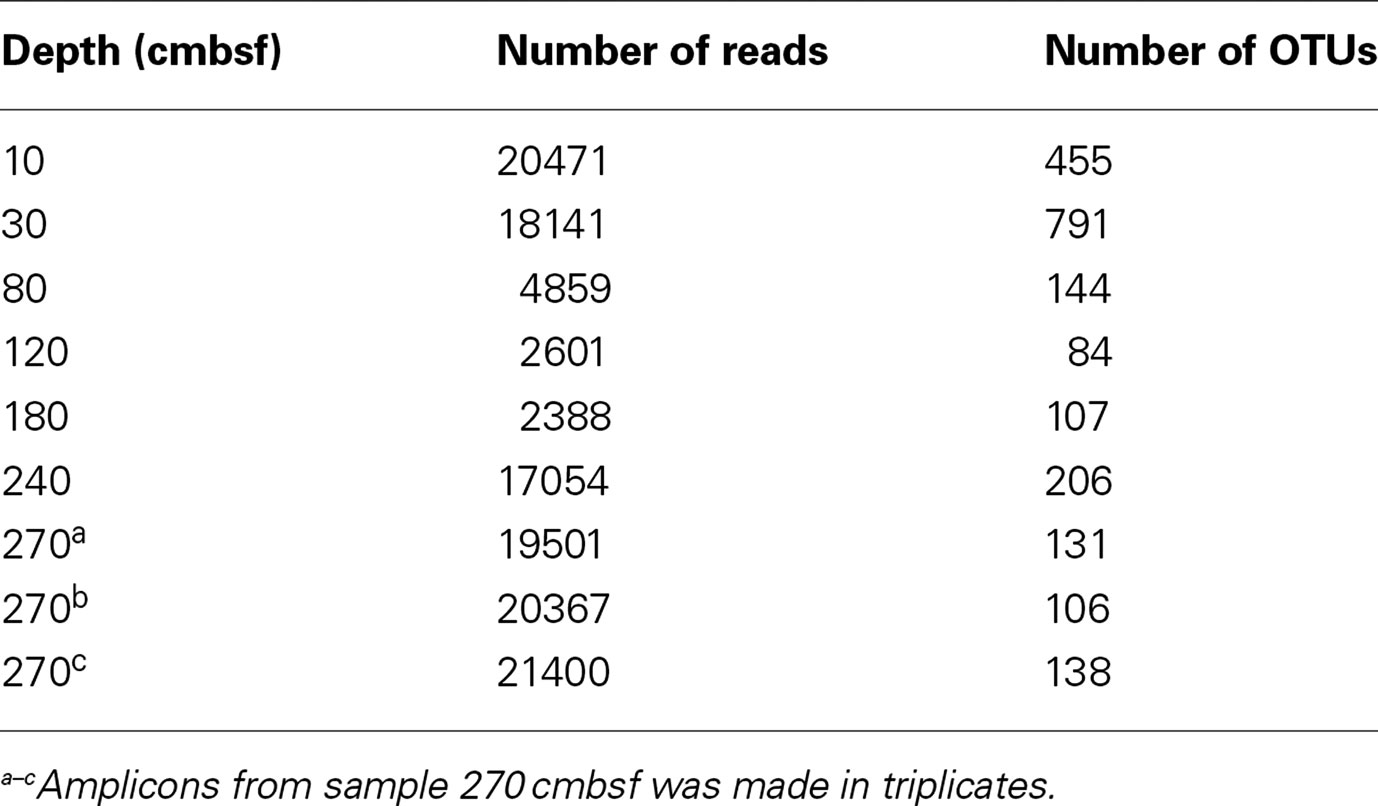
Table 1. Statistical parameters of 15GC.
Taxonomic classification revealed a high abundance of taxa that are deficiently described below phylum and class level, such as uncultivated taxa within Marine group 1 (MG-1; Thaumarchaeota); Thermoplasmata and MBG-B/DSAG (Crenarchaeota); and Planctomycetes, Chloroflexi, and Candidate divisions (JS-1 and OP8; Bacteria). Hence, the number of classified reads at lower taxonomic levels decreased, where up to 88.6 and 89.8% of the community remained unclassified at order or family level, respectively. Therefore, only reads binned at phylum and class level, in addition to selected groups within Methanomicrobia (Euryarchaeota), were used further in this work.
Microbial Diversity in Amplicon Library and Abundance
Most of the detected bacterial taxa were found in the shallower horizons, including phyla such as Proteobacteria, Planctomycetes, Deinococcus-Thermus, and the Candidate division OP8, all decreasing in abundance to less than 1% below horizons at 80–120 cmbsf (Figure 3A). Similarly, the abundance of the phylum Chloroflexi decreased rapidly in horizons below 80 cmbsf, although comprising up to 2% in some of these horizons. The Bacteria was dominated by the Candidate division JS-1, which was present throughout the sediments with the highest abundance at 10 and 30 cmbsf accounting for 13.2 and 28% of the total number of reads, respectively. In each sediment horizon, uncultivated lineages of Archaea dominated, congruent with the quantitative PCR-data (Figure 2). Low-abundance archaeal taxa, such as MCG (1.1–1.8%) and Group C3 (group 1.2; 1.2–2.6%) within Crenarchaeota and Thermoplasmata (0.3–4.2%) and Archaeoglobi (1.2%) within Euryarchaeota were mainly present in horizons between 10 and 80 cmbsf. Different depth profiles of the most abundant taxa MG-1, DSAG, and Methanomicrobia were observed (Figure 3A). The shallower horizons (10–120 cmbsf) above the SMTZ had high abundance of MG-1, ranging between 15.2 and 61.4%, which rapidly decreased toward the SMTZ (5.2% at 180 cmbsf and further to <1% in deeper parts of the core). The DSAG did not reach as high relative abundance as the MG-1, but represented a high share of the microbial community above and within the SMTZ, comprising between 16.2 and 29.2% in horizons at 10–240 cmbsf, except at 270 cmbsf where the abundance was reduced to 3.9% (Figure 3A). In the deeper horizons (180–270 cmbsf), where methane concentrations up to 3.6 mmol/L has been detected in the pore-water (Vaular, 2011), ANME clades affiliated with Methanomicrobia were increasingly dominant. A similar stratification of dominating ANME clades with increasing depth as in 29ROV was observed with a transition from an ANME-2a/b dominated community to an ANME-1 dominated community. However, the stratification was over wider sediment depths in 15GC ranging from 120 to 270 cmbsf in comparison to 4–22 cmbsf in 29ROV. The highest abundance of the ANME-2a/b clade was found at 120 and 180 cmbsf, with 16.9 and 33.3% of the total reads respectively (Figure 3B), and hence comprising a similar share of the community as in 29ROV (Roalkvam et al., 2011). The abundance of ANME-2a/b decreased gradually to <1% with increasing depth, while ANME-1 increased from 11.1 to 47.9% between 180 and 240 cmbsf. A further increase to 82.2% at 270 cmbsf was observed, which was the highest abundance of ANME-1 in 15GC (Figure 3B). The highest relative abundance of ANME-1 in 15GC (47.9–82.2%) corresponded to the abundance of ANME-1 in 29ROV (64–89%; Roalkvam et al., 2011). However, the abundance of ANME-2c increased to a maximum of 60% at 20–22 cmbsf in 29ROV (Roalkvam et al., 2011), which is considerable higher than the maximum value of 5.7% at 270 cmbsf in 15GC.
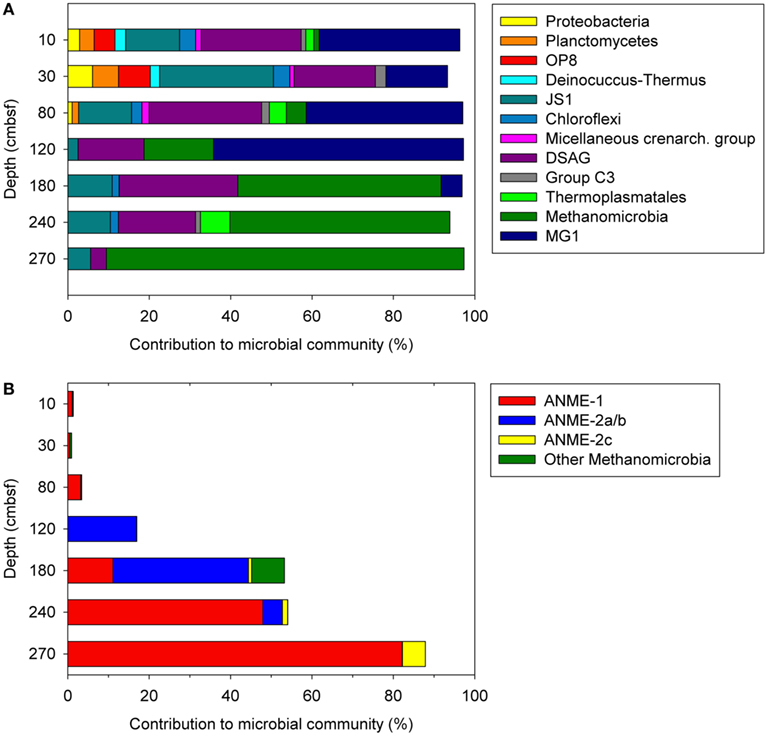
Figure 3. Microbial community structures at different depths in 15GC, based on 454-pyrosequencing of 16S rRNA gene tagged amplicons. The distribution of selected taxa is shown at phylum/class level (A) and within the class Methanomicrobia (B).
Diversity Indices and OTU Distribution
Shannon–Weaver index and Rao’s quadrate entropy index were used to evaluate and compare the microbial diversity of the communities in CN03 with those in the G11 pockmark, based on all reads in the amplicon libraries from 15GC and 29ROV. The main difference between the indices used is that Rao’s quadrate entropy index includes the distance between OTUs in addition to the abundance of sequences. A total of 3322 OTUs were obtained from 29ROV and 15GC combined, based on 193363 16S rRNA gene sequences from amplicon libraries. This approach revealed a vertical variation in microbial diversity in both cores, where a trend of decreasing diversity with increasing depth was observed regardless of the index used (Figure 4). For core 15GC, the diversity was decreasing gradually with depth, except at 120 cmbsf where the trend was interrupted by the particularly low diversity estimate. The core 29ROV had a different diversity profile, with a gradual decrease in the upper part of the core, followed by a considerable decline in the deeper part (Figure 4). The lowest diversity was found at 270 cmbsf in 15GC and 14–16 cmbsf in 29ROV, which corresponds to the horizon in each core with the highest abundance of ANME-1.
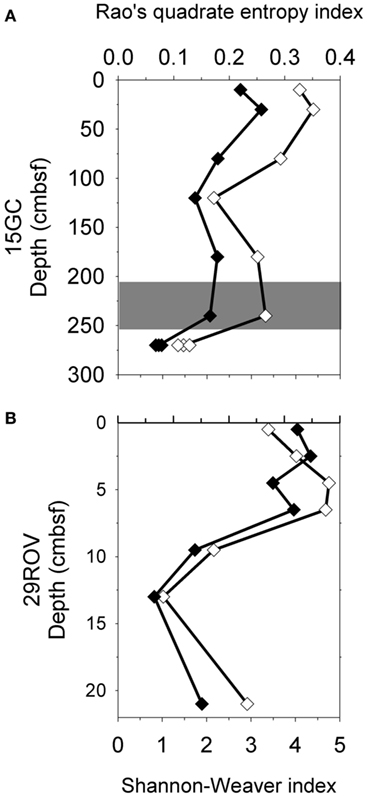
Figure 4. Diversity estimations using Shannon–Weaver index (♦) and Rao’s quadrate entropy index (⋄) for 15GC (A) and 29ROV (B). The standard deviation for subsamples within 15GC and 29ROV were calculated to be 0.041–0.068 and 0–0.078 for the Shannon–Weaver index, respectively, and between 3.04–8.67 × 10⁻³ and 0–9.05 × 10⁻³ for the Rao’s quadrate entropy index, respectively. All standard deviation bars are smaller than the size of symbols displayed in the figure. The gray area indicates the sulfate-methane transition zone in 15GC (A).
Sequences from 29ROV were clustered into 2370 OTUs (1908 unique OTUs) and 15GC were assigned to 1414 OTUs (952 unique OTUs sampling site) (Table 2), where only 462 OTUs were shared between the sampling sites. The majority of the taxa from both cores were clustered into several OTUs, where at least one OTU was common. Predominating taxa within each core were present in common OTUs, however some low-abundant taxa within Archaea [such as Marine Benthic Group A, Archaeoglobaceae, Thermococcales, South African Goldmine Euryarchaeotal Group (SAGMEG), and Marine Group II within Thermoplasmata] and Bacteria (such as Candidate division OP11, Chlorobiale, Thermotogales, and taxa within Bacteroidetes, Chloroflexi, Firmicutes, and Proteobacteria) were only present in OTUs that were unique for one of the cores.
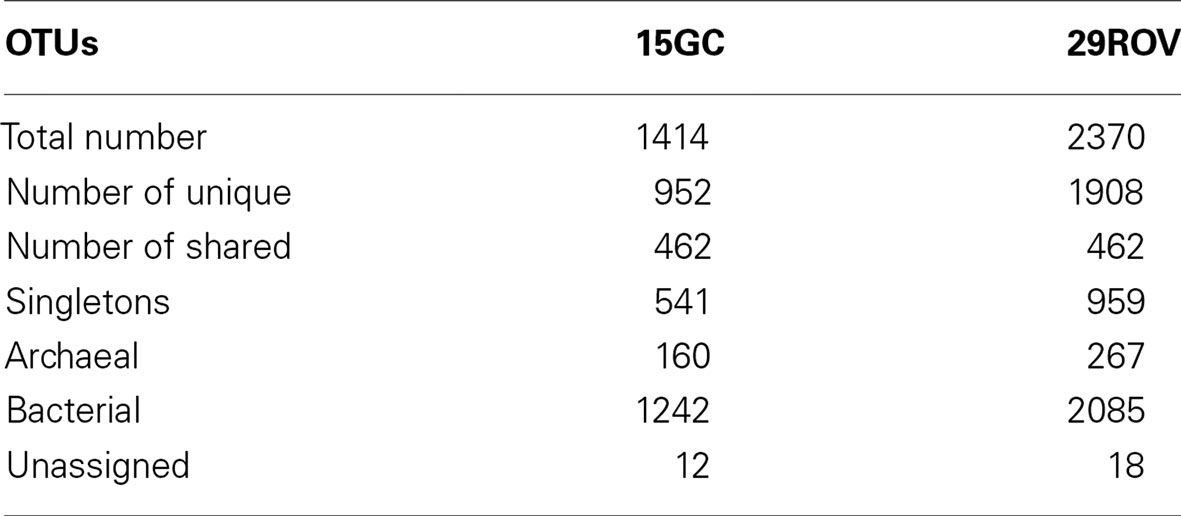
Table 2. Distribution of OTUs in 15GC and 29ROV.
The uncultured ANME clade, with sequences affiliated with the ANME-1, ANME-2a/b, and ANME-2c subgroups, were the most dominating taxa in both 15GC and 29ROV. To study the distribution of ANME at the two sampling sites in more detail, the OTUs assigned to all ANME subgroups were extracted from the dataset. A total of 65180 reads from 15GC and 30273 reads from 29ROV grouped into 34 OTUs. Of these, 19 OTUs were excluded as they were based on single sequences. Hence, 14 and 7 sequences were removed from the 15GC and 29ROV dataset, respectively. The remaining 15 OTUs had the following distribution among the ANME clades: ANME-1 (4), ANME-2a/b (6), and ANME-2c (5).
In horizons dominated by ANME, meaning horizons below 4–5 cm for 29ROV and 120 cm for 15GC, the majority of the sequences assigned to ANME-1 were present in one OTU (OTU_542; Figure 5), comprising 80.0–98.5% of the reads in 29ROV and 72.8–100% in 15GC (Table S1 in Supplementary Material). The remaining ANME-1 sequences were present in two additional OTUs, which also included sequences from the shallow horizons above the ANME-dominated zone in both cores. The ANME-2a/b affiliated sequences were mainly distributed in two dominating OTUs (Figure 5), one specific OTU for each core. OTU_442 comprised between 78.6 and 99.9% of ANME-2a/b sequences in 15GC, while OTU_50 constituted 54.5–95.2% of the sequences in 29ROV (0–10 cmbsf). Furthermore, some ANME-2a/b sequences from the ANME-1 dominated horizons in 29ROV were also assigned OTU_442. Although the abundance of ANME-2c was considerably higher in 29ROV than 15GC, the majority of the reads were clustered into two common OTUs (OTU_168 and OTU_1280; Figure 5). In addition, a substantial number of reads from 29ROV were assigned to OTU_1800, which was unique for this core.
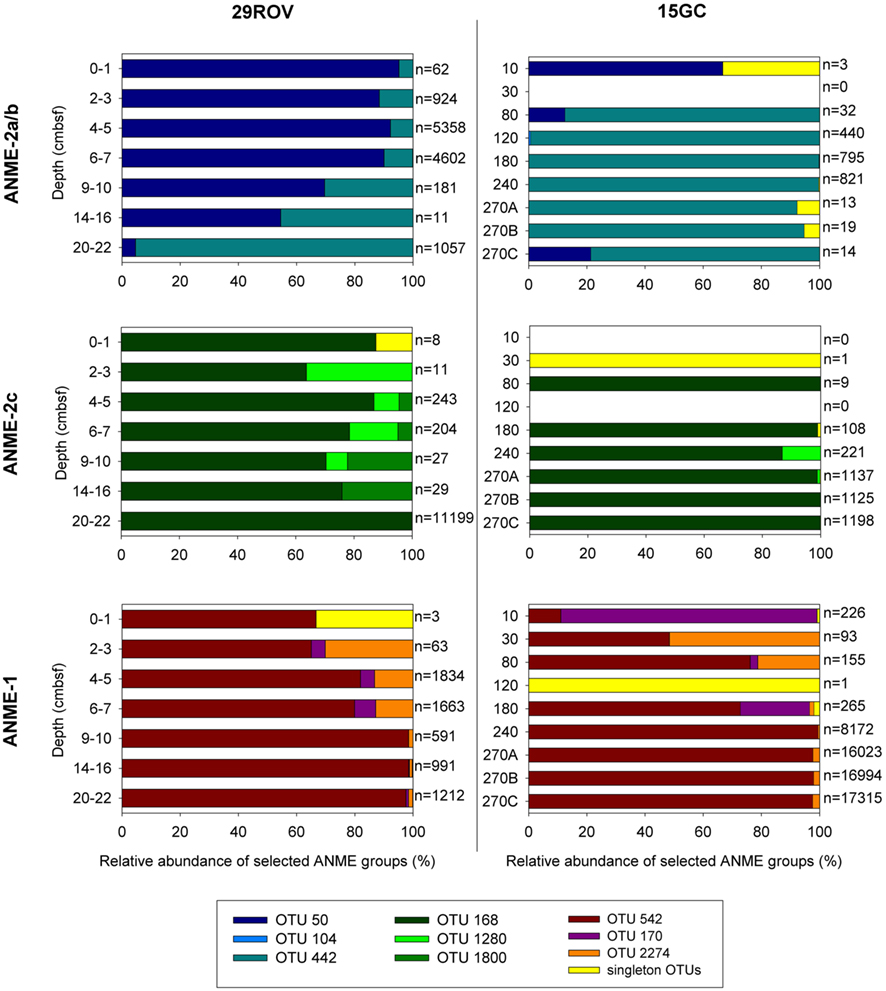
Figure 5. Anaerobic methanotrophs (ANME)-affiliated sequences from the 15GC and 29ROV amplicon libraries were clustered into OTUs (97% cut-off). The relative distribution of different OTUs affiliated to either ANME-2a/b, ANME-2c, or ANME-1 within each sediment horizon is shown in separate graphs for 15GC and 29ROV. The numbers listed beside each bar indicates the total number of reads assigned to each of the three ANME subgroups. This number is summed to 100% and displayed on the x-axis. All OTUs represented by only one sequence are pooled and presented in the category “singleton OTUs.” The subsample 270 cmbsf from 15GC was analyzed in triplicates, hence the marking A, B, and C on the y-axis.
Discussion
Methane Flux and Stratification of Methanotrophs
The Nyegga area is characterized by numerous pockmarks and methane seepage structures in different developmental stages indicating a dynamic, temporal, and spatial system where different geochemical settings may influence the microbial community structure. In this study, 454-pyrosequencing of 16S rRNA gene tagged amplicons were used to compare the microbial stratification in a gravity core (15GC) from the less active CN03 area with that in a push core (29ROV) from the active seepage structure G11 pockmark. The CN03 area is characterized by micro-seepage of methane, few pockmarks, a SMTZ located at ∼200–250 cmbsf and a BSR at 250–300 mbsf. The G11 pockmark in comparison, is characterized by shallow gas hydrates and SMTZ, authigenic carbonates, and pingo structures within the pockmark. The higher methane flux sustains macro-fauna and bacterial mats (Hovland and Svensen, 2006; Chen et al., 2010; Ivanov et al., 2010). The methane fluid flux was ∼80 mmol/m2 year for 15GC and 300–540 mmol/m2 year for 29ROV (Chen et al., 2010). The methane flux in the CN03 area is within the same range as other seep areas where ANME have been found to be abundant, such as the Santa Barbara Basin (164–200 mmol/m2 year; Harrison et al., 2009) and Gulf of Mexico (20–200 mmol/m2 year; Coffin et al., 2008; Lloyd et al., 2010). In 29ROV, the flux is apparently so high that methane reaches the sediment surface where it stimulates a dominance of aerobic methanotrophic Gammaproteobacteria (Roalkvam et al., 2011). In 15GC, aerobic methanotrophic Gammaproteobacteria were not identified, indicating that the methane seeping through the sediments were consumed by ANME which were increasingly dominating the amplicon libraries from 120 cmbsf and below (Figure 3). A dominance of ANME in deeper horizons was also observed in 29ROV, however, the ANME-dominated sediment horizons extended over a wider depth interval in 15GC. Furthermore, similar relative abundances and equivalent transitions between ANME-2a/b and ANME-1 with increasing depth (Figure 3B) were observed in both 29ROV and 15GC cores. However, the proportion of ANME-2c seemed to differ between the cores as 60% of all reads were assigned to ANME-2c in 29ROV, whereas only 5.7% of all reads were assigned to this taxonomic group in 15GC. It is possible that the observed difference in ANME-2c abundances is an effect of the much wider methane gradient in 15GC and that ANME-2c at this sampling site are fond in higher numbers in horizons deeper than 270 cmbsf, and thus not detected in our study.
The methane flux seems to have little effect on the stratification of the ANME groups 2a/b, 1, and 2c in the Nyegga field, as a similar stratification of these clades was found in both the 29ROV (Roalkvam et al., 2011) and 15GC locations (Figure 3B). This suggests that shifts in ANME clades through the cores are determined by other factors than methane availability. Moreover, both cores are dominated by the same OTUs of ANME-1 and ANME-2c, indicating that organisms potentially adapted to different methane fluxes cannot be distinguished on the OTU level within these clades. On the other hand, differences in methane flux may partly explain why different OTUs of ANME-2a/b dominate in the cores. The methane flux seems to largely influence the specific density of ANME in the cores as the number of archaeal 16S rRNA genes per gram of sediment in the ANME-dominated horizons was observed to be two orders of magnitude lower in 15GC (Figure 2) than in 29ROV (Roalkvam et al., 2011). This is congruent with previous studies of sediments with variations in methane flux and depth of the SMTZ where ANME comprise up to 3 × 10⁹ cells/cm3 sediment in marine sediments with shallow gas hydrates, such as Gulf of Mexico (Orcutt et al., 2008), Hydrate Ridge (Knittel et al., 2005), and Eckernförde Bay (Treude et al., 2005a), whereas in low methane seepage areas with deeper gas hydrates, such as Santa Barbara and Peru Margin, ANME are rare or absent (Biddle et al., 2006; Inagaki et al., 2006; Harrison et al., 2009).
Both in the sediments from the G11 pockmark and in 15GC, ANME-2a/b was found to dominate in horizons with lower concentrations of sulfide compared to the ANME-1 dominated horizons. These results are in accordance with previous studies suggesting that ANME-2 is sensitive to H2S produced during AOM with sulfate (Meulepas et al., 2009a,b). Furthermore, the abundance of ANME-2a/b was found to be negatively correlated with high methane and sulfide concentrations in Guaymas Basin sediments, whereas an opposite correlation was found for ANME-1 (Biddle et al., 2011). Also, a zonation of ANME-2 communities in areas with efficient H2S removal and ANME-1 in zones with higher concentrations of H2S was observed in multilayered microbial mats in the Black Sea (Krüger et al., 2008). Due to the higher methane flux in G11 the ANME-2a/b population is exposed to methane-rich fluids whereas in CN03, the dominating ANME-2a/b is found in horizons with low methane concentrations of 0.035–0.13 mmol/L. However, the piping structures and shell fragments in these horizons shows that the methane concentration has probably been higher in earlier times, indicating that the ANME-2a/b population could have been established in a methane-enriched environment in the past and that the ANME-2a/b population present in 15GC now is sustained by lower methane concentrations. Given the ability to survive in methane depleted environments, ANME-2a/b could be the seed population in new methane-enriched systems, as suggested by Knittel and Boetius (2009). Thus, in order to fully understand the stratification and dynamics of ANME communities at Nyegga, more knowledge on temporal variations in the microbial community structures might be needed.
Syntrophic Partners of ANME
The AOM with sulfate has in previous studies been shown to be performed by ANME in syntrophy with sulfate-reducing Deltaproteobacteria, where ANME-1 and ANME-2 are mainly associated with sulfate-reducers within Desulfosarcina and Desulfococcus (DSS; Knittel et al., 2005; Schreiber et al., 2010), while ANME-3 are associated with sulfate-reducers within Desulfobulbus (DBB; Niemann et al., 2006; Lösekann et al., 2007). The share of Deltaproteobacteria in horizons with the highest relative abundance of ANME-2a/b was ranging between 9.0 and 9.1% in 29ROV (Roalkvam et al., 2011), but was below 0.7% in 15GC (Figure 3A) of which most sequences were assigned to a clade that is not assumed to be a syntrophic partner of ANME (Table S1 in Supplementary Material). From the low-abundance of detected Deltaproteobacteria, it was not obvious to us which of the detected organisms that acted as a sulfate-reducing syntrophic partner for ANME-2a/b, at least not in 15GC. One possibility is that the abundance of Deltaproteobacteria is underestimated due to bias in the PCR amplification of 16S rRNA genes. Another possibility is that other organisms than Deltaproteobacteria act as the sulfate-reducing syntrophic partner for the ANME-2a/b detected in the Nyegga field. JS-1 was present in all ANME-2 dominated horizons in 15GC, but was even more dominating in other sediment horizons, indicating no obligate relationship with ANME. The JS-1 group is ubiquitous in marine sediments, at depths ranging from <10 to >200 mbsf (Rochelle et al., 1994; Inagaki et al., 2006; Parkes et al., 2007; Webster et al., 2007). Inagaki et al. (2006) hypothesized that JS-1 could be adapted to anaerobic conditions in organic-rich sediments associated with methane hydrates, which is similar to the environment at Nyegga. Further indications of JS-1 being a heterotrophic sulfate-reducing bacterium are based on enrichment cultures where sulfate was depleted in wells with acetate (Webster et al., 2011). In 29ROV, the abundance of JS-1 throughout the core was correlated to the abundance of ANME-2 (Roalkvam et al., 2011), and ANME-2 may benefit from the activity of JS-1 by transfer of reducing equivalents derived though AOM to JS-1. Although, detailed knowledge on the energy metabolism of JS-1 is needed to assess any syntrophic relationship between ANME-2 and JS-1. However, our results might imply that ANME-2a/b can be adapted to perform AOM with Deltaproteobacteria as a sulfate-reducing partner in systems with high methane concentrations (Boetius et al., 2000; Orphan et al., 2001; Knittel et al., 2005), such as 29ROV. Finally, it should be kept in mind that ANME-2a/b possibly live in syntrophy with organisms reducing other electron acceptors than sulfate. Previous work, has demonstrated that also Fe, Mn, or may be used as electron acceptors in AOM (Raghoebarsing et al., 2006; Ettwig et al., 2008; Beal et al., 2009) which will provide a higher energy yield than the use of sulfate (Boetius et al., 2000; Nauhaus et al., 2002; Caldwell et al., 2008). Linking AOM either in syntrophy or by a free-living lifestyle to such electron acceptor may thus sustain a life in low methane concentrations. However, it has been argued that the key enzyme Methyl-CoM reductase in the reverse methanogenesis pathway will not catalyze the reduction of Fe and Mn due to the inactivation of the enzyme caused by the highly positive redox-potential for these electron acceptors (Shima and Thauer, 2005; Thauer and Shima, 2008).
Recently, the in situ metabolism of the free-living ANME-1 enriched horizon in 29ROV was studied by using a coupled metagenomic and metaproteomic approach (Stokke et al., 2012). All enzymes in the reverse methanogenesis pathway (except N5, N10-methylene tetrahydromethanopterin reductase) and corresponding electron accepting complexes were found expressed by ANME-1. Furthermore, the key enzymes for dissimilatory sulfate reduction were found to be expressed in the environment by Deltaproteobacteria, and in addition, an APS-reductase affiliated with previously unknown ANME-partners was identified. From this we deduce the hypothesis that AOM is performed by the ANME-1 population in G11 and CN03, independent of a closely associated sulfate-reducing partner.
Community Structures in Shallow Sediment Horizons
The total organic carbon (TOC) content in Nyegga sediments is 0.55–0.74% in G11 pockmark and 0.40–0.54% at CN03 area (Ivanov et al., 2010), which corresponds well with the average TOC values (∼0.5–1%) for the region (Hölemann and Henrich, 1994). In sedimentary environments, the organic matter buried over geological timescales is utilized as an energy source by organotrophs (Kujawinski, 2011; Orcutt et al., 2011). Through microbial remineralization, degradation products are formed which can be utilized by diverse heterotrophic taxa. The microbial distribution in 15GC showed a high abundance of taxa that generally occurs in high numbers in marine sediments, such as Planctomycetes, Chloroflexi, Bacteroidetes, JS-1, MBG-B/DSAG, MG-1, MCG, and MBG-D (Figure 3A; Reed et al., 2002; Inagaki et al., 2006; Harrison et al., 2009; Blazejak and Schippers, 2010). In 15GC, Archaea outnumbered Bacteria in all horizons (Figure 2) with a clear stratification of the archaeal phyla (Figure 3A). The MG-1 predominated in horizons probably depleted in oxygen at 10–120 cmbsf. Cultivated representatives of MG-1 have been shown to perform aerobic ammonium oxidation (Hallam et al., 2006; Nicol and Schleper, 2006; Walker et al., 2010). Ammonium, potentially derived from the degradation of nitrogen-containing organic matter, could support the population of MG-1 in 15GC and may possibly be oxidized anaerobically. The MG-1 is a diverse clade with several subgroups that are not well characterized (Durbin and Teske, 2010), and the MG-1 could possibility have a wider range of useful metabolisms in this environment. Within the Archaea, the DSAG is predominant in several marine environments, such as deep sea sediments (Vetriani et al., 1999; Fry et al., 2008; Wang et al., 2010), sediments overlaying shallow gas hydrates (Inagaki et al., 2006) and within the SMTZ at Santa Barbara Basin (Harrison et al., 2009) and Peru Margin (Sørensen and Teske, 2006). In 15GC, DSAG was uniformly distributed in horizons between 10 and 240 cmbsf where the concentration of methane is low, but was outcompeted by ANME-1 at 270 cmbsf where the concentration of methane is higher. Hence, DSAG may rather perform organotrophic sulfate reduction as suggested by Biddle et al. (2006) and Inagaki et al. (2006) than consumption of methane in 15GC. This is also supported by the low-abundance of DSAG in 29ROV, where the horizons are exposed to methane-rich fluids.
The higher methane flux in the G11 pockmark apparently also influenced the absolute numbers of microorganisms, with two to three orders of magnitude higher number of 16S rRNA gene copies per gram of sediment compared to the CN03 area. Hence, even though taxa such as Planctomycetes, Chloroflexi JS-1, MG-1, and DSAG were present with abundances between <1 and 10% in 29ROV, their absolute numbers are in the same order of magnitude as in the 15GC core as the total cell number in these horizons were two to three order of magnitudes higher than in the 15GC. This indicates that both sampling sites have equivalent amounts of microorganisms potentially involved in degradation of organic matter, which is consistent with the relatively even distribution of organic matter in Nyegga sediments (Hölemann and Henrich, 1994; Ivanov et al., 2010).
Conclusion
In conclusion, our results show that ANME dominate in Nyegga cold seeps, both in the micro-seeping CN03 area and the highly active G11 pockmark. An equivalent stratification of ANME clades was observed at both sampling sites, indicating that the vertical distribution of ANME is influenced by increasing sulfide concentration in the sediments or other factors rather than the methane fluid flux. Furthermore, a fine-scale view into the ANME communities at each location was achieved through OTU clustering of ANME-affiliated sequences from the amplicon libraries, revealing a common OTU of ANME-1, and unique OTUs of ANME-2a/b at the sampling sites. Based on our results we suggest that free-living ANME-1 is the most abundant taxon, and also the main consumer of methane in Nyegga cold seeps which can reduce the methane emission to the atmosphere from sources within the sediments. The specific ANME-2a/b OTUs could reflect adaptations to the geochemical composition at each location, with different affinities to methane. The ability to survive in marine systems depleted in methane could also be advantageous for potential seed populations.
Acknowledgments
This work was supported by VISTA (Norwegian Academy of Science and Letters, and Statoil, project 6501) and the Research Council of Norway through Centre for Geobiology. We acknowledge the captain John Hugo Johansen and the crew on the R/V G.O. Sars and the ROV pilots from ARGUS Remote Systems as for all support during the cruise to the Nyegga pockmark field in 2008. This paper is a contribution to the Norwegian Research Council PETROMAKS project “Gas Hydrates on the Norwegian-Barents Sea-Svalbard Margin” (GANS, Norwegian Research Council project no. 175969/S30). Furthermore, we thank the Norwegian Deepwater Programme Seabed III for the financial support for collecting the cores. We acknowledge Frida Lise Daae at Department of Biology, Centre for Geobiology, University of Bergen for technical support.
Supplementary Material
The Supplementary Material for this article can be found online at http://www.frontiersin.org/Extreme_Microbiology/10.3389/fmicb.2012.00216/abstract
References
Amann, R. I., Ludwig, W., and Schleifer, K. H. (1995). Phylogenetic identification and in situ detection of individual microbial cells without cultivation. Microbiol. Rev. 59, 143–169.
Beal, E. J., House, C. H., and Orphan, V. J. (2009). Manganese- and iron-dependent marine methane oxidation. Science 325, 184–187.
Berelson, W. M., Prokopenko, M., Sansone, F. J., Graham, A. W., Mcmanus, J., and Bernhard, J. M. (2005). Anaerobic diagenesis of silica and carbon in continental margin sediments: discrete zones of TCO2 production. Geochim. Cosmochim. Acta 69, 4611–4629.
Biddle, J. F., Cardman, Z., Mendlovitz, H., Albert, D. B., Lloyd, K. G., Boetius, A., and Teske, A. (2011). Anaerobic oxidation of methane at different temperature regimes in Guaymas Basin hydrothermal sediments. ISME J. 6, 1018–1031.
Biddle, J. F., Lipp, J. S., Lever, M. A., Lloyd, K. G., Sørensen, K. B., Anderson, R., Fredricks, H. F., Elvert, M., Kelly, T. J., Schrag, D. P., Sogin, M. L., Brenchley, J. E., Teske, A., House, C. H., and Hinrichs, K. U. (2006). Heterotrophic archaea dominate sedimentary subsurface ecosystems off Peru. Proc. Natl. Acad. Sci. U.S.A. 103, 3846–3851.
Blazejak, A., and Schippers, A. (2010). High abundance of JS-1- and Chloroflexi-related bacteria in deeply buried marine sediments revealed by quantitative, real-time PCR. FEMS Microbiol. Ecol. 72, 198–207.
Boetius, A., Ravenschlag, K., Schubert, C. J., Rickert, D., Widdel, F., Gieseke, A., Amann, R., Jørgensen, B. B., Witte, U., and Pfannkuche, O. (2000). A marine microbial consortium apparently mediating anaerobic oxidation of methane. Nature 407, 623–626.
Borowski, W. S., Paull, C. K., and Ussler Iii, W. (1996). Marine pore-water sulfate profiles indicate in situ methane flux from underlying gas hydrate. Geology 24, 655–658.
Bünz, S., Mienert, J., and Berndt, C. (2003). Geological controls on the Storegga gas-hydrate system of the mid-Norwegian continental margin. Earth Planet. Sci. Lett. 209, 291–307.
Caldwell, S. L., Laidler, J. R., Brewer, E. A., Eberly, J. O., Sandborgh, S. C., and Colwell, F. S. (2008). Anaerobic oxidation of methane: mechanisms, bioenergetics, and the ecology of associated microorganisms. Environ. Sci. Technol. 42, 6791–6799.
Chen, Y., Bian, Y., Haflidason, H., and Matsumoto, R. (2011). “Present and past methane seepage in pockmark CN03, Nyegga, offshore mid-Norway,” in Proceedings of the 7th International Conference on Gas Hydrates, Edinburgh.
Chen, Y., Ussler Iii, W., Haflidason, H., Lepland, A., Rise, L., Hovland, M., and Hjelstuen, B. O. (2010). Sources of methane inferred from pore-water δ13C of dissolved inorganic carbon in pockmark G11, offshore Mid-Norway. Chem. Geol. 275, 127–138.
Coffin, R., Hamdan, L., Plummer, R., Smith, J., Gardner, J., Hagen, R., and Wood, W. (2008). Analysis of methane and sulfate flux in methane-charged sediments from the Mississippi Canyon, Gulf of Mexico. Mar. Petrol. Geol. 25, 977–987.
D’Hondt, S., Jørgensen, B. B., Miller, D. J., Batzke, A., Blake, R., Cragg, B. A., Cypionka, H., Dickens, G. R., Ferdelman, T., Hinrichs, K. U., Holm, N. G., Mitterer, R., Spivack, A., Wang, G., Bekins, B., Engelen, B., Ford, K., Gettemy, G., Rutherford, S. D., Sass, H., Skilbeck, C. G., Aiello, I. W., Guerin, G., House, C. H., Inagaki, F., Meister, P., Naehr, T., Niitsuma, S., Parkes, R. J., Schippers, A., Smith, D. C., Teske, A., Wiegel, J., Padilla, C. N., and Acosta, J. L. (2004). Distributions of microbial activities in deep subseafloor sediments. Science 306, 2216–2221.
Durbin, A. M., and Teske, A. (2010). Sediment-associated microdiversity within the marine group I Crenarchaeota. Environ. Microbiol. Rep. 2, 693–703.
Einen, J., Thorseth, I. H., and Ovreas, L. (2008). Enumeration of archaea and bacteria in seafloor basalt using real-time quantitative PCR and fluorescence microscopy. FEMS Microbiol. Lett. 282, 182–187.
Ettwig, K. F., Shima, S., Van De Pas-Schoonen, K. T., Kahnt, J., Medema, M. H., Op Den Camp, H. J., Jetten, M. S., and Strous, M. (2008). Denitrifying bacteria anaerobically oxidize methane in the absence of archaea. Environ. Microbiol. 10, 3164–3173.
Evans, D., King, E. L., Kenyon, N. H., Brett, C., and Wallis, D. (1996). Evidence for long-term instability in the Storegga Slide region off western Norway. Mar. Geol. 130, 281–292.
Fry, J. C., Parkes, R. J., Cragg, B. A., Weightman, A. J., and Webster, G. (2008). Prokaryotic biodiversity and activity in the deep subseafloor biosphere. FEMS Microbiol. Ecol. 66, 181–196.
Hallam, S. J., Konstantinidis, K. T., Putnam, N., Schleper, C., Watanabe, Y., Sugahara, J., Preston, C., De La Torre, J., Richardson, P. M., and Delong, E. F. (2006). Genomic analysis of the uncultivated marine crenarchaeote Cenarchaeum symbiosum. Proc. Natl. Acad. Sci. U.S.A. 103, 18296–18301.
Hamady, M., Walker, J. J., Harris, J. K., Gold, N. J., and Knight, R. (2008). Error-correcting barcoded primers for pyrosequencing hundreds of samples in multiplex. Nat. Methods 5, 235–237.
Harrison, B. K., Zhang, H., Berelson, W., and Orphan, V. J. (2009). Variations in archaeal and bacterial diversity associated with the sulfate-methane transition zone in continental margin sediments (Santa Barbara Basin, California). Appl. Environ. Microbiol. 75, 1487–1499.
Hjelstuen, B. O., Haflidason, H., Sejrup, H. P., and Nygard, A. (2010). Sedimentary and structural control on pockmark development-evidence from the Nyegga pockmark field, NW European margin. Geo Mar. Lett. 30, 221–230.
Hölemann, J. A., and Henrich, R. (1994). Allochthonous versus autochthonous organic matter in Cenozoic sediments of the Norwegian Sea – evidence for the onset of glaciations in the northern hemisphere. Mar. Geol. 121, 87–103.
Hovland, M., and Svensen, H. (2006). Submarine pingoes: indicators of shallow gas hydrates in a pockmark at Nyegga, Norwegian Sea. Mar. Geol. 228, 15–23.
Hovland, M., Svensen, H., Forsberg, C. F., Johansen, H., Fichler, C., Fossa, J. H., Jonsson, R., and Rueslatten, H. (2005). Complex pockmarks with carbonate-ridges off mid-Norway: products of sediment degassing. Mar. Geol. 218, 191–206.
Huber, J. A., Mark Welch, D. B., Morrison, H. G., Huse, S. M., Neal, P. R., Butterfield, D. A., and Sogin, M. L. (2007). Microbial population structures in the deep marine biosphere. Science 318, 97–100.
Huson, D. H., Auch, A. F., Qi, J., and Schuster, S. C. (2007). MEGAN analysis of metagenomic data. Genome Res. 17, 377–386.
Hustoft, S., Bünz, S., and Mienert, J. (2010). Three-dimensional seismic analysis of the morphology and spatial distribution of chimneys beneath the Nyegga pockmark field, offshore mid-Norway. Basin Res. 22, 465–480.
Hustoft, S., Dugan, B., and Mienert, J. (2009). Effects of rapid sedimentation on developing the Nyegga pockmark field: constraints from hydrological modeling and 3-D seismic data, offshore mid-Norway. Geochem. Geophys. Geosyst. 10, Q06012. doi:10.1029/2009GC002409
Hustoft, S., Mienert, J., Bünz, S., and Nouze, H. (2007). High-resolution 3D-seismic data indicate focussed fluid migration pathways above polygonal fault systems of the mid-Norwegian margin. Mar. Geol. 245, 89–106.
Inagaki, F., Nunoura, T., Nakagawa, S., Teske, A., Lever, M., Lauer, A., Suzuki, M., Takai, K., Delwiche, M., Colwell, F. S., Nealson, K. H., Horikoshi, K., D’Hondt, S., and Jørgensen, B. B. (2006). Biogeographical distribution and diversity of microbes in methane hydrate-bearing deep marine sediments on the Pacific Ocean Margin. Proc. Natl. Acad. Sci. U.S.A. 103, 2815–2820.
Ivanov, M., Mazzini, A., Blinova, V., Kozlova, E., Laberg, J. S., Matveeva, T., Taviani, M., and Kaskov, N. (2010). Seep mounds on the Southern Vøring Plateau (offshore Norway). Mar. Petrol. Geol. 27, 1235–1261.
Knittel, K., and Boetius, A. (2009). Anaerobic oxidation of methane: progress with an unknown process. Annu. Rev. Microbiol. 63, 311–334.
Knittel, K., Lösekann, T., Boetius, A., Kort, R., and Amann, R. (2005). Diversity and distribution of methanotrophic archaea at cold seeps. Appl. Environ. Microbiol. 71, 467–479.
Krom, M. D., and Berner, R. A. (1980). The diffusion-coefficients of sulfate, ammonium, and phosphate ions in anoxic marine sediments. Limnol. Oceanogr. 25, 327–337.
Krüger, M., Blumenberg, M., Kasten, S., Wieland, A., Känel, L., Klock, J. H., Michaelis, W., and Seifert, R. (2008). A novel, multi-layered methanotrophic microbial mat system growing on the sediment of the Black Sea. Environ. Microbiol. 10, 1934–1947.
Kujawinski, E. B. (2011). The impact of microbial metabolism on marine dissolved organic matter. Ann. Rev. Mar. Sci. 3, 567–599.
Lane, D. J., Pace, B., Olsen, G. J., Stahl, D. A., Sogin, M. L., and Pace, N. R. (1985). Rapid determination of 16S ribosomal RNA sequences for phylogenetic analyses. Proc. Natl. Acad. Sci. U.S.A. 82, 6955–6959.
Lanzén, A., Jørgensen, S. L., Bengtsson, M. M., Jonassen, I., Øvreås, L., and Urich, T. (2011). Exploring the composition and diversity of microbial communities at the Jan Mayen hydrothermal vent field using RNA and DNA. FEMS Microbiol. Ecol. 77, 577–589.
Lloyd, K. G., Albert, D. B., Biddle, J. F., Chanton, J. P., Pizarro, O., and Teske, A. (2010). Spatial structure and activity of sedimentary microbial communities underlying a Beggiatoa spp. mat in a Gulf of Mexico hydrocarbon seep. PLoS ONE 5, e8738. doi:10.1371/journal.pone.0008738
Lloyd, K. G., Lapham, L., and Teske, A. (2006). An anaerobic methane-oxidizing community of ANME-1b archaea in hypersaline Gulf of Mexico sediments. Appl. Environ. Microbiol. 72, 7218–7230.
Lösekann, T., Knittel, K., Nadalig, T., Fuchs, B., Niemann, H., Boetius, A., and Amann, R. (2007). Diversity and abundance of aerobic and anaerobic methane oxidizers at the Haakon Mosby Mud Volcano, Barents Sea. Appl. Environ. Microbiol. 73, 3348–3362.
Mazzini, A., Svensen, H., Hovland, M., and Planke, S. (2006). Comparison and implications from strikingly different authigenic carbonates in a Nyegga complex pockmark, G11, Norwegian Sea. Mar. Geol. 231, 89–102.
Meulepas, R. J., Jagersma, C. G., Khadem, A. F., Buisman, C. J., Stams, A. J., and Lens, P. N. (2009a). Effect of environmental conditions on sulfate reduction with methane as electron donor by an Eckernförde Bay enrichment. Environ. Sci. Technol. 43, 6553–6559.
Meulepas, R. J. W., Jagersma, C. G., Gieteling, J., Buisman, C. J. N., Stams, A. J. M., and Lens, P. N. L. (2009b). Enrichment of anaerobic methanotrophs in sulfate-reducing membrane bioreactors. Biotechnol. Bioeng. 104, 458–470.
Muyzer, G., De Waal, E. C., and Uitterlinden, A. G. (1993). Profiling of complex microbial populations by denaturing gradient gel electrophoresis analysis of polymerase chain reaction-amplified genes coding for 16S rRNA. Appl. Environ. Microbiol. 59, 695–700.
Muyzer, G., Teske, A., Wirsen, C. O., and Jannasch, H. W. (1995). Phylogenetic relationships of Thiomicrospira species and their identification in deep-sea hydrothermal vent samples by denaturing gradient gel electrophoresis of 16S rDNA fragments. Arch. Microbiol. 164, 165–172.
Nauhaus, K., Boetius, A., Kruger, M., and Widdel, F. (2002). In vitro demonstration of anaerobic oxidation of methane coupled to sulphate reduction in sediment from a marine gas hydrate area. Environ. Microbiol. 4, 296–305.
Needleman, S. B., and Wunsch, C. D. (1970). A general method applicable to the search for similarities in the amino acid sequence of two proteins. J. Mol. Biol. 48, 443–453.
Nicol, G. W., and Schleper, C. (2006). Ammonia-oxidising Crenarchaeota: important players in the nitrogen cycle? Trends Microbiol. 14, 207–212.
Niemann, H., Lösekann, T., De Beer, D., Elvert, M., Nadalig, T., Knittel, K., Amann, R., Sauter, E. J., Schluter, M., Klages, M., Foucher, J. P., and Boetius, A. (2006). Novel microbial communities of the Haakon Mosby mud volcano and their role as a methane sink. Nature 443, 854–858.
Orcutt, B., Samarkin, V., Boetius, A., and Joye, S. (2008). On the relationship between methane production and oxidation by anaerobic methanotrophic communities from cold seeps of the Gulf of Mexico. Environ. Microbiol. 10, 1108–1117.
Orcutt, B. N., Sylvan, J. B., Knab, N. J., and Edwards, K. J. (2011). Microbial ecology of the dark ocean above, at, and below the seafloor. Microbiol. Mol. Biol. Rev. 75, 361–422.
Orphan, V. J., Hinrichs, K. U., Ussler, W., Iii Paull, C. K., Taylor, L. T., Sylva, S. P., Hayes, J. M., and Delong, E. F. (2001). Comparative analysis of methane-oxidizing archaea and sulfate-reducing bacteria in anoxic marine sediments. Appl. Environ. Microbiol. 67, 1922–1934.
Ovreas, L., Forney, L., Daae, F. L., and Torsvik, V. (1997). Distribution of bacterioplankton in meromictic Lake Saelenvannet, as determined by denaturing gradient gel electrophoresis of PCR-amplified gene fragments coding for 16S rRNA. Appl. Environ. Microbiol. 63, 3367–3373.
Parameswaran, P., Jalili, R., Tao, L., Shokralla, S., Gharizadeh, B., Ronaghi, M., and Fire, A. Z. (2007). A pyrosequencing-tailored nucleotide barcode design unveils opportunities for large-scale sample multiplexing. Nucleic Acids Res. 35, e130.
Parkes, R. J., Cragg, B. A., Banning, N., Brock, F., Webster, G., Fry, J. C., Hornibrook, E., Pancost, R. D., Kelly, S., Knab, N., Jørgensen, B. B., Rinna, J., and Weightman, A. J. (2007). Biogeochemistry and biodiversity of methane cycling in subsurface marine sediments (Skagerrak, Denmark). Environ. Microbiol. 9, 1146–1161.
Plaza-Faverola, A., Bünz, S., and Mienert, J. (2011). Repeated fluid expulsion through sub-seabed chimneys offshore Norway in response to glacial cycles. Earth Planet. Sci. Lett. 305, 297–308.
Plaza-Faverola, A., Westbrook, G. K., Ker, S., Exley, R. J. K., Gailler, A., Minshull, T. A., and Broto, K. (2010). Evidence from three-dimensional seismic tomography for a substantial accumulation of gas hydrate in a fluid-escape chimney in the Nyegga pockmark field, offshore Norway. J. Geophys. Res. Solid Earth 115, 104.
Quince, C., Lanzen, A., Davenport, R. J., and Turnbaugh, P. J. (2011). Removing noise from pyrosequenced amplicons. BMC Bioinformatics 12, 38. doi:10.1186/1471-2105-12-38
Raghoebarsing, A. A., Pol, A., Van De Pas-Schoonen, K. T., Smolders, A. J., Ettwig, K. F., Rijpstra, W. I., Schouten, S., Damste, J. S., Op Den Camp, H. J., Jetten, M. S., and Strous, M. (2006). A microbial consortium couples anaerobic methane oxidation to denitrification. Nature 440, 918–921.
Rao, C. R. (1982). Diversity and dissimilarity coefficients – a unified approach. Theor. Popul. Biol. 21, 24–43.
Reed, D. W., Fujita, Y., Delwiche, M. E., Blackwelder, D. B., Sheridan, P. P., Uchida, T., and Colwell, F. S. (2002). Microbial communities from methane hydrate-bearing deep marine sediments in a forearc basin. Appl. Environ. Microbiol. 68, 3759–3770.
Reiche, S., Hjelstuen, B. O., and Haflidason, H. (2011). High-resolution seismic stratigraphy, sedimentary processes and the origin of seabed cracks and pockmarks at Nyegga, mid-Norwegian margin. Mar. Geol. 284, 28–39.
Roalkvam, I., Jørgensen, S. L., Chen, Y., Stokke, R., Dahle, H., Hocking, W. P., Lanzén, A., Haflidason, H., and Steen, I. H. (2011). New insight into stratification of anaerobic methanotrophs in cold seep sediments. FEMS Microbiol. Ecol. 78, 233–243.
Rochelle, P. A., Cragg, B. A., Fry, J. C., Parkes, R. J., and Weightman, A. J. (1994). Effect of sample handling on estimation of bacterial diversity in marine sediments by 16S rRNA gene sequence analysis. FEMS Microbiol. Ecol. 15, 215–225.
Roesch, L. F., Fulthorpe, R. R., Riva, A., Casella, G., Hadwin, A. K., Kent, A. D., Daroub, S. H., Camargo, F. A., Farmerie, W. G., and Triplett, E. W. (2007). Pyrosequencing enumerates and contrasts soil microbial diversity. ISME J. 1, 283–290.
Schafer, H., Ferdelman, T. G., Fossing, H., and Muyzer, G. (2007). Microbial diversity in deep sediments of the Benguela upwelling system. Aquat. Microb. Ecol. 50, 1–9.
Schreiber, L., Holler, T., Knittel, K., Meyerdierks, A., and Amann, R. (2010). Identification of the dominant sulfate-reducing bacterial partner of anaerobic methanotrophs of the ANME-2 clade. Environ. Microbiol. 12, 2327–2340.
Shima, S., and Thauer, R. K. (2005). Methyl-coenzyme M reductase and the anaerobic oxidation of methane in methanotrophic archaea. Curr. Opin. Microbiol. 8, 643–648.
Sørensen, K. B., and Teske, A. (2006). Stratified communities of active archaea in deep marine subsurface sediments. Appl. Environ. Microbiol. 72, 4596–4603.
Stokke, R., Roalkvam, I., Lanzén, A., Haflidason, H., and Steen, I. H. (2012). Integrated metagenomic and metaproteomic analyses og an ANME-1 dominated community in marine cold seep sediments. Environ. Microbiol. 14, 1333–1346.
Thauer, R. K., and Shima, S. (2008). Methane as fuel for anaerobic microorganisms. Ann. N. Y. Acad. Sci. 1125, 158–170.
Torres, M. E., Mcmanus, J., Hammond, D. E., De Angelis, M. A., Heeschen, K. U., Colbert, S. L., Tryon, M. D., Brown, K. M., and Suess, E. (2002). Fluid and chemical fluxes in and out of sediments hosting methane hydrate deposits on Hydrate Ridge, OR, I: Hydrological provinces. Earth Planet. Sci. Lett. 201, 525–540.
Treude, T., Krüger, M., Boetius, A., and Jørgensen, B. B. (2005a). Environmental control on anaerobic oxidation of methane in the gassy sediments of Eckernförde Bay (German Baltic). Limnol. Oceanogr. 50, 1771–1786.
Treude, T., Niggemann, J., Kallmeyer, J., Wintersteller, P., Schubert, C. J., Boetius, A., and Jørgensen, B. B. (2005b). Anaerobic oxidation of methane and sulfate reduction along the Chilean continental margin. Geochim. Cosmochim. Acta 69, 2767–2779.
Vaular, E. N. (2011). Origin and Character of Gaseous Hydrocarbons in the Hydrate and non-Hydrate Charged Sediments on the Norway-Svalbard Margins. Philosophiae Doctor (Ph.D.), University of Bergen, Bergen.
Vaular, E. N., Barth, T., and Haflidason, H. (2010). The geochemical characteristics of the hydrate-bound gases from the Nyegga pockmark field, Norwegian Sea. Org. Geochem. 41, 437–444.
Vetriani, C., Jannasch, H. W., Macgregor, B. J., Stahl, D. A., and Reysenbach, A. L. (1999). Population structure and phylogenetic characterization of marine benthic archaea in deep-sea sediments. Appl. Environ. Microbiol. 65, 4375–4384.
Walker, C. B., De La Torre, J. R., Klotz, M. G., Urakawa, H., Pinel, N., Arp, D. J., Brochier-Armanet, C., Chain, P. S., Chan, P. P., Gollabgir, A., Hemp, J., Hügler, M., Karr, E. A., Könneke, M., Shin, M., Lawton, T. J., Lowe, T., Martens-Habbena, W., Sayavedra-Soto, L. A., Lang, D., Sievert, S. M., Rosenzweig, A. C., Manning, G., and Stahl, D. A. (2010). Nitrosopumilus maritimus genome reveals unique mechanisms for nitrification and autotrophy in globally distributed marine crenarchaea. Proc. Natl. Acad. Sci. U.S.A. 107, 8818–8823.
Wang, P., Li, T., Hu, A., Wei, Y., Guo, W., Jiao, N., and Zhang, C. (2010). Community structure of archaea from deep-sea sediments of the South China Sea. Microb. Ecol. 60, 796–806.
Weaver, W., and Shannon, C. E. (1949). The Mathematical Theory of Communication. Urbana, IL: University of Illinois.
Webster, G., Sass, H., Cragg, B. A., Gorra, R., Knab, N. J., Green, C. J., Mathes, F., Fry, J. C., Weightman, A. J., and Parkes, R. J. (2011). Enrichment and cultivation of prokaryotes associated with the sulphate-methane transition zone of diffusion-controlled sediments of Aarhus Bay, Denmark, under heterotrophic conditions. FEMS Microbiol. Ecol. 77, 248–263.
Keywords: ANME, pyrosequencing, AOM, community structure, Nyegga, cold seep, stratification
Citation: Roalkvam I, Dahle H, Chen Y, Jørgensen SL, Haflidason H and Steen IH (2012) Fine-scale community structure analysis of ANME in Nyegga sediments with high and low methane flux. Front. Microbio. 3:216. doi: 10.3389/fmicb.2012.00216
Received: 16 February 2012; Accepted: 28 May 2012;
Published online: 15 June 2012.
Edited by:
Peter Dunfield, University of Calgary, CanadaReviewed by:
Peter Dunfield, University of Calgary, CanadaMartin Krüger, Federal Institute for Geosciences and Natural Resources (BGR), Germany
Nils-Kaare Birkeland, University of Bergen, Norway
Craig Lee Moyer, Western Washington University, USA
Jinjun Kan, Stroud Water Research Center, USA
Copyright: © 2012 Roalkvam, Dahle, Chen, Jørgensen, Haflidason and Steen. This is an open-access article distributed under the terms of the Creative Commons Attribution Non Commercial License, which permits non-commercial use, distribution, and reproduction in other forums, provided the original authors and source are credited.
*Correspondence: Ida Helene Steen, Center for Geobiology, Department of Biology, University of Bergen, P.O. Box 7800, N-5020 Bergen, Norway. e-mail: ida.steen@bio.uib.no