Differential axonal projection of mitral and tufted cells in the mouse main olfactory system
- 1 Department of Neurobiology and Anatomy, University of Texas Health Science Center at Houston, Houston, TX, USA
- 2 Department of Neurobiology, Yale University School of Medicine, New Haven, CT, USA
- 3 Chaminade University of Honolulu, Honolulu, HI, USA
- 4 Department of Anatomy and Neurobiology, University of Tennessee Health Science Center, Memphis, TN, USA
- 5 Department of Physiology, Graduate School of Medicine, University of Tokyo, Tokyo, Japan
- 6 Laboratory for Integrative Neural Systems, Unit of Statistical Neuroscience, RIKEN Brain Science Institute, Wako-shi, Japan
In the past decade, much has been elucidated regarding the functional organization of the axonal connection of olfactory sensory neurons to olfactory bulb (OB) glomeruli. However, the manner in which projection neurons of the OB process odorant input and send this information to higher brain centers remains unclear. Here, we report long-range, large-scale tracing of the axonal projection patterns of OB neurons using two-photon microscopy. Tracer injection into a single glomerulus demonstrated widely distributed mitral/tufted cell axonal projections on the lateroventral surface of the mouse brain, including the anterior/posterior piriform cortex (PC) and olfactory tubercle (OT). We noted two distinct groups of labeled axons: PC-orienting axons and OT-orienting axons. Each group occupied distinct parts of the lateral olfactory tract. PC-orienting axons projected axon collaterals to a wide area of the PC but only a few collaterals to the OT. OT-orienting axons densely projected axon collaterals primarily to the anterolateral OT (alOT). Different colored dye injections into the superficial and deep portions of the OB external plexiform layer revealed that the PC-orienting axon populations originated in presumed mitral cells and the OT-orienting axons in presumed tufted cells. These data suggest that although mitral and tufted cells receive similar odor signals from a shared glomerulus, they process the odor information in different ways and send their output to different higher brain centers via the PC and alOT.
Introduction
Olfactory sensation begins with the interaction of odorant ligands and odorant receptor proteins on the cilia of olfactory receptor neurons (ORNs) in the nasal epithelium. In the mouse, one ORN expresses just one type of odorant receptor protein out of a repertoire of approximately 1,000 such receptors (Buck, 1996). ORNs usually send their axons to two glomeruli on the surface of the mouse olfactory bulb (OB), and individual glomeruli receive inputs from ORNs that express a common odorant receptor (Mombaerts, 1999). The stereotypical arrangement of these glomeruli are thought to form odorant receptor maps (Mori et al., 2006). However, it is unclear how this convergent and patterned odor information is sent to higher olfactory brain centers.
In Drosophila, the projection neurons of the antennal lobe (corresponding to the vertebrate OB) show stereotypical axonal branching patterns. Projection neurons that innervate the same glomerulus also project to similar areas in higher brain centers (Marin et al., 2002; Wong et al., 2002; Jefferis et al., 2007; Lin et al., 2007). These results imply that the odor map in higher brain centers conserves the identity of each glomerulus in the antennal lobe for odor processing. In vertebrate zebrafish, OB projection neurons innervating distinct glomerular clusters tend to project axons to different areas with partial overlap, but individual projection neurons innervating the same glomerulus do not necessarily show the same axon trajectory. This suggests that the topographical odor map in the OB does not remain intact, but is reorganized in higher brain centers in vertebrates (Miyasaka et al., 2009).
In mammals, a few studies have examined the axon projection patterns of mitral and tufted cells, the OB projection neurons. Tracing of single mitral cell axon trajectories has revealed their multiple target projections in the anterior part of the olfactory cortex (OC; Ojima et al., 1984). Dense axonal projection by neighboring mitral cells to the same areas in the anterior OC has also been reported (Buonviso et al., 1991). Retrograde tracing experiments have suggested that mitral cells project to all regions of the OC, while tufted cells project to the anterior part of the OC (Haberly and Price, 1977; Skeen and Hall, 1977; Scott et al., 1980). These results have also been supported by electrophysiological studies (Scott, 1981; Schneider and Scott, 1983). However, no report to date has directly compared the axonal projections of mitral and tufted cells.
Despite these efforts, it still remains unclear in mammals how the odorant information that converges in the glomerulus is represented in the next olfactory processing area through the axonal projections of mitral and tufted cells. To address this question, we traced the trajectories of OB neurons associated with a single glomerulus on the ventrolateral surface of the whole brain using two-photon microscopy. Overall projection patterns were found to comprise an overlay of two distinct axon branching patterns, those predominantly to the piriform cortex (PC) and those to the olfactory tubercle (OT). Segregated dual-color labeling was then used to further demonstrate that these two axon groups originate from presumed mitral and tufted cell populations, respectively.
Materials and Methods
All experimental protocols were approved by the University of Texas Medical School at Houston and Yale University Institutional Animal Care and Use Committee in accordance with the National Institutes of Health guidelines. A total of 19 mice (11 OMP-Synapto-pHluorin knock-in mice, Jackson Lab, and 8 C57BL/6, Charles River) were anesthetized with nembutal (i.p. 50 mg/kg body weight). The animals were kept on a heating pad with circulating water set at 40°C. The bone covering the dorsal OB was carefully thinned, and a small opening was made (200–500 μm diameter) for glass pipette penetration. Dextran-conjugated Alexa 488 or Alexa 594 (Invitrogen) was diluted in Ca2+-free Ringer solution (140 mM NaCl, 5 mM KCl, 3 mM MgCl, 0.01 mM EDTA, 10 mM HEPES, and 10 mM glucose, pH 7.5) and used as 10% dye solution. Glomeruli were visualized by two-photon fluorescence imaging of OMP-SpH knock-in mice (Bozza et al., 2004). A dye-filled glass pipette (tip I.D., 2.5 μm) was placed into the target glomerulus under visualization with a two-photon microscope, or into the superficial or deep external plexiform layer (EPL) according to micromanipulator penetration depth (100–150 or 200–250 μm depth, respectively). Small square-wave pulses were delivered via the pipette for dye electroporation (3–5 μA, 25-ms pulse width, 2 Hz, 1200–3600 pulses). The electroporation effective area using this technique has been previously reported to be about 30 μm in diameter (Nagayama et al., 2007), and was effective to label a single glomerulus or superficial/deep EPL in the OB.
Three to 5 days after the dye injection, animals were deeply anesthetized by nembutal injection (i.p. 150 mg/kg) and perfused transcardially with 0.9% NaCl followed by 4% paraformaldehyde in 0.1 M phosphate buffer. Brains were carefully withdrawn from the skull, and the ventrolateral aspect of the whole brain was imaged using a custom-built two-photon microscope system. The imaging system consisted of a mode-locked laser, operating at a 100-fs pulse width, 80-MHz pulse frequency, and 810-nm wavelength (Tsunami Millennia Xs or Mai Tai DeepSee, Spectra Physics), and an Olympus Fluoview scan box mounted on an upright BX50WI microscope. Images were captured with a 10× Olympus water immersion-type objective lens (NA = 0.3). Images were collected at different focus planes with a 10-μm interval. The images were stacked and tiled for enlarged views using Image-J and Photoshop software.
Some brains were post-fixed overnight and sectioned with a vibratome to observe the dye injection site. The 50-μm sections were mounted on glass slides using mounting medium that included DAPI (Vectashield, VECTOR), and images were captured using an Olympus microscope with a CCD camera (Sensicam). In total, single-glomerulus dye injections were carried out in six brain hemispheres, and six superficial/deep EPL dye injection samples were used in this study for data analysis.
Results
Axon Projection Pattern from a Single Glomerulus
To determine how neurons projecting from the same glomerulus transmit odor information to higher brain centers, those neurons were labeled with a local dye electroporation method (Nagayama et al., 2007). The relationship between the dye-filled pipette and the target glomerulus, which expressed Synapto-pHluorin protein, was monitored using two-photon microscopy (Figure 1A, inset).
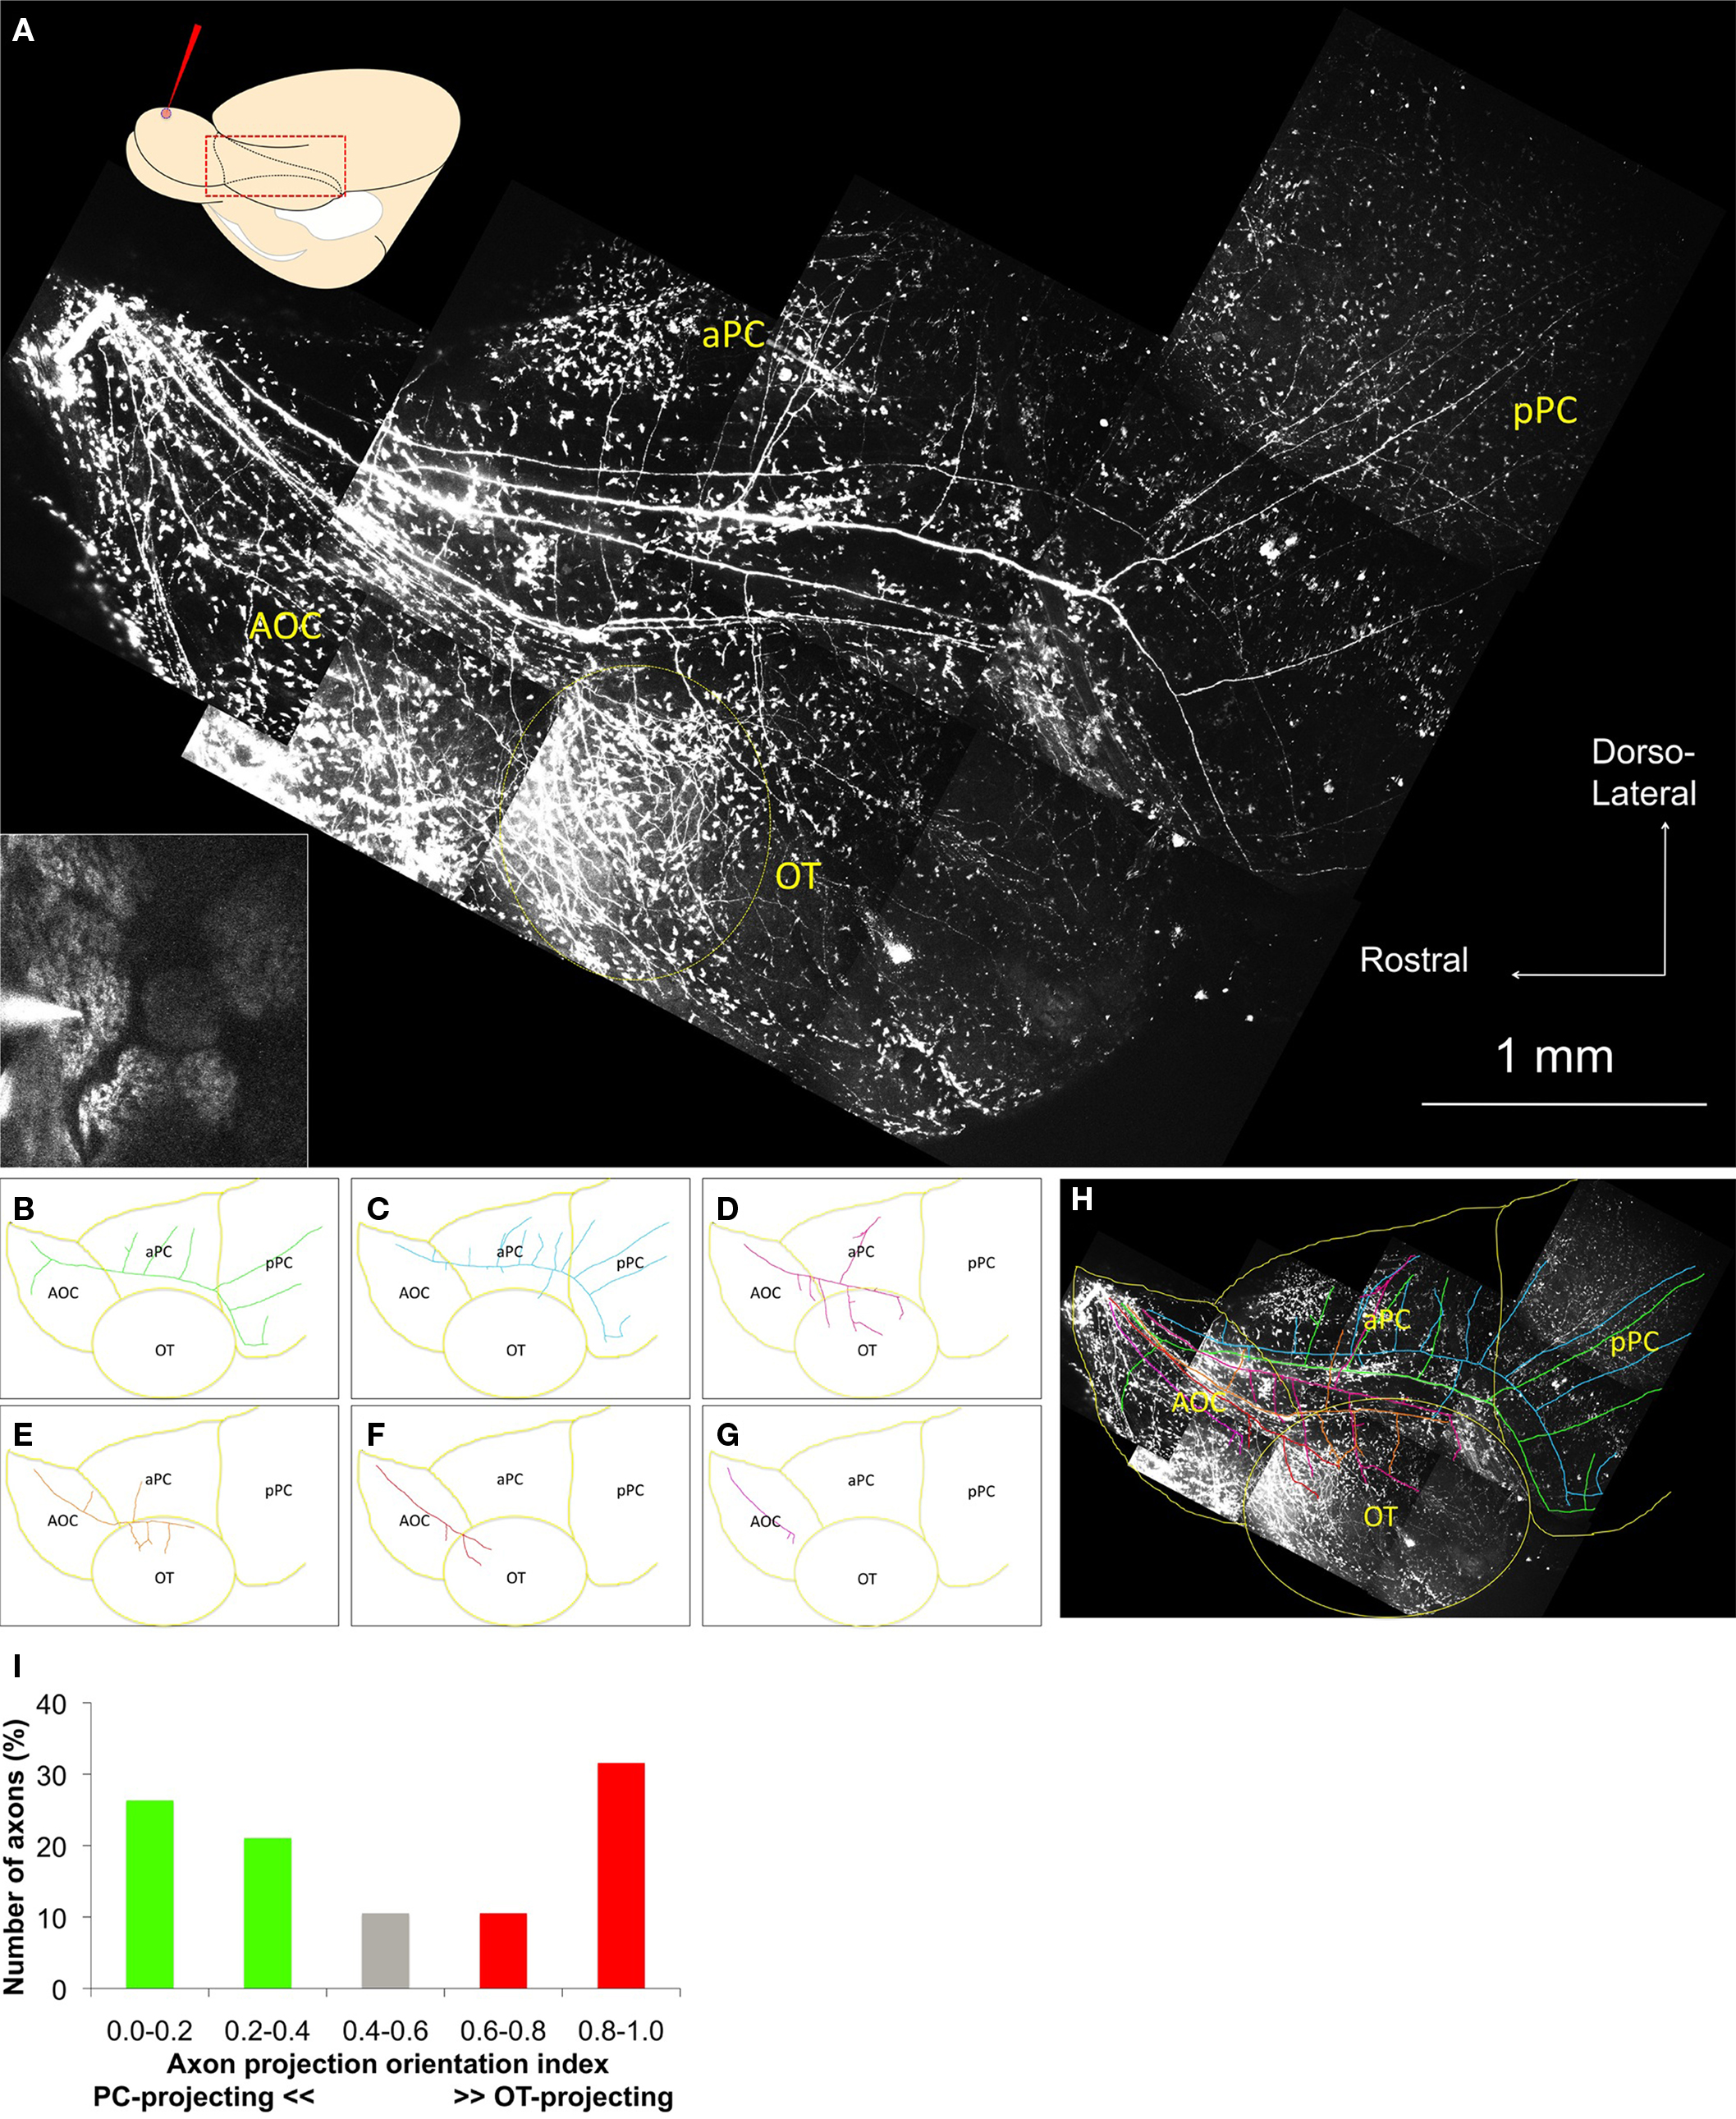
Figure 1. Axonal trajectories of neurons from a single glomerulus. (A) Two-photon images of the ventrolateral aspect of the whole brain. A schematic diagram of the dye injection and observation areas from the same ventrolateral view of the whole brain is shown in the upper left. Inset: One-shot image of the dye injection pipette and the target glomerulus before dye injection. Main figure: Two-photon images of the olfactory cortex in the same animal. Labeled axons appeared on the brain surface near the border between OB and AOC (upper left part of the image) and tracked along the LOT and branch into a/pPC and OT. An area of dense axonal projection appears in the anterior OT (yellow dotted circle). Non-neuronal cells on the surface of the brain also uptake dye and show spotty noise in the image. AOC, anterior olfactory cortex; aPC, anterior piriform cortex; pPC, posterior piriform cortex; OT, olfactory tubercle. (B–G) Highlights of the individual axon trajectories in (A). (H) Superimposition of the images (A–G). PC-oriented axons mainly run along the dorsal part of the LOT, while OT-oriented axons mainly run along the ventral part of the LOT. The population of the single-glomerulus axons covers a wide area of the OC. Presumed cortical borders are drawn in yellow. (I) Axon projection orientation index. Nineteen axons were categorized into five subgroups on the basis of their axon projection orientation index calculated as (OT projection branches)/(OT + PC branches). PC, OT, and neutral projection groups are shown as green, red, and gray columns, respectively.
In some cases, we could clearly observe the labeled projection neurons within 1 h after dye injection (Movie S1 in Supplementary Material). Three to five days after dye injection, the ventrolateral surface of the fixed whole brain was imaged by the two-photon system (Figure 1A). The labeled single-glomerulus axons could not be traced within the OB because they extended deep into the structure. They appeared on the brain surface near the border between the OB and anterior OC (AOC; this area includes the lateral, dorsal and ventroposterior divisions of the anterior olfactory nucleus; Haberly, 2001), then coursed along the lateral olfactory tract (LOT), and finally branched into the AOC, anterior/posterior PC (a/pPC), and OT. Some labeled axons extended to more caudal or ventral brain areas, most likely toward the lateral entorhinal cortex and amygdaloid cortex.
Non-neuronal cells also took up the fluorescent tracers and contributed to spotty background fluorescent noise. Despite this noise, the labeled individual axons could be clearly separated and traced. Surprisingly, each axon from a single glomerulus showed a distinct branching pattern and projected to multiple brain areas in a different way (Figures 1B–G). Overall, the axons from a common glomerulus covered an extensive area of the OC (Figure 1H). These results suggest that the projection neurons innervating the same glomerulus do not necessarily display the same axonal trajectory and are also consistent with recent experiments in zebrafish (Miyasaka et al., 2009).
According to their length and branching patterns, these axons could be largely categorized in two groups. One group of axons occupied the dorsolateral part of the LOT and split many axonal branches into the dorsolateral OC, predominantly to a/pPC (Figures 1B–C). These axons emitted only a few axon collaterals toward the OT. The other group occupied the ventrolateral part of the LOT and mainly projected to the ventrolateral OC, predominantly to the OT (Figures 1D–G). Such OT-orienting axons tended to project more densely to the anterolateral OT (alOT). A total of 19 axonal trajectories from six brain hemispheres are summarized in Figure 1I, focusing on their secondary axon branching patterns. Each axon was categorized into one of five subgroups based on its axon projection orientation index: (OT branch number)/(OT + PC total branch number). This quantification clearly demonstrates an uneven branching pattern of projection neurons, with axons preferentially targeting either OT or PC. These data suggest that these two types of neurons sharing a glomerulus send information to different higher brain areas, such as alOT or PC.
Differential Axon Projection Patterns After Superficial or Deep EPL Dye Injection
Projection neurons in the OB consist of mitral and tufted cells. Retrograde tracing and electrophysiological experiments suggest that mitral cells project to the entire OC while tufted cells project to the anterior part of the OC (Haberly and Price, 1977; Skeen and Hall, 1977; Scott et al., 1980; Scott, 1981; Schneider and Scott, 1983). However, no report has directly observed and compared the axonal trajectories of mitral and tufted cells in the same brain. One hypothesis is that the two observed types of axonal trajectories originate from these two types of OB projection neurons. To address this possibility, these neurons were labeled with different colored dyes. Mitral cells are known to have large cell bodies in the mitral cell layer and extend their secondary dendrites within the deep part of the EPL. In contrast, tufted cells have relatively small cell bodies in the EPL and the bottom of the glomerular layer (GL), and extend secondary dendrites within the superficial EPL (Mori et al., 1983; Orona et al., 1984; Shepherd et al., 2004). Therefore, differential dye injection into the superficial or deep EPL may increase the likelihood of labeling the two types of projection neurons distinctively.
By careful monitoring of the depth of the pipette tip, dextran-conjugated Alexa 488 (green) and Alexa 594 (red) were injected into the deep and superficial EPL, respectively (Figure 2A, insets). The dyes were localized to a small area of the EPL and labeled neurons that extended their dendrites to the injected area, as reported previously (Nagayama et al., 2007). Mitral and tufted cells were successfully labeled selectively with different colored dyes. The labeled neurons were identified and grouped as mitral cell layer cells (MCL cells; presumably mitral cells) and EPL/GL cells (presumably tufted cells), by their distribution patterns near the dye injection area (six sections). Small number of neurons (21 cells) was labeled by both colored dyes. Those neurons were not used for the analysis. The segregation of the labeled cells into superficial and deep EPL injections is summarized in Figure 2B. Of the total number of cells labeled by deep EPL injections, 79% were MCL cells. Of the total number of cells labeled by superficial EPL injections, 86% were EPL/GL cells. As the background near the EPL dye injection sites was too bright in some sections to identify the labeled EPL neurons, the EPL/GL cells numbers could be underestimated. The labeled axons of presumed mitral cells and tufted cells were also clearly segregated within the LOT and in the OC. The majority of superficial EPL neuronal axons (red) mainly occupied the ventral part of the LOT and projected into the alOT. The majority of deep EPL neuronal axons (green) occupied the dorsal part of the LOT and projected into the a/pPC (Figure 2A).
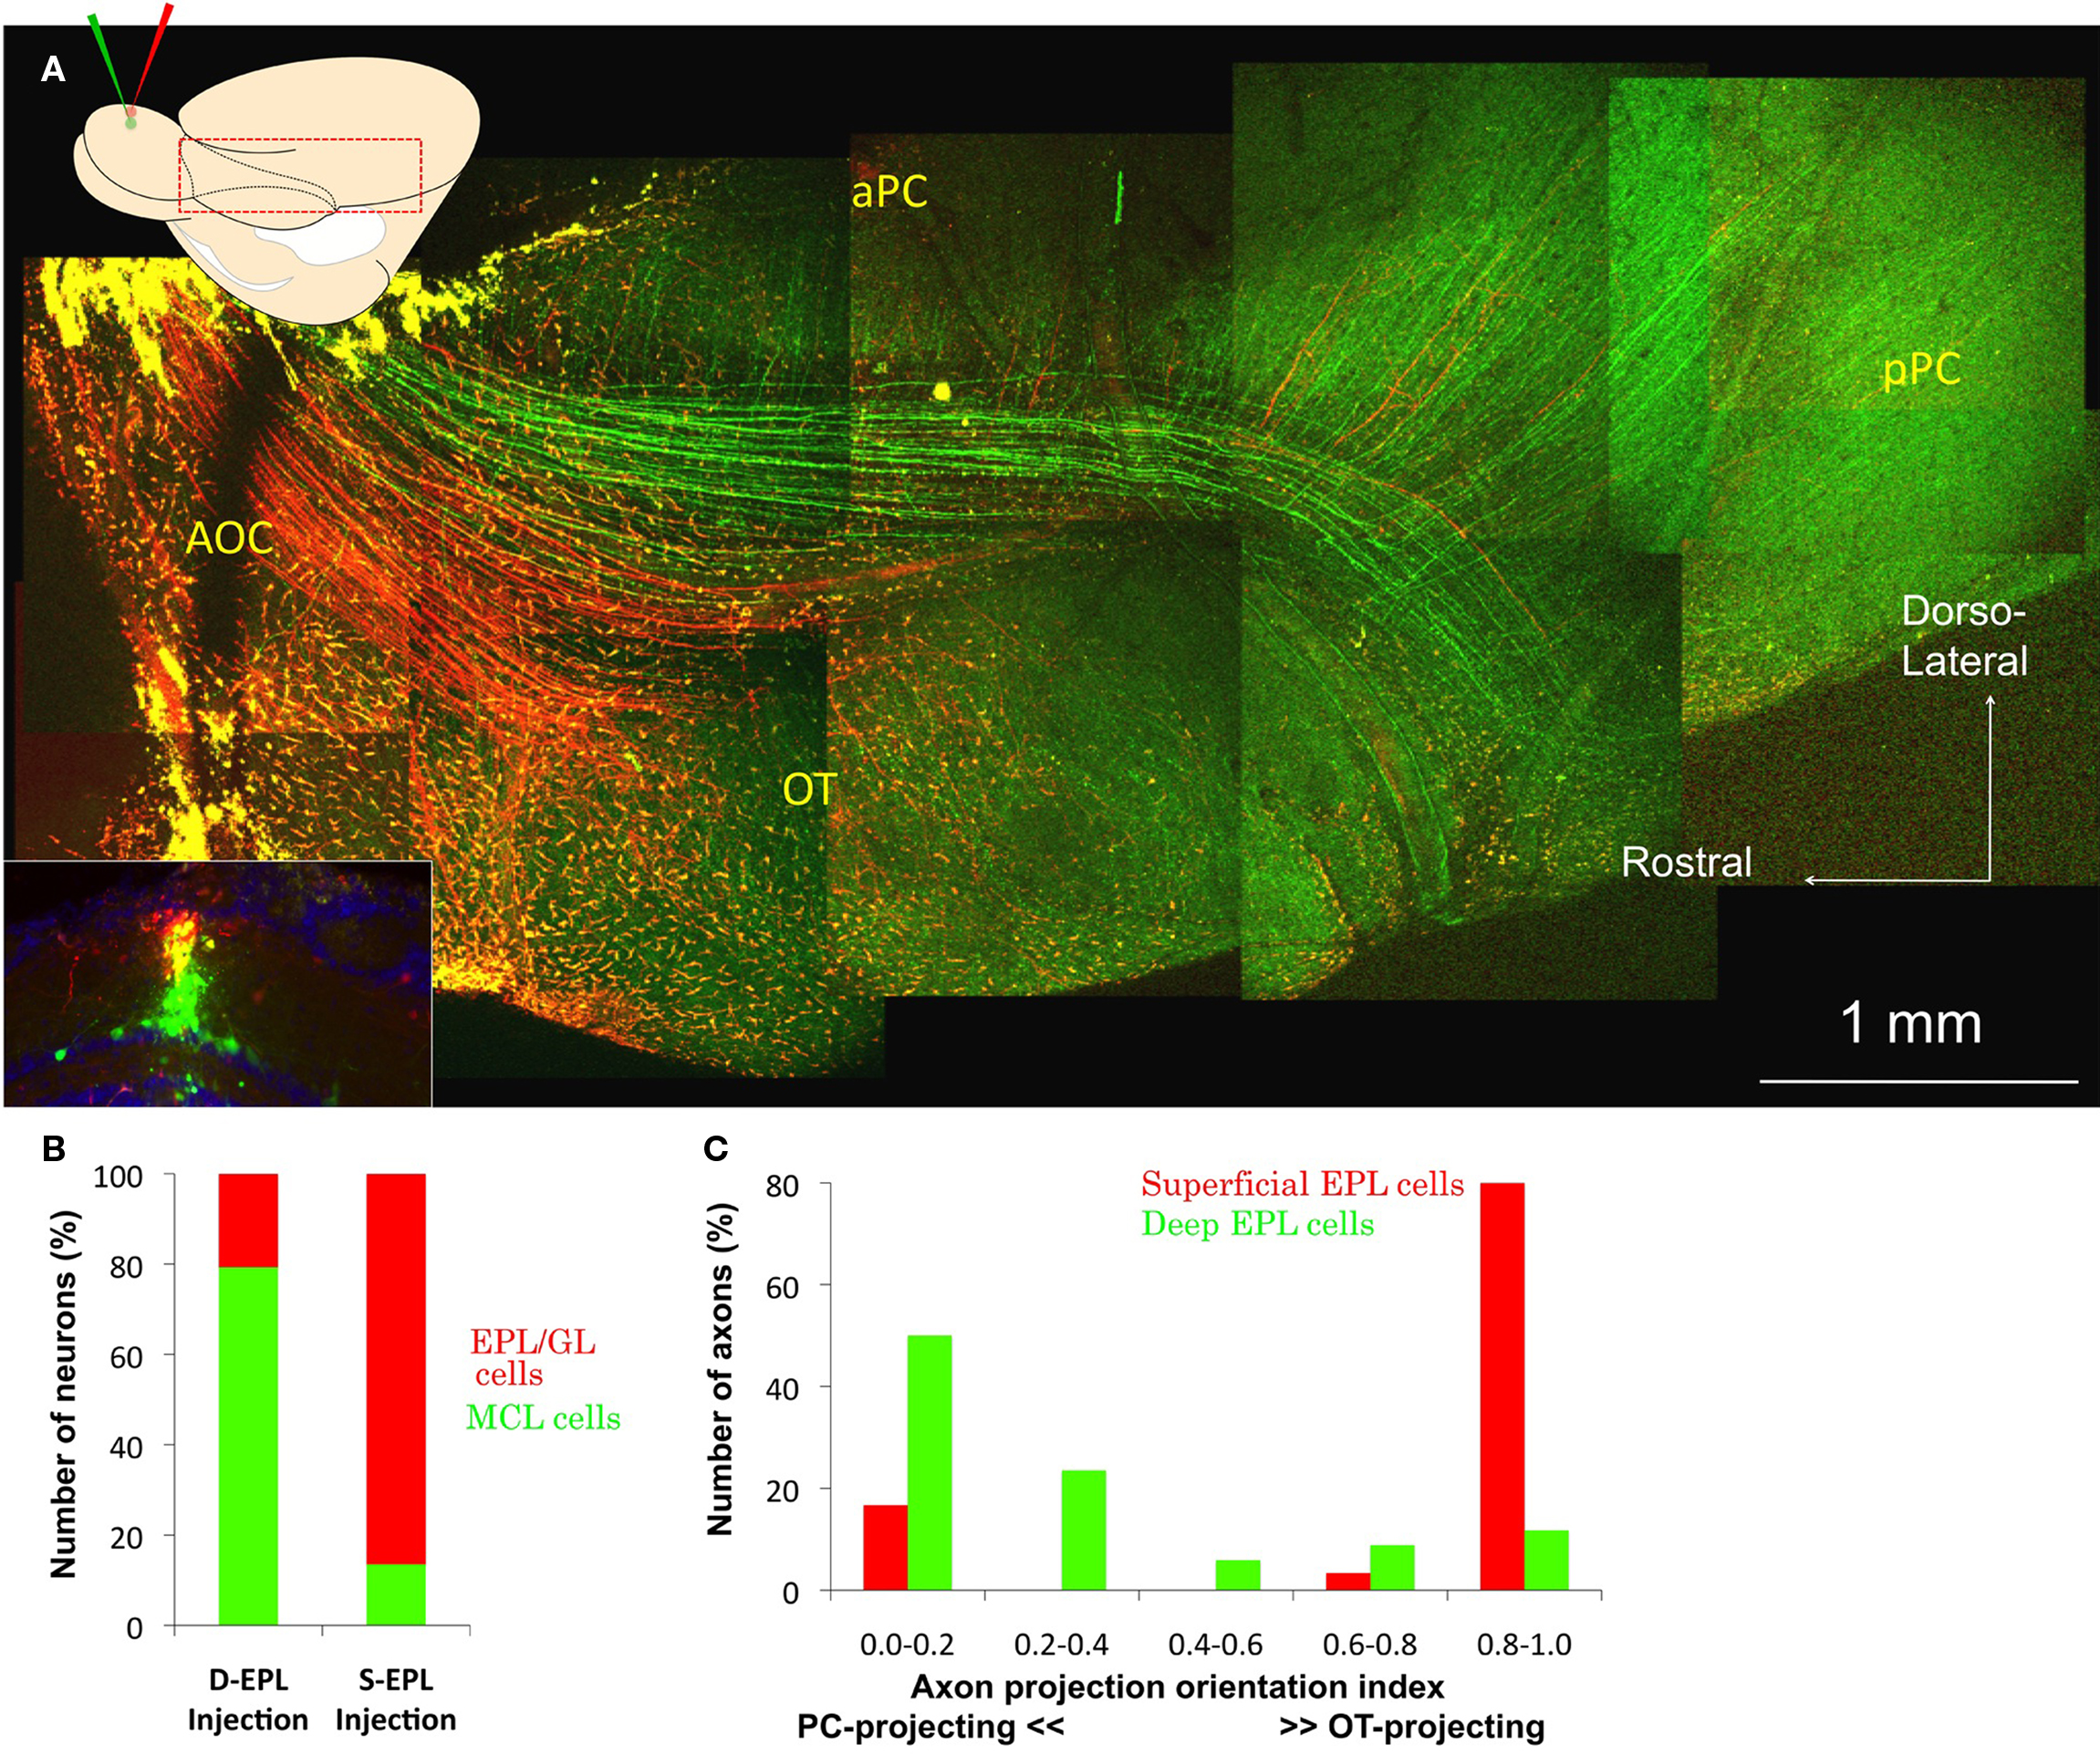
Figure 2. Superficial and deep EPL cell axon projection pattern. (A) Inset: Coronal image of the tracer injection site in the OB. Dextran-conjugated Alexa 488 (green) and Alexa 594 (red) were injected into the deep and superficial parts of the EPL, respectively, in the same area of the dorsal OB. The majority of the red-labeled neurons were tufted cells, and most green-labeled cells were mitral cells. DAPI nuclear labeling is blue. Main figure: Cortical observations in the same animal. The majority of green-labeled presumed mitral cell axons run along the dorsal part of the LOT and mainly branch into the a/pPC, although faintly green-labeled axons can also be observed in the OT. The majority of red-labeled presumed tufted cell axons run along the ventral part of the LOT and mainly project into the OT, although a small number of red-labeled axons can also be observed in the a/pPC. (B) Distribution of the labeled neurons in the OB. Neurons labeled by the superficial EPL (S-EPL; n = 37) and deep EPL (D-EPL; n = 82) dye injections were categorized in two groups, mitral cell layer cells (MCL cells; Green) and external plexiform layer/glomerular layer cells (EPL/GL cells; Red). (C) Axon projection orientation index. The majority of superficial EPL neurons (red column; n = 30) were grouped in the higher index number categories (right side of the graph), while deep EPL neurons (green columns; n = 34) tended to have lower index numbers (left side of the graph).
The axon pathways appeared segregated even in the anterior portion of the LOT, in the area of the AOC, and maintained this segregation to the anterior portion of the OT and aPC. Some faintly green-labeled deep EPL axons could also be observed in the posterior part of the OT, and a few red-labeled superficial EPL axons could be observed in the PC. These results clearly suggest that, even in the same area of the OB, the majority of mitral and tufted cells show differential axonal trajectories and mainly project to different target areas, PC or alOT, respectively. Figure 2C shows the axon projection orientation index of the 30 superficial- and 34 deep EPL neurons in the six brain hemispheres, as well as the distinctive axonal projection patterns of deep and superficial EPL neurons, presumably mitral and tufted cells, respectively.
Discussion
Limitations of the Tracing Method
To interpret the data accurately, the physical drawbacks of this tracing method must first be discussed. This method has the following difficulties and limitations: (1) tracing of obscured brain surface areas, such as the rhinal sulcus and septal regions of the OC, lateral entorhinal cortex, and amygdaloid cortex; (2) detection of weakly labeled and small branches; (3) detection of the axons that extend into deeper brain areas such as the ventrorostral anterior PC (APCVR) region beneath the LOT (Ekstrand et al., 2001); and (4) identification of individual axons in axon-congested areas such as the anterior LOT in the area of the AOC. Comparatively, although classical single-neuron approaches have a higher quality of individual axon tracing in regard to the limitations above, our method allows the tracing and comparison of multiple axons simultaneously within the same sample. This advantage is critical for the exploration of large neuroanatomical circuits and allowed us to compare the individual axon trajectories arising from a common glomerulus as well as from differentially labeled presumed mitral and tufted cell populations. Further use of this method could reveal OB–OC connections more clearly and completely in future investigations.
Odor Signal Processing in the Olfactory Cortex
From the nasal epithelium to OB, olfactory information is transferred via genetically and anatomically sophisticated pathways to converge onto individual glomerular modules. From the OB to OC, however, our data indicate that individual projection neurons innervating a single glomerulus show quite divergent axonal projection patterns, and in total cover an extremely wide area of the OC. Therefore, the axonal output of each glomerulus should overlap with the projections of other glomeruli. These results strongly suggest that OB to OC projections may be organized according to different rules than those governing nasal epithelium to OB projections. Olfactory cortical neurons have been shown to receive multiglomerular inputs (Illig and Haberly, 2003; Murakami et al., 2005; Zou et al., 2005; Lei et al., 2006; Zou and Buck, 2006; Rennaker et al., 2007; Poo and Isaacson, 2009; Stettler and Axel, 2009), and individual OC neurons may reasonably collect such multiglomerular inputs in a different manner in different OC areas (Kadohisa and Wilson, 2006; Yoshida and Mori, 2007; Kikuta et al., 2008, 2010; Wesson and Wilson, 2010). As a result of this, a vast reorganization of the encoding and processing of olfactory information may occur in the OC (Miyasaka et al., 2009).
Parallel Processing in the Main Olfactory System
Previous anatomical experiments have shown that PC neurons project to brain surface cortical areas, such as the orbitofrontal, insular, entorhinal, and perirhinal cortex, in addition to the amygdala (Luskin and Price, 1983; Johnson et al., 2000; Illig, 2005). In contrast, the OT is categorized as part of the ventral striatum and densely projects to other striatal areas including the ventral pallidum, caudate putamen, nucleus accumbens, ventral tegmental area, and lateral hypothalamic area (Scott and Chafin, 1975; Millhouse and Heimer, 1984; Ikemoto, 2007). Moreover, topographic connections between OT subareas and the nucleus accumbens and ventral pallidum have been reported (Ikemoto, 2007). The alOT could potentially establish a specific stream among the pathways between OT and striatum. Taken together with the present findings, these studies suggest that the segregation of distinct olfactory processing pathways originating in mitral and tufted cells is conserved not only from OB to OC but also in higher brain centers.
One attractive hypothesis is that mitral and tufted cells initiate parallel processing streams in the olfactory system. An important component of parallel processing in other sensory systems is that each pathway in the parallel streams has different functions, handles different aspects of the same sensory input, and processes information in different brain areas. Compared with mitral cells, tufted cells have a low spike threshold, weak and narrow tuning range of lateral inhibition, high firing frequency, and strong respiratory locking activity (Schneider and Scott, 1983; Ezeh et al., 1993; Nagayama et al., 2004; Griff et al., 2008). These data suggest that mitral cells may be involved in comparing their own and surrounding glomerular activities, while tufted cells may in turn be involved in rapid odor detection over the respiratory rhythm, even at low concentrations. Moreover, tufted cell circuits have been reported as highly sensitive and plastic to sensory deprivation (Imamura et al., 2006). OT neurons receive substantial dopaminergic inputs from the ventral tegmental area, which are related to reward signals (Ikemoto, 2007). These reports suggest that the tufted cell pathway may have a critical function in monitoring the odor environment and changing animal behavioral states in response to external environmental changes. In contrast, a mitral cortical pathway may be adequate to establish an accurate odor image. For a clearer characterization of these two olfactory pathways, a direct functional comparison of mitral and tufted cells common to the same glomerulus, as well as of PC and OT, should be conducted in the future.
Conflict of Interest Statement
The authors declare that the research was conducted in the absence of any commercial or financial relationships that could be construed as a potential conflict of interest.
Acknowledgments
This work was supported by multiple NIH grants (DC010057 to Shin Nagayama; DC009853 to Max L. Fletcher; and DC003918 and DC009666 to Wei R. Chen), the NIH Medical Scientist Training Program (Arjun V. Masurkar), a Patterson Trust Fellowship in Brain Circuitry (Shin Nagayama), and a Yale Brown-Coxe Postdoctoral Fellowship (Max L. Fletcher).
References
Bozza, T., McGann, J. P., Mombaerts, P., and Wachowiak, M. (2004). In vivo imaging of neuronal activity by targeted expression of a genetically encoded probe in the mouse. Neuron 42, 9–21.
Buck, L. B. (1996). Information coding in the vertebrate olfactory system. Annu. Rev. Neurosci. 19, 517–544.
Buonviso, N., Revial, M. F., and Jourdan, F. (1991). The projections of mitral cells from small local regions of the olfactory bulb: an anterograde tracing study using PHA-L (Phaseolus vulgaris leucoagglutinin). Eur. J. Neurosci. 3, 493–500.
Ekstrand, J. J., Domroese, M. E., Johnson, D. M., Feig, S. L., Knodel, S. M., Behan, M., and Haberly, L. B. (2001). A new subdivision of anterior piriform cortex and associated deep nucleus with novel features of interest for olfaction and epilepsy. J. Comp. Neurol. 434, 289–307.
Ezeh, P. I., Wellis, D. P., and Scott, J. W. (1993). Organization of inhibition in the rat olfactory bulb external plexiform layer. J. Neurophysiol. 70, 263–274.
Griff, E. R., Mafhouz, M., and Chaput, M. A. (2008). Comparison of identified mitral and tufted cells in freely breathing rats: II. Odor-evoked responses. Chem. Senses 33, 793–802.
Haberly, L. B. (2001). Parallel-distributed processing in olfactory cortex: new insights from morphological and physiological analysis of neuronal circuitry. Chem. Senses 26, 551–576.
Haberly, L. B., and Price, J. L. (1977). The axonal projection patterns of the mitral and tufted cells of the olfactory bulb in the rat. Brain Res. 129, 152–157.
Ikemoto, S. (2007). Dopamine reward circuitry: two projection systems from the ventral midbrain to the nucleus accumbens-olfactory tubercle complex. Brain Res. Rev. 56, 27–78.
Illig, K. R. (2005). Projections from orbitofrontal cortex to anterior piriform cortex in the rat suggest a role in olfactory information processing. J. Comp. Neurol. 488, 224–231.
Illig, K. R., and Haberly, L. B. (2003). Odor-evoked activity is spatially distributed in piriform cortex. J. Comp. Neurol. 457, 361–373.
Imamura, F., Nagao, H., Naritsuka, H., Murata, Y., Taniguchi, H., and Mori, K. (2006). A leucine-rich repeat membrane protein, 5T4, is expressed by a subtype of granule cells with dendritic arbors in specific strata of the mouse olfactory bulb. J. Comp. Neurol. 495, 754–768.
Jefferis, G. S., Potter, C. J., Chan, A. M., Marin, E. C., Rohlfing, T., Maurer, C. R. Jr., and Luo, L. (2007). Comprehensive maps of Drosophila higher olfactory centers: spatially segregated fruit and pheromone representation. Cell 128, 1187–1203.
Johnson, D. M., Illig, K. R., Behan, M., and Haberly, L. B. (2000). New features of connectivity in piriform cortex visualized by intracellular injection of pyramidal cells suggest that “primary” olfactory cortex functions like “association” cortex in other sensory systems. J. Neurosci. 20, 6974–6982.
Kadohisa, M., and Wilson, D. A. (2006). Separate encoding of identity and similarity of complex familiar odors in piriform cortex. Proc. Natl. Acad. Sci. U.S.A. 103, 15206–15211.
Kikuta, S., Kashiwadani, H., and Mori, K. (2008). Compensatory rapid switching of binasal inputs in the olfactory cortex. J. Neurosci. 28, 11989–11997.
Kikuta, S., Sato, K., Kashiwadani, H., Tsunoda, K., Yamasoba, T., and Mori, K. (2010). Neurons in the anterior olfactory nucleus pars externa detect right or left localization of odor sources. Proc. Natl. Acad. Sci. U.S.A. 107, 12363–12368.
Lei, H., Mooney, R., and Katz, L. C. (2006). Synaptic integration of olfactory information in mouse anterior olfactory nucleus. J. Neurosci. 26, 12023–12032.
Lin, H. H., Lai, J. S., Chin, A. L., Chen, Y. C., and Chiang, A. S. (2007). A map of olfactory representation in the Drosophila mushroom body. Cell 128, 1205–1217.
Luskin, M. B., and Price, J. L. (1983). The topographic organization of associational fibers of the olfactory system in the rat, including centrifugal fibers to the olfactory bulb. J. Comp. Neurol. 216, 264–291.
Marin, E. C., Jefferis, G. S., Komiyama, T., Zhu, H., and Luo, L. (2002). Representation of the glomerular olfactory map in the Drosophila brain. Cell 109, 243–255.
Millhouse, O. E., and Heimer, L. (1984). Cell configurations in the olfactory tubercle of the rat. J. Comp. Neurol. 228, 571–597.
Miyasaka, N., Morimoto, K., Tsubokawa, T., Higashijima, S., Okamoto, H., and Yoshihara, Y. (2009). From the olfactory bulb to higher brain centers: genetic visualization of secondary olfactory pathways in zebrafish. J. Neurosci. 29, 4756–4767.
Mombaerts, P. (1999). Seven-transmembrane proteins as odorant and chemosensory receptors. Science 286, 707–711.
Mori, K., Kishi, K., and Ojima, H. (1983). Distribution of dendrites of mitral, displaced mitral, tufted, and granule cells in the rabbit olfactory bulb. J. Comp. Neurol. 219, 339–355.
Mori, K., Takahashi, Y. K., Igarashi, K. M., and Yamaguchi, M. (2006). Maps of odorant molecular features in the Mammalian olfactory bulb. Physiol. Rev. 86, 409–433.
Murakami, M., Kashiwadani, H., Kirino, Y., and Mori, K. (2005). State-dependent sensory gating in olfactory cortex. Neuron 46, 285–296.
Nagayama, S., Takahashi, Y. K., Yoshihara, Y., and Mori, K. (2004). Mitral and tufted cells differ in the decoding manner of odor maps in the rat olfactory bulb. J. Neurophysiol. 91, 2532–2540.
Nagayama, S., Zeng, S., Xiong, W., Fletcher, M. L., Masurkar, A. V., Davis, D. J., Pieribone, V. A., and Chen, W. R. (2007). In vivo simultaneous tracing and Ca2+ imaging of local neuronal circuits. Neuron 53, 789–803.
Ojima, H., Mori, K., and Kishi, K. (1984). The trajectory of mitral cell axons in the rabbit olfactory cortex revealed by intracellular HRP injection. J. Comp. Neurol. 230, 77–87.
Orona, E., Rainer, E. C., and Scott, J. W. (1984). Dendritic and axonal organization of mitral and tufted cells in the rat olfactory bulb. J. Comp. Neurol. 226, 346–356.
Poo, C., and Isaacson, J. S. (2009). Odor representations in olfactory cortex: “sparse” coding, global inhibition, and oscillations. Neuron 62, 850–861.
Rennaker, R. L., Chen, C. F., Ruyle, A. M., Sloan, A. M., and Wilson, D. A. (2007). Spatial and temporal distribution of odorant-evoked activity in the piriform cortex. J. Neurosci. 27, 1534–1542.
Schneider, S. P., and Scott, J. W. (1983). Orthodromic response properties of rat olfactory bulb mitral and tufted cells correlate with their projection patterns. J. Neurophysiol. 50, 358–378.
Scott, J. W. (1981). Electrophysiological identification of mitral and tufted cells and distributions of their axons in olfactory system of the rat. J. Neurophysiol. 46, 918–931.
Scott, J. W., and Chafin, B. R. (1975). Origin of olfactory projections to lateral hypothalamus and nuclei gemini of the rat. Brain Res. 88, 64–68.
Scott, J. W., McBride, R. L., and Schneider, S. P. (1980). The organization of projections from the olfactory bulb to the piriform cortex and olfactory tubercle in the rat. J. Comp. Neurol. 194, 519–534.
Shepherd, G. M., Chen, W. R., and Greer, C. A. (2004). “Olfactory bulb,” in The Synaptic Organization of the Brain, 5th Edn., ed. G. M. Shepherd (New York, NY: Oxford University Press, Inc.), 165–216.
Skeen, L. C., and Hall, W. C. (1977). Efferent projections of the main and the accessory olfactory bulb in the tree shrew (Tupaia glis). J. Comp. Neurol. 172, 1–35.
Stettler, D. D., and Axel, R. (2009). Representations of odor in the piriform cortex. Neuron 63, 854–864.
Wesson, D. W., and Wilson, D. A. (2010). Smelling sounds: olfactory-auditory sensory convergence in the olfactory tubercle. J. Neurosci. 30, 3013–3021.
Wong, A. M., Wang, J. W., and Axel, R. (2002). Spatial representation of the glomerular map in the Drosophila protocerebrum. Cell 109, 229–241.
Yoshida, I., and Mori, K. (2007). Odorant category profile selectivity of olfactory cortex neurons. J. Neurosci. 27, 9105–9114.
Zou, Z., and Buck, L. B. (2006). Combinatorial effects of odorant mixes in olfactory cortex. Science 311, 1477–1481.
Keywords: mitral cell, tufted cell, olfactory bulb, axon projection, piriform cortex, olfactory tubercle, parallel pathways, two-photon imaging
Citation: Nagayama S, Enerva A, Fletcher ML, Masurkar AV, Igarashi KM, Mori K and Chen WR (2010) Differential axonal projection of mitral and tufted cells in the mouse main olfactory system. Front. Neural Circuits 4:120. doi: 10.3389/fncir.2010.00120
Received: 20 July 2010;
Paper pending published: 18 August 2010;
Accepted: 13 September 2010;
Published online: 23 September 2010
Edited by:
Leslie B. Vosshall, Rockefeller University, USAReviewed by:
Donald A. Wilson, New York University School of Medicine, USAPeter Brunjes, University of Virginia, USA
Copyright: © 2010 Nagayama, Enerva, Fletcher, Masurkar, Igarashi, Mori and Chen. This is an open-access article subject to an exclusive license agreement between the authors and the Frontiers Research Foundation, which permits unrestricted use, distribution, and reproduction in any medium, provided the original authors and source are credited.
*Correspondence: Shin Nagayama, Department of Neurobiology and Anatomy, University of Texas Health Science Center at Houston, 6431 Fannin Street, Suite MSB 7.046, Houston, TX 77030, USA. email: shin.nagayama@uth.tmc.edu