Distribution and compartmental organization of GABAergic medium-sized spiny neurons in the mouse nucleus accumbens
- 1CNRS, UMR-5203, Institut de Génomique Fonctionnelle, Montpellier, France
- 2Inserm, U661, Montpellier, France
- 3Universités de Montpellier 1 & 2, UMR-5203, Montpellier, France
- 4Laboratory of Neurophysiology, School of Medicine, Université Libre de Bruxelles, ULB Neuroscience Institute, Brussels, Belgium
- 5CNRS, UMR-7224, Paris, France
- 6Inserm, U952, Paris, France
- 7Université Pierre et Marie Curie, UMR-7224, Paris, France
- 8Laboratory of Systems Neuroscience, National Institute of Mental Health, Bethesda, MD, USA
- 9Inserm, UMR-S 839, Paris, France
- 10Université Pierre et Marie Curie, UMR-S 839, Paris, France
- 11Institut du Fer á Moulin, Paris, France
The nucleus accumbens (NAc) is a critical brain region involved in many reward-related behaviors. The NAc comprises major compartments the core and the shell, which encompass several subterritories. GABAergic medium-sized spiny neurons (MSNs) constitute the output neurons of the NAc core and shell. While the functional organization of the NAc core outputs resembles the one described for the dorsal striatum, a simple classification of the NAc shell neurons has been difficult to define due to the complexity of the compartmental segregation of cells. We used a variety of BAC transgenic mice expressing enhanced green fluorescence (EGFP) or the Cre-recombinase (Cre) under the control of the promoter of dopamine D1, D2, and D3 receptors and of adenosine A2a receptor to dissect the microanatomy of the NAc. Moreover, using various immunological markers we characterized in detail the distribution of MSNs in the mouse NAc. In addition, cell-type specific extracellular signal-regulated kinase (ERK) phosphorylation in the NAc subterritories was analyzed following acute administration of SKF81297 (a D1R-like agonist), quinpirole (a D2 receptors (D2R)-like agonist), apomorphine (a non-selective DA receptor agonist), raclopride (a D2R-like antagonist), and psychostimulant drugs, including cocaine and d-amphetamine. Each drug generated a unique topography and cell-type specific activation of ERK in the NAc. Our results show the existence of marked differences in the receptor expression pattern and functional activation of MSNs within the shell subterritories. This study emphasizes the anatomical and functional heterogeneity of the NAc, which will have to be considered in its further study.
Introduction
Located in the rostrobasal forebrain, the nucleus accumbens (NAc) is a major brain area that processes incentive–reward responses associated with novel, hedonic, stressful, or aversive stimuli (Kalivas and Duffy, 1995; Reynolds and Berridge, 2002; Jensen et al., 2003; Nicola, 2007). Dysfunctions of this structure have been associated with prominent psychiatric disorders including obsessive-compulsive disorder, depression, and drug addiction (Nicola, 2007; Sesack and Grace, 2010).
Generally seen as an integral part of the striatal complex, it is, however, widely accepted that the NAc represents an independent entity that exhibits unique features compared with the dorsal striatum (Herkenham et al., 1984). Using a variety of immunohistochemical markers and tract-tracing approaches, earlier studies allowed distinguishing three major compartments in the NAc, the rostral pole, the core and the shell (Zaborszky et al., 1985; Zahm and Brog, 1992), but also multiple subterritories within these three compartments (Heimer et al., 1991; Zahm and Brog, 1992; Jongen-Relo et al., 1993, 1994; Groenewegen et al., 1999).
The NAc lacks glutamatergic neurons but is instead mostly composed of GABAergic medium-sized spiny neurons (MSNs), the remaining neurons being cholinergic and GABAergic interneurons (Meredith et al., 1993). The functional organization of the NAc core MSNs resembles that described for the dorsal striatum. Indeed, NAc core MSNs can be categorized into at least two different subgroups according to their projections sites. The MSNs projecting to the ventral tegmental area (VTA) express exclusively D1 receptors (D1R) resembling therefore the striatonigral MSNs (Gerfen et al., 1990; Schiffmann et al., 1991; Fink et al., 1992; Gerfen, 1992; Le Moine and Bloch, 1995). However, pallidal afferents from the NAc appear to differ from the striatopallidal MSNs of the dorsal striatum since NAc core MSNs innervating the ventral pallidum (VP) express D1R and D2 receptors (D2R)/adenosine A2a receptors (A2aR) (Lu et al., 1998). Due to the diversity of their output targets that include VTA, hypothalamus, VP, and brainstem, a simple division into direct and indirect pathways has been even more difficult to define for the NAc shell MSNs (Voorn et al., 1989; Zahm and Brog, 1992; Van Dongen et al., 2008; Humphries and Prescott, 2010; Sesack and Grace, 2010). In addition, a higher proportion of MSNs in the shell than in the rest of the striatum appears to co-express D1R and D2R, suggesting that the segregation in two distinct populations is far from being complete (Le Moine and Bloch, 1996; Bertran-Gonzalez et al., 2008, 2010; Matamales et al., 2009; Durieux et al., 2011). Moreover, whether D1R- and D2R-expressing MSNs are randomly distributed or exhibit inhomogeneous distribution patterns in the different subterritories of the NAc shell remains to be established.
To address these issues, we took advantage of BAC transgenic mice expressing enhanced green fluorescent protein (EGFP) under the control of the promoter of D1R, Drd1a-EGFP, and D2R, Drd2-EGFP (Gong et al., 2003; Valjent et al., 2009). Moreover, the dopamine D3 receptor (D3R) being highly expressed in the NAc, we also analyzed GFP expression in Drd3-Cre crossed with the Rosa26:loxP reporter mouse line. Using a variety of immunological markers we characterized in detail the microanatomical distribution of D1R- and D2R-expressing MSNs in the mouse NAc. We also provide evidence that dopaminergic agonists and psychostimulant drugs induce specific and topographical patterns of extracellular signal-regulated kinase (ERK) activation that are closely associated with specific NAc shell subterritories.
Materials and Methods
Animals
Drd2-EGFP (n = 29, Swiss-Webster background, founder S118), Drd2-Cre (n = 4, C57/Bl6J background, founder ER44), Drd1a-EGFP (n = 4, Swiss-Webster background, founder X60), Drd3-Cre (n = 2, C57/Bl6J background, founder KI196), and Adora2a-Cre (Durieux et al., 2009) (n = 3, C57/Bl6J background) BAC transgenic mice were used in this study. BAC-EGFP and BAC-Cre mice were originally generated by GENSAT (Gene Expression Nervous System Atlas) at the Rockefeller University (New York, NY) (Gong et al., 2003) except the Adora2a-Cre (Durieux et al., 2009). Adora2a-Cre mice were used to identify striatopallidal neurons. Indeed in the striatum, these mice expressed the Cre recombinase selectively in striatopallidal neurons but not in other striatal populations (striatonigral MSNs, GABA, and cholinergic interneurons) or in the presynatic DA neurons (Durieux et al., 2009). Rosa26:loxP (Srinivas et al., 2001) and R26R CAG-boosted EGFP:LoxP (RCE:LoxP) (Miyoshi et al., 2010) mice were used as reporter to compare the patterns of expression in different mouse lines. Male 8–10 week-old mice were used and maintained in a 12 h light/dark cycle, in stable conditions of temperature (22°C) and humidity (60%), with food and water ad libitum. For the pharmacological studies only Drd2-EGFP heterozygous mice were used. All experiments were in accordance with the guidelines of the French Agriculture and Forestry Ministry for handling animals (C34-172-13).
Drugs and Treatment
SKF81297 (5.0 mg/kg, i.p.), quinpirole (1.0 mg/kg, i.p.), apomorphine (3.0 mg/kg, s.c.), and raclopride (0.3 mg/kg, i.p.) were purchased from Tocris and dissolved in 0.9% (w/v) NaCl (saline). Cocaine (15 mg/kg, i.p.) and d-amphetamine (10 mg/kg, i.p.) were purchased from Sigma Aldrich and dissolved in 0.9% (w/v) NaCl (saline). Mice were habituated to handling and saline injection three consecutive days before the experiment. Drugs were administrated on day 4. All the mice were injected in the home cage and perfused 15 min after injection.
6-OHDA Lesion
Drd2-EGFP mice were anaesthetized with a mixture of ketamine (Imalgene 500, 50 mg/ml, Merial), 0.9% NaCl solution (weight/vol), and xylazine (Rompun 2%, 20 mg/ml, Bayer) (2:2:1, i.p., 0.1 ml/30 g) and mounted on a stereotaxic apparatus. The surface of the skull was exposed and a hole was drilled at the appropriate coordinates. A cannula connected to a Hamilton 0.5 μl microsyringe was stereotaxically lowered to the VTA. The following coordinates were used: AP = −3.16, L = −0.55, and V = −4.5 (Franklin and Paxinos, 2007). A volume of 0.25 μl of 6-OHDA*HCl (3 μg/μl of free base, dissolved in ascorbic acid 0.02%) was unilaterally injected at a rate of 0.05 μl/min. The intra VTA microinjection of 6-OHDA was preceded (30 min) by administration of desipramine (20 mg/kg, i.p.) to avoid degeneration of noradrenergic fibers. Following injection the cannula was left in place for another 4 min before retraction. Mice were allowed to recover for a period of two 2 weeks before experiments.
Tissue Preparation and Immunofluorescence
Mice were rapidly anaesthetized with pentobarbital (500 mg/kg, i.p., Sanofi-Aventis, France) and transcardially perfused with 4% (weight/vol.) paraformaldehyde in 0.1 M sodium phosphate buffer (pH 7.5). Brains were post-fixed overnight in the same solution and stored at 4°C. Thirty μm-thick sections were cut with a vibratome (Leica, France) and stored at −20°C in a solution containing 30% (vol/vol) ethylene glycol, 30% (vol/vol) glycerol, and 0.1 M sodium phosphate buffer, until they were processed for immunofluorescence. Sections were processed as follows: Day 1: free-floating sections were rinsed in Tris-buffered saline (TBS; 0.25 M Tris and 0.5 M NaCl, pH 7.5), incubated for 5 min in TBS containing 3% H2O2 and 10% methanol, and then rinsed three times for 10 min each in TBS. After 15 min incubation in 0.2% Triton X-100 in TBS, sections were rinsed three times in TBS again. Finally, they were incubated overnight at 4°C with the different primary antibodies. For detection of phosphorylated proteins, 50 mM NaF was included in all buffers and incubation solutions. Slices were then incubated overnight or 72 h at 4°C with the following primary antibodies: chicken, mouse and rabbit anti-GFP (1:500 and 1:1000, respectively, Invitrogen), rabbit anti-vesicular glutamate transporter 1 (VGluT1) or anti-VGluT2 (1:1000), rabbit anti-calretinin (1:1000, Swant), mouse and rabbit anti-tyrosine hydroxylase (TH) (1:1000, Millipore), rat anti-dopamine transporter (DAT) (1:1000, Millipore), mouse anti-DARPP-32 (1:1000 gift from P. Greengard), rabbit against diphospho-Thr-202/Tyr-204-ERK1/2 (1:400, Cell Signaling Technology). Sections were rinsed three times for 10 min in TBS and incubated for 45 min with goat Cy2-, Cy3-, and Cy5-coupled (1:500, Jackson Lab) and/or goat A488 (1:500, Invitrogen). Sections were rinsed for 10 min twice in TBS and twice in TB (0.25 M Tris) before mounting in 1,4-diazabicyclo-[2.2.2]-octane (DABCO, Sigma-Aldrich).
Confocal microscopy and image analysis were carried out at the Montpellier RIO Imaging Facility. All images covering the entire NAc were single confocal sections, acquired using sequential laser scanning confocal microscopy (Zeiss LSM780) and stitched together as a single image. Double-labeled images from each region of interest were also single confocal sections obtained using sequential laser scanning confocal microscopy (Zeiss LSM510 META and Zeiss LSM780). Photomicrographs were obtained with the following band-pass and long-pass filter setting: GFP/Cy2 (band pass filter: 505–530), Cy3 (band pass filter: 560–615), and Cy5 (long-pass filter 650). GFP-labeled neurons were pseudocolored cyan or green and other immunoreactive markers were pseudocolored red or magenta. From the overlap of cyan and red or green and magenta, double-labeled neurons appeared white. Images used for quantification were all single confocal sections. The objectives and the pinhole setting (1 airy unit) remain unchanged during the acquisition of a series for all images. The thickness of the optical section is ~1.6 μm with a 20× objective and ~6 μm with a 10× objective. P-ERK-positive cells were quantified in zones or regions of the same area (630 × 630 μm or 1273 × 1273 μm) in every shell subterritories delineated in each slice by TH immunoreactivity (Tables A1, A2). A similar analysis was performed to evaluate the percentage of GFP-positive cells expressing DARPP-32 in the different BAC transgenic mice used. Quantification of immunoreactive cells was performed using the cell counter plugin of the ImageJ software taking as standard reference a fixed threshold of fluorescence.
Delineation of NAc Core and NAc Shell Subterritories
Coronal sections, in which the core-shell boundary was clearly visible, between bregma 1.34 and 0.98 mm, were selected for analysis (Franklin and Paxinos, 2007). The NAc core and shell delineation was done based upon calbindin-D 28 kDa (strongly enriched in the core compared to the shell) and calretinin immunostainings (strongly enriched in the shell compared to the core). In addition to the differential expression of GFP in the different mouse lines used, the delineation of the substructures of the NAc shell was based upon a combination of markers including TH, DAT, VGluT1, VGluT2, and calretinin immunoreactivities. The striatal-enriched phosphoprotein DARPP-32 was used to identify MSNs (Ouimet et al., 1984).
Statistical Analysis
Data were analyzed using one-way ANOVA, where treatment was the independent variable, followed by Dunnett's post hoc test for specific comparisons. Differences were considered significant when p < 0.05.
Results
Topographical Organization of D1R- and D2R-Expressing MSNs in the NAc
The analysis of GFP fluorescence in Drd1a-EGFP and Drd2-EGFP mice showed a relatively uniform appearance in the NAc core (Figures 1A, 2A). As previously observed, D1R- and D2R-expressing MSNs were homogeneously distributed in the NAc core and all the GFP-positive neurons were DARPP-32-immunoreactive MSNs with the exception of ChAT interneurons identified in Drd2-EGFP mice (data not shown; Bertran-Gonzalez et al., 2008; Matamales et al., 2009). Altogether, these observations revealed that D1R- and D2R-MSNs in the NAc core lack anatomical segregation, displaying instead a mixed organization that resembles that of the dorsal striatum.
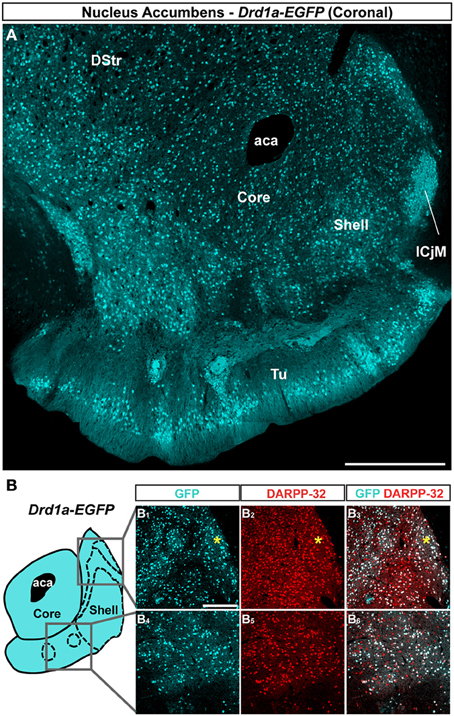
Figure 1. Topographical distribution of GFP immunofluorescence in the NAc of Drd1a-EGFP mice. (A) Distribution of GFP in the NAc of Drd1a-EGFP BAC transgenic mice. Single confocal sections were stitched together as a single image. Scale bar: 500 μm. DStr, dorsal striatum; aca, anterior commissure; ICjM, islands of Calleja major; Tu, olfactory tubercles. (B) Schematic illustration of the different accumbal subterritories analyzed (see Figure A1). Cyan in the diagram represents distribution of GFP-expressing cells. A zone homogenously cyan means the GFP is homogenously distributed. Note that D1R-containing MSNs show a relative homogeneous distribution. Single scan confocal images stained for GFP (cyan) and DARPP-32 (red), a marker of MSNs in the dorsal caudomedial (GFP, B1; DARPP-32, B2; merge, B3) and ventral (GFP, B4; DARPP-32, B5; merge, B6) part of the shell of Drd1a-EGFP mice. Images shown are representative of all Drd1a-EGFP BAC transgenic mice analyzed (n = 4). Yellow asterisk identifies the D2R-expressing MSNs-poor zone. Scale bar: 200 μm.
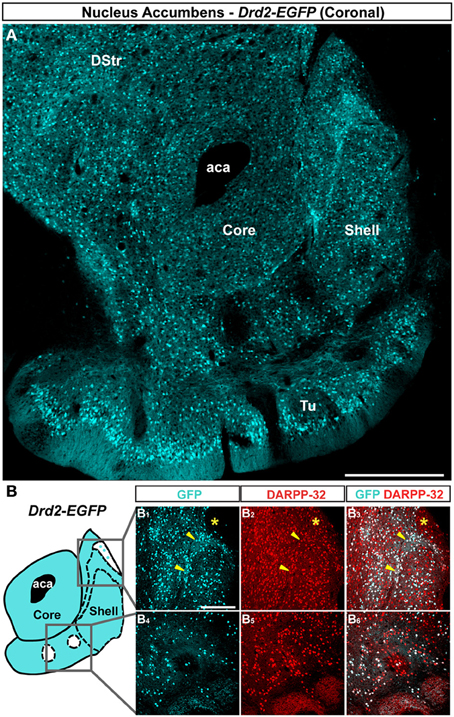
Figure 2. Topographic distribution of GFP immunofluorescence in the NAc of Drd2-EGFP mice. (A) Distribution of GFP in the NAc of Drd2-EGFP BAC transgenic mice. Single confocal sections were stitched together as a single image. Scale bar: 500 μm. DStr, dorsal striatum; aca, anterior commissure; Tu, olfactory tubercles. (B) Schematic illustration of the different accumbal subterritories analyzed (see Figure A1). Cyan in the diagram represents distribution of GFP-expressing cells. A zone homogenously cyan means the GFP is homogenously distributed. White means lack of GFP expression throughout the zone and dots indicate that few GFP cells are detected throughout the zone. Note that D2R-expressing MSNs exhibit inhomogeneous distributions in the NAc shell. In the caudomedial NAc shell (1) a bundle-shaped area and (2) a D2R-expressing MSNs-poor zones (white) in the upper part of the caudomedial shell (cyan) can be visualized. In the ventral shell, two zones lacking D2R-expressing MSNs (white) can be delineated. Single scan confocal images stained for GFP (cyan) and DARPP-32 (red), a marker of MSNs, in the dorsal caudomedial (GFP, B1; DARPP-32, B2; merge, B3) and ventral (GFP, B4; DARPP-32, B5; merge, B6) part of the shell of Drd2-EGFP mice. Images shown are representative of all Drd2-EGFP BAC transgenic mice analyzed (n = 5). Yellow asterisk identifies the D2R-expressing MSNs-poor zone. Yellow arrowheads identify the bundle-shaped area. Scale bar: 200 μm.
On coronal sections used in this study, the core is surrounded on its medial, ventral and lateral sides by the shell (Figures 1A, 2A). As in the NAc core, no apparent organization was observed in the NAc shell in Drd1a-EGFP mice (Figure 1A). All D1R-expressing neurons were DARPP-32-positive in the medial, ventral and lateral shell (Figure 1B and data not shown) confirming they are all MSNs (Bertran-Gonzalez et al., 2008). In contrast, a complex and inhomogeneous distribution of D2R-expressing MSNs was observed in the shell in Drd2-EGFP mice (Figures 2, A1). The heterogeneous distribution of D2R-expressing neurons was particularly evident in the medial and ventral shell (Figure 2A). Thus, in the dorsal caudomedial part of the shell, several subterritories have been identified (Figure A1): (1) the “cone” region (Todtenkopf and Stellar, 2000), (2) a bundle-shaped area also termed corridors (Seifert et al., 1998), and (3) a D2R-expressing MSNs-poor zone in the upper part of caudomedial shell (Figures 2A,B,A1). In the ventral shell, D2R-lacking MSNs areas expressing DARPP-32-positive MSNs were identified (Figures 2A,B). A similar distribution was observed in Drd2-Cre mice crossed with the RCE:LoxP reporter line (Miyoshi et al., 2010) (data not shown).
Topographical Organization of A2aR-Expressing MSNs in the NAc
Striatopallidal MSNs of the dorsal striatum express D2R and A2aR (Gerfen et al., 1990; Schiffmann et al., 1991; Fink et al., 1992; Le Moine and Bloch, 1995). We therefore analyzed the distribution of A2aR-expressing neurons in the NAc using Adora2a-Cre mice (Durieux et al., 2009) crossed with the Rosa26:loxP reporter line. In the NAc core, A2aR-expressing MSNs were homogeneously distributed (Figure 3A). As observed in Drd2-EGFP mice, a heterogeneous distribution of A2aR-expressing neurons was particularly evident in the medial and ventral shell (Figure 3A). Thus, GFP-positive cells that co-stained with DARPP-32 were detected in the bundle-shaped area as well as in the D2R-expressing MSNs-poor zone in the upper part of the caudomedial shell identified in Drd2-EGFP mice (Figure 3B). In the ventral shell, as observed in Drd2-EGFP mice, A2aR-lacking MSNs areas expressing DARPP-32-positive MSNs were identified (Figures 3A,B).
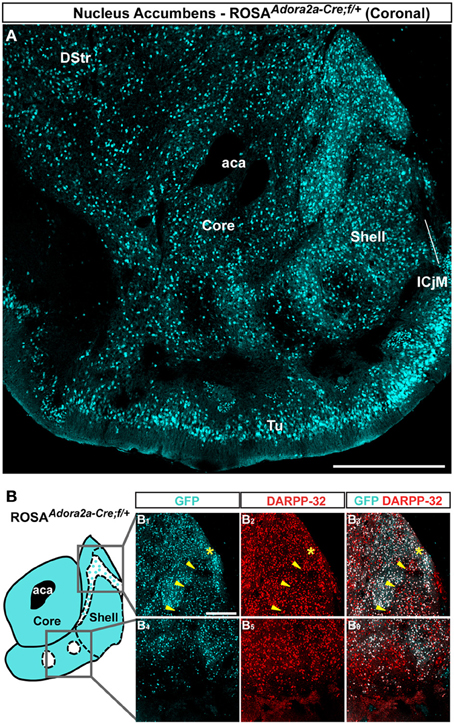
Figure 3. Topographic distribution of GFP immunofluorescence in the NAc of Adora2a-Cre mice crossed with the Rosa26:loxP reporter line. (A) Single confocal sections were stitched together as a single image. Scale bar: 500 μm. DStr, dorsal striatum; aca, anterior commissure; ICjM, islands of Calleja major; Tu, olfactory tubercles. (B) Schematic illustration of the accumbal subterritories analyzed (see Figure A1). Cyan in the diagram represents distribution of GFP-expressing cells. A zone homogenously cyan means the GFP is homogenously distributed. White means lack of GFP expression throughout the zone and dots indicate that few GFP cells are detected throughout the zone. Single scan confocal images showing double stained for GFP (cyan) and DARPP-32 (red) in the dorsal caudomedial (GFP, B1; DARPP-32, B2; merge, B3) and ventral (GFP, B4; DARPP-32, B5; merge, B6) part of the shell of Adora2a-Cre mice. Images shown are representative of all Adora2a-Cre BAC transgenic mice analyzed (n = 3). Yellow asterisk identifies the D2R-expressing MSNs-poor zone. Yellow arrowheads identify the bundle-shaped area. Scale bar: 200 μm.
Topographical Organization of D3R-Expressing MSNs in the NAc
Unlike the dorsal part of the striatum, the NAc appears to be the area where the D3R is expressed at the highest level (Sokoloff et al., 1990; Bouthenet et al., 1991; Diaz et al., 1995; Le Moine and Bloch, 1996). We therefore investigated the distribution of D3R-expressing cells in the NAc by assessing the distribution of GFP-positive neurons in Drd3-Cre mice (http://www.gensat.org/cre.jsp) crossed with the Rosa26:loxP reporter line (Srinivas et al., 2001). Only few scattered GFP-positive cells that co-stained with DARPP-32 were detected in the NAc core of Drd3-Cre mice (Figure 4A). GFP-immunoreactive cells were absent in the lateral part of the shell and the lateral half of the ventral part (Figures 4A,B). D3R-expressing neurons were heterogeneously distributed in the medial part of the shell and in the medial half of the ventral part of the NAc shell (Figure 4A). Thus, the highest density of D3R-expressing cells was confined to the caudomedial shell (Figures 4A,B) while only few and scattered GFP-immunoreactive neurons were observed in the bundle-shaped area (Figures 4A,B). Double-immunofluorescence revealed that the majority of D3R-positive cells were MSNs since they co-localized with DARPP-32 (Figure 4B).
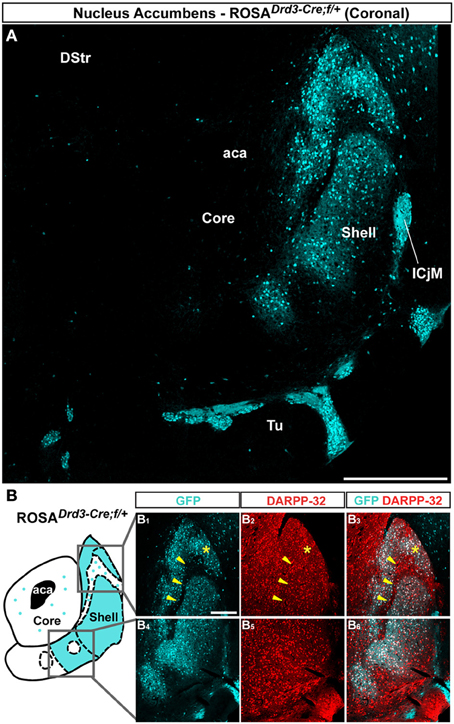
Figure 4. Topographic distribution of GFP immunofluorescence in the NAc of Drd3-Cre mice crossed with the Rosa26:loxP reporter line. (A) Single confocal sections were stitched together as a single image. Scale bar: 500 μm. DStr, dorsal striatum; aca, anterior commissure; ICjM, islands of Calleja major; Tu, olfactory tubercles. Note that GFP-positive cells are restricted to the caudomedial part of the NAc shell. Only sparse GFP-expressing cells were detected in the NAc core. (B) Schematic illustration of the accumbal subterritories analyzed (see Figure A1). Cyan in the diagram represents the distribution of GFP-expressing cells. A zone homogenously cyan means the GFP is homogenously distributed. White means lack of GFP expression throughout the zone and dots indicate that few GFP cells are detected throughout the zone. Single scan confocal images showing double stained for GFP (cyan) and DARPP-32 (red) in the dorsal caudomedial (GFP, B1; DARPP-32, B2; merge, B3) and ventral (GFP, B4; DARPP-32, B5; merge, B6) part of the shell of Drd3-Cre mice. Images shown are representative of all Drd3-Cre BAC transgenic mice analyzed (n = 2). Yellow asterisk identifies the D2R-expressing MSNs-poor zone. Yellow arrowheads identify the bundle-shaped area. Scale bar: 200 μm.
Characterization of GFP-Expressing Neurons in the Caudomedial Part of the NAc Shell
The bundle-shaped area and the D2R-expressing MSNs-poor zone of the upper part of the caudomedial shell displayed the most heterogeneous distribution pattern of MSNs in the mouse NAc. In an attempt to better characterize the accumbal circuitry in relationship to D1R-, D2R-, A2aR-, and D3R-expressing MSNs, we identified DARPP-32-positive MSNs in Drd1a-EGFP, Drd2-EGFP, Adora2a-Cre, and Drd3-Cre mice in these two subterritories and calculated the percentage of DARPP-32-immunostained neurons expressing GFP in each line.
In the bundle-shaped area, 72 ± 2% and 66 ± 3% of the DARPP-32 immunoreactive neurons were GFP-positive in Drd1a-EGFP and Drd2-EGFP mice, respectively (Figure 5A). Although these numbers were obtained from different mice, the proportion of MSNs expressing D1R, D2R, or both was therefore roughly estimated from these data by adding the percentage of DARPP-32-positive neurons, which were GFP-positive in Drd1a-EGFP and Drd2-EGFP mice. This estimation is based on the assumption that every MSN express either D1R, D2R, or both, as previously shown (Matamales et al., 2009). The summed percentages obtained in Drd1a-EGFP and Drd2-EGFP mice exceeding 100% were taken as an indication of co-expression. This estimation revealed a high degree of D1R/D2R co-localization (38%) (72% of DARPP-32/D1R + 66% of DARPP-32/D2R = 138%) in this NAc shell subterritory while 34% (72% of DARPP-32/D1R—38% of DARPP-32/D2R/D1R = 34%) and 28% (66% of DARPP-32/D2R—38% of DARPP-32/D2R/D1R = 28%) of MSNs could express only D1R and D2R, respectively (Figure 5A). Moreover, we found that only a small proportion of the MSNs (~10%) located in this area expressed D3R (Figure 5A).
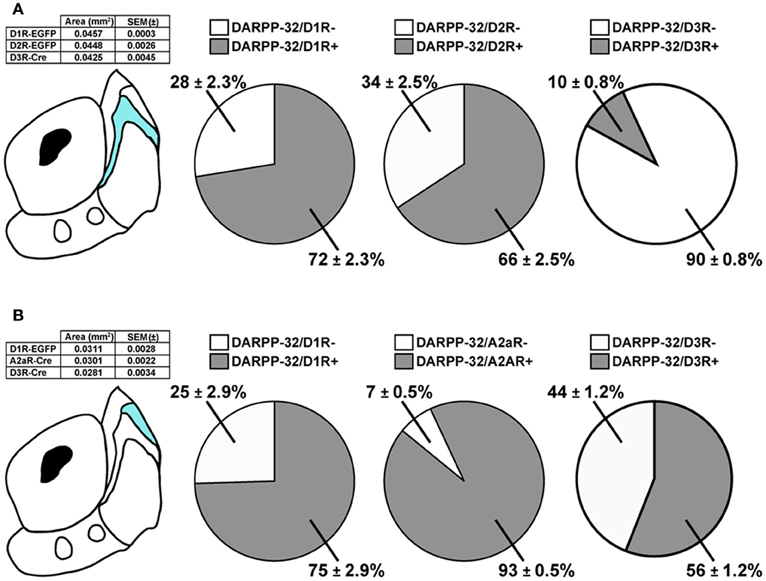
Figure 5. Expression of D1R-, D2R-, A2aR-, and D3R-containing MSNs in subterritories of the caudomedial NAc shell. (A) Percentage of DARPP-32-positive neurons expressing GFP in Drd1a-EGFP, Drd2-EGFP, and Drd3-Cre mice in bundle-shaped area of the caudomedial NAc shell. Quantifications were obtained from several images. Total number of MSNs counted: n = 950 MSNs in Drd1a-EGFP (eight hemispheres from four mice), n = 898 MSNs in Drd2-EGFP (eight hemispheres from four mice), and n = 629 MSNs in Drd3-Cre (eight hemispheres from two mice). The table summarizes the surface area analyzed for each mouse line. (B) Percentage of DARPP-32-positive neurons expressing GFP in Drd1a-EGFP, Adora2a-Cre, and Drd3-Cre mice in the D2R-expressing MSNs-poor zone of the caudomedial NAc shell. Quantifications were obtained from several images. Total number of MSNs counted: n = 329 MSNs in Drd1a-EGFP (six hemispheres from three mice), n = 349 MSNs in Adora2-Cre (six hemispheres from three mice), and n = 365 MSNs in Drd3-Cre (eight hemispheres from two mice). The table summarizes the surface area analyzed for each mouse line.
We performed the same analysis in the D2R-expressing MSNs-poor zone in the upper part of the caudomedial shell (Figure 5B). In this subregion, 75% of DARPP-32 immunoreactive neurons were found to be the GFP-positive in Drd1a-EGFP. However, the almost complete absence of D2R-expressing MSNs (~10%) raised the intriguing hypothesis that this subterritory is composed almost exclusively of D1R-containing MSNs. In the dorsal striatum D2R-containing MSNs co-express the adenosine A2aR (Schiffmann et al., 1991). We therefore analyzed the expression of GFP in Adora2-Cre mice (Durieux et al., 2009) crossed with the Rosa26:loxP reporter line (Srinivas et al., 2001). Surprisingly, we found that in the D2R-expressing MSNs-poor zone, 93% of DARPP-32-positive neurons were GFP-immunoreactive in Adora2a-Cre mice (Figure 5B). Using the same approach described above and if we assume that all MSNs of this subterritory express either D1R or A2aR or both, it can be estimated that 68% co-express both receptors (75% of DARPP-32/D1R + 93% of DARPP-32/A2aR = 168%), 7% (75% of DARPP-32/D1R—68% of DARPP-32/D1R/A2aR = 7%) of the MSNs express only D1R and 25% (93% of DARPP-32/A2aR—68% of DARPP-32/D1R/A2aR = 25%) express only A2aR. In addition, we also found that 56% of the DARPP-32-positive cells contained D3R (Figure 5B). However, all these calculations represent lower limits and should be taken with caution since it is not known whether some MSNs do not express either of these receptors.
Immunochemical Characterization of GFP-Expressing Neurons in the Caudomedial Part of the NAc Shell
The caudomedial part of the NAc shell exhibits inhomogeneous distribution patterns of various markers (Herkenham et al., 1984). We next assessed whether GFP distribution in Drd2-EGFP, Adora2a-Cre, and Drd3-Cre mice corresponded to cytoarchitecturally and cytochemically defined subterritories of the caudomedial part of the shell. Confirming previous studies, we observed that vesicular glutamate transporters 1 (VGluT1) and 2 (VGluT2) showed a complementary distribution in the NAc shell defining two well-separated neuronal circuits (Figures 6, 7) (Hartig et al., 2003). Thus, VGluT1 immunoreactivity was enriched in the bundle-shaped area where few D3R-expressing MSNs and an estimated high degree of D1R/D2R co-localization have been observed (Figure 6). In contrast, this subterritory was devoid of VGluT2-positive terminals and calretinin immunoreactivity (Figures 7A,B). On the other hand, in D2R-expressing MSNs-poor zone located in the upper part of the caudomedial shell, VGluT2-, and calretinin-positive fibers were dense whereas VGluT1 staining was weak (see the asterisks in Figures 6, 7). Interestingly, the pattern of TH immunoreactivity revealed a mosaic heterogeneity that resembled that of the VGluT2/calretinin distribution (Figure 8A). Therefore, the bundle-shaped area was identified as TH/DAT-poor area while the D2R-poor zone was stained by a dense plexus of TH/DAT fibers arising from the VTA (Figures 8B,C). It should be noted here that the remaining TH staining visible in the NAc shell following 6-OHDA-induced VTA lesion corresponded most likely to noradrenaline fibers arising from the locus coeruleus because they were devoid of DAT labeling (Figure 8C).
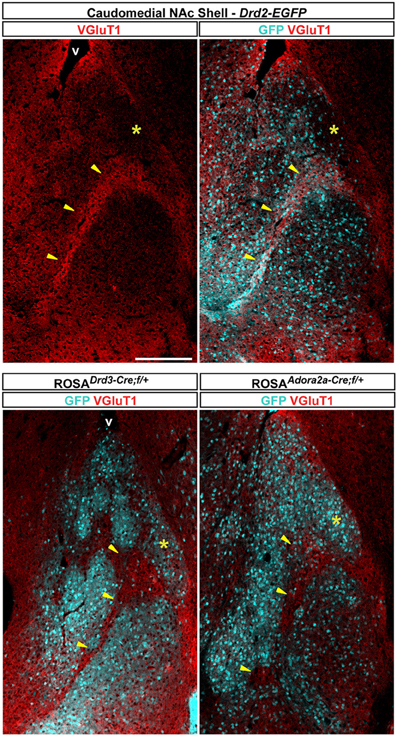
Figure 6. Distribution pattern of vesicular transporter 1 (VGluT1) in the caudomedial NAc shell. Distribution of VGluT1 (red) and GFP (cyan) immunofluorescence in the NAc of Drd2-EGFP, Drd3-Cre/Rosa26:loxP and Adora2a-Cre/Rosa26:loxP double transgenic mice. Images are single confocal sections. Yellow asterisk indicates the D2R-expressing MSNs-poor zone. Yellow arrowheads indicate the bundle-shaped area. Scale bar: 250 μm. v, ventricles.
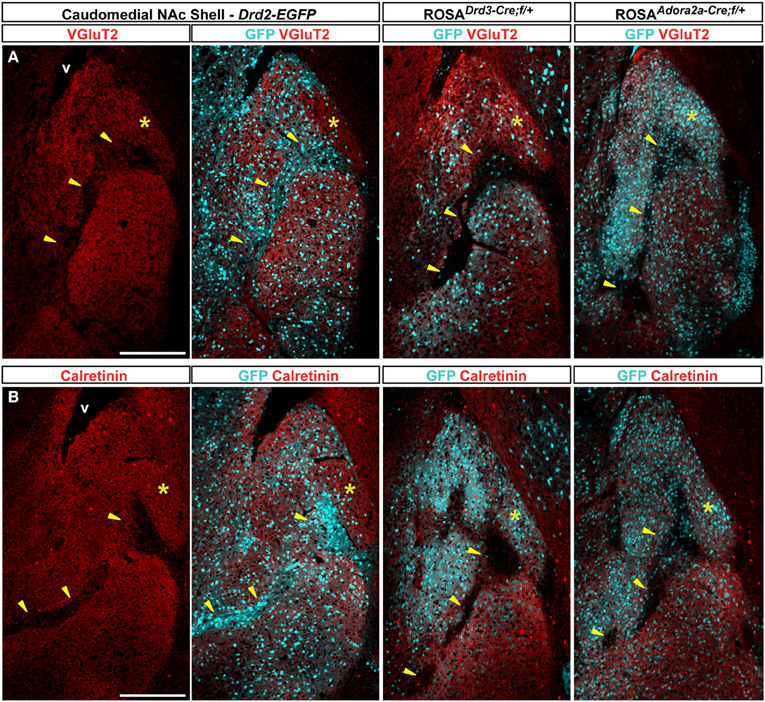
Figure 7. Distribution patterns of vesicular transporter 2 (VGluT2) and Calretinin in the caudomedial NAc shell. Distribution of VGluT2 (red) (A) or calretinin (red) (B) and GFP (cyan) fluorescence in the NAc of Drd2-EGFP, Drd3-Cre/Rosa26:loxP and Adora2a-Cre/Rosa26:loxP double transgenic mice. Images are single confocal sections. Yellow asterisk indicates the D2R-expressing MSNs-poor zone. Yellow arrowheads indicate the bundle-shaped area. Scale bar: 250 μm. v, ventricles.
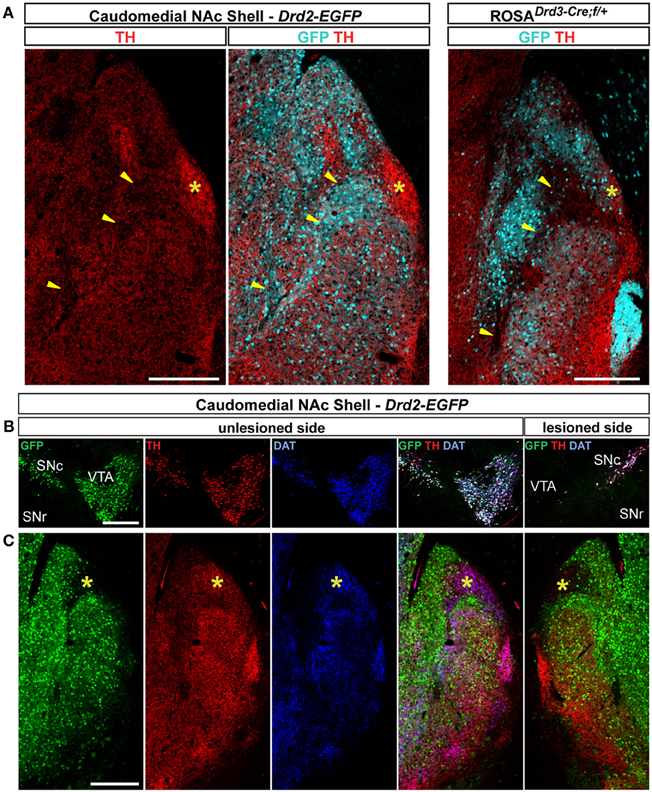
Figure 8. Distribution patterns of tyrosine hydroxylase (TH) and dopamine transporter (DAT) in the caudomedial NAc shell. (A) Distribution of TH (red) and GFP (cyan) fluorescence in the NAc of Drd2-EGFP and Drd3-Cre/Rosa26:loxP double transgenic mice. Yellow asterisk identifies the D2R-expressing MSNs-poor zone. Images are single confocal sections. Yellow arrowheads identify the bundle-shaped area. Scale bar: 250 μm. (B) Triple immunostaining for GFP (green), TH (red), and DAT (blue) allowed the identification of DA neurons on the unlesioned side of Drd2-EGFP mice. Note the lack of staining in the VTA on the lesioned side. Images are single confocal sections. Scale bar: 500 μm. (C) The same triple immunostaining performed at the caudomedial NAc shell level revealed the absence of DAT and a strong reduction of immunoreactive terminals in the D2R-expressing MSNs-poor zone (yellow asterisk). Images are single confocal sections. Scale bar: 250 μm.
Topographical and Cell-Type Regulation of ERK Phosphorylation in the NAc
Activated by a variety of therapeutic agents or drugs of abuse in physiological and pathological contexts, the ERK pathway has been proposed to play a critical role in the molecular mechanisms involved in dopamine-controlled striatal plasticity (Girault et al., 2007). Using Drd2-EGFP mice, we next analyzed the pattern of ERK phosphorylation following the administration of a D1R-like agonist (SKF81297, 5 mg/kg), a D2R-like agonist (quinpirole, 1 mg/kg), a non-selective dopamine receptor agonist (apomorphine, 3 mg/kg), and a D2R-like antagonist (raclopride, 0.3 mg/kg) in the core and in the various subterritories previously identified in the ventral and caudomedial part of the NAc shell.
NAc core
As previously reported (Bertran-Gonzalez et al., 2008), vehicle-treated mice showed sparse P-ERK positive neurons that were only D2R-negative (Figures 9, 10A). Double fluorescence analysis of mice perfused 15 min after SKF81297 administration revealed that ERK phosphorylation occurred exclusively in D2R-negative neurons (Figures 9, 10A). In contrast, mice injected with quinpirole showed an inhibition of the basal ERK phosphorylation (Figures 9, 10A). Although apomorphine treatment did not significantly increase the total number of P-ERK-positive neurons, it induced areas of intense ERK phosphorylation in the neuropil (Figures 9, 10A). Finally, raclopride-treated mice showed a robust increase of ERK phosphorylation that occurred essentially in D2R-negative MSNs and to a smaller extent in D2R-expressing MSNs (Figures 9, 10A).
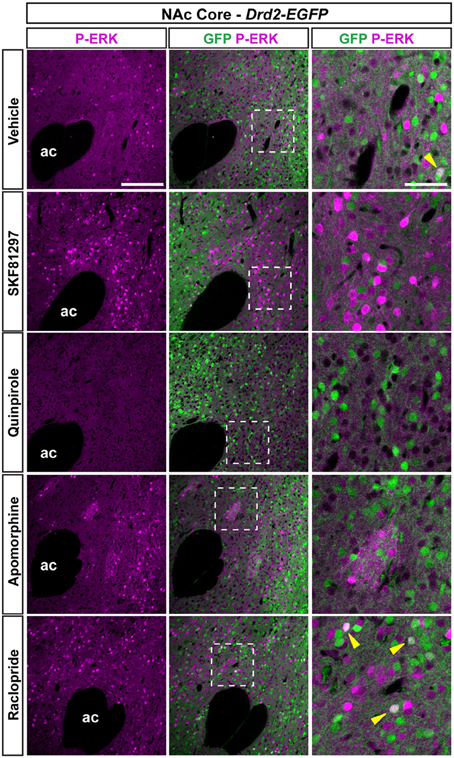
Figure 9. Regulation of ERK phosphorylation in the NAc core. Double immunofluorescence for P-ERK (magenta) and GFP (green) in the NAc Core of Drd2-EGFP mice treated with vehicle, SKF81297 (5 mg/kg), quinpirole (1 mg/kg), apomorphine (3 mg/kg), and raclopride (0.3 mg/kg). Scale bar: 200 μm. High magnification of the area delineated by the white dashed square. Yellow arrowheads identify D2R-expressing MSNs that contain P-ERK. Images are single confocal sections. Scale bar: 50 μm. Note that apomorphine-induced ERK phosphorylation in clusters that resemble the striosomal compartment.
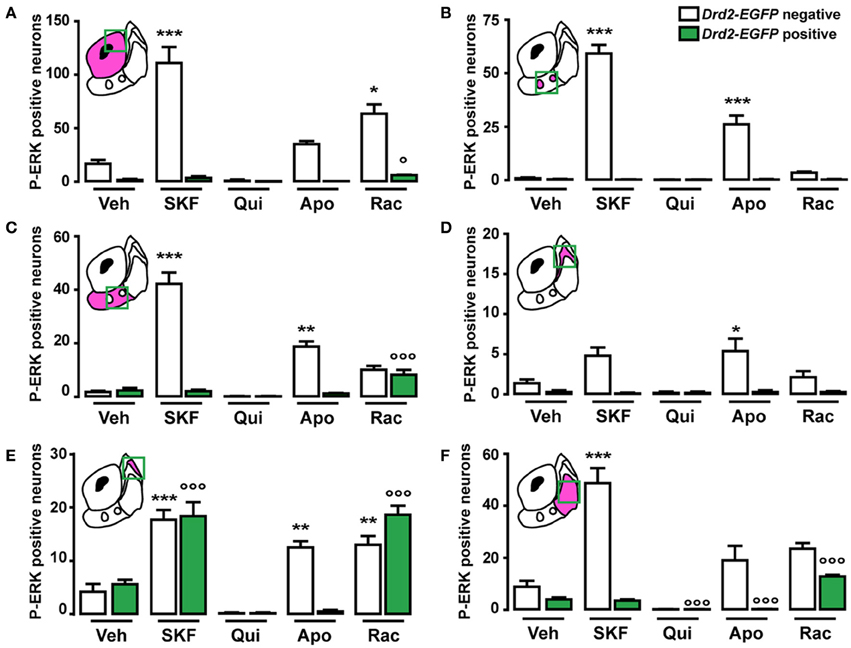
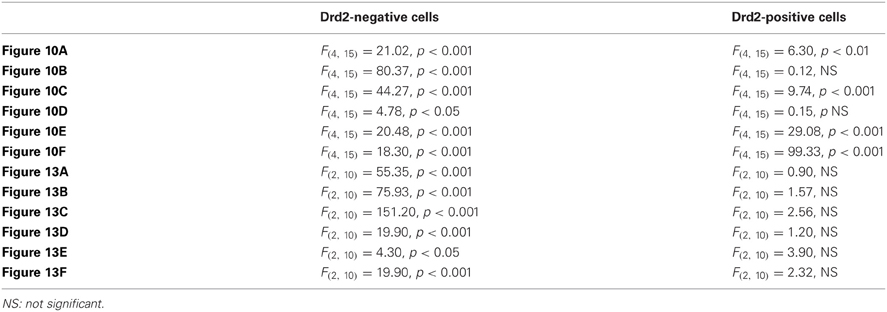
Figure 10. Topographical and cell-type specific regulation of P-ERK by SKF81297, quinpirole, apomorphine, and raclopride in the NAc. Quantification of P-ERK-positive cells among GFP-negative (white bars) and GFP-positive (green bars) neurons in the NAc core (A), in the ventral NAc shell [(B) D2R-expressing MSNs-poor zone and (C) area surrounding the D2R-expressing MSNs-poor zone] and in the caudomedial NAc shell [(D) D2R-expressing MSNs-poor zone; (E) bundle-shaped area; and (F) cone] in Drd2-EGFP mice, 15 min after vehicle (Veh), SKF81297 (SKF), quinpirole (Qui), apomorphine (Apo), and raclopride (Rac) administration. Green squares in diagrams indicate the region analyzed. Data are number of cells per area (see Table A1) and are expressed as means ± SEM (3–5) and were analyzed using one-way ANOVA (see Table A3 for F values). Dunnett's test: *p < 0.05, **p < 0.01, ***p < 0.001 veh vs. drugs in Drd2-EGFP negative, °p < 0.05, °°°p < 0.001 veh vs. drugs in Drd2-EGFP positive.
NAc ventral and caudomedial shell
Only few scattered P-ERK positive cells were detected in the ventral shell of vehicle-treated mice (Figures 10B,C, 11A). An inhomogeneous distribution was observed in the caudomedial part: basal ERK phosphorylation was observed in both D2R-positive and -negative MSNs in the bundle-shaped area enriched in D1R/D2R-co-expressing cells (Figures 10D–F, 12A), whereas P-ERK immunoreactivity was detected mostly in D1R-expressing neurons of the D2R-MSNs-poor zone and in the rest of the caudomedial shell. SKF81297 administration markedly increased the number of P-ERK-positive neurons in all subterritories of the ventral and the caudomedial shell with the exception of the D2R-expressing MSNs-poor zone (Figures 10B–F, 11A,B, and 12A). P-ERK immunoreactivity was detected only in D2R-negative cells, except in the bundle-shaped area where it was found in both cell types (Figure 10). Although less pronounced, a similar pattern of ERK activation was observed with apomorphine (Figures 10B–F, 11). The main difference concerned the cell-type specificity of ERK activation, which was restricted to D2R-negative cells in the bundle-shaped area (Figure 10E). As previously observed in the dorsal striatum (Gangarossa et al., 2012) and in the NAc core, quinpirole failed to induce ERK phosphorylation in any subterritory of the caudomedial and ventral shell analyzed (Figures 10B–F, 11). Finally, mice treated with raclopride also displayed a specific pattern of ERK activation: raclopride increased ERK phosphorylation in both D2R-negative and positive cells in the bundle-shaped area of the caudomedial shell whereas no change was found in the D2R-expressing MSNs-poor zones (Figures 10B,E, 11). P-ERK immunoreactivity was also slightly increased in the “cone” and ventral shell where a significant effect was observed in D2R-containing neurons (Figures10B,F, 12B).
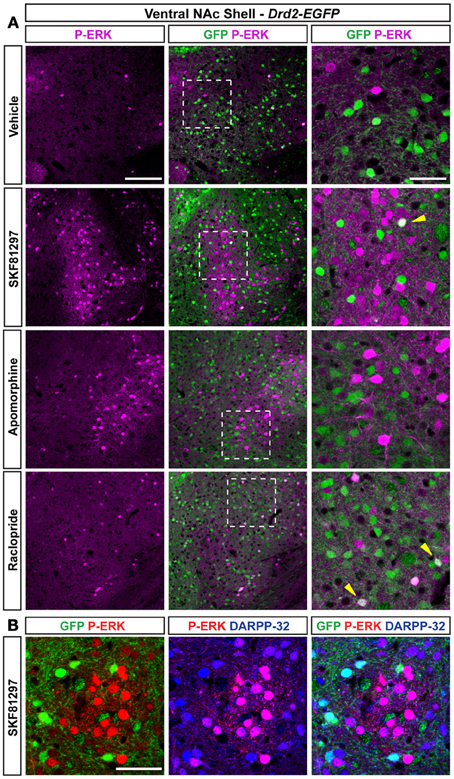
Figure 11. Regulation of ERK phosphorylation in the ventral NAc shell. (A) Double immunofluorescence for P-ERK (magenta) and GFP (green) in the NAc ventral shell of Drd2-EGFP mice treated with vehicle, SKF81297 (5 mg/kg), apomorphine (3 mg/kg), and raclopride (0.3 mg/kg). Scale bar: 100 μm. High magnification of the area delineated by the white dashed square. Yellow arrowheads indicate D2R-expressing MSNs that contain P-ERK. Images are single confocal sections. Scale bar: 50 μm. (B) P-ERK immunoreactivity (red) was detected together with DARPP-32 (blue) and GFP (green) immunoreactivities in the D2R-expressing MSNs-poor zone located in the ventral shell of Drd2-EGFP mice treated with SKF81297 (5 mg/kg) in a triple fluorescence analysis. Images are single confocal sections. Note that all P-ERK-positive cells co-localize with DARPP-32. Scale bar: 50 μm.
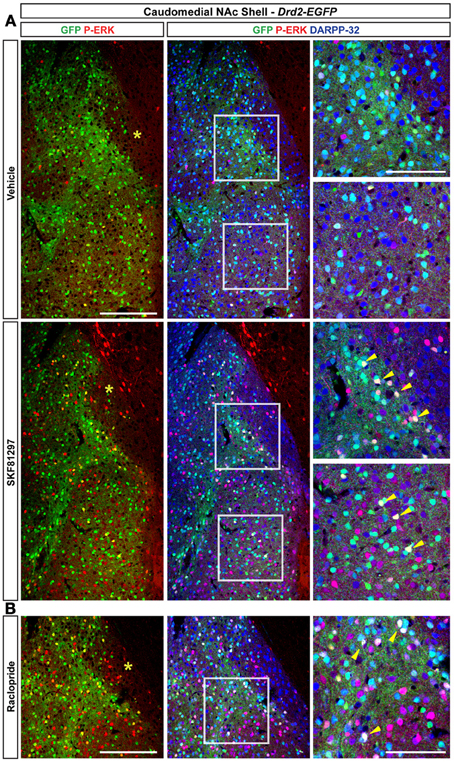
Figure 12. Regulation of ERK phosphorylation in the caudomedial NAc shell. (A) Triple immunofluorescence for P-ERK (red), GFP (green), and DARPP-32 (blue) in the caudomedial NAc shell of Drd2-EGFP mice treated with vehicle and SKF81297 (5 mg/kg) (A) and raclopride (B). Images are single confocal sections. Scale bar: 200 μm. High magnification of the area delineated by the white squares. Scale bar: 100 μm. Yellow asterisk indicates the D2R-expressing MSNs-poor zone. Yellow arrowheads indicate P-ERK/GFP/DARPP-32 positive neurons.
Specific Topographical and Cell-Type Regulation of Psychostimulant-Induced ERK Phosphorylation in the NAc
Acute cocaine treatment increases ERK phosphorylation in D1R-containing MSNs in the dorsal striatum and the NAc (Bertran-Gonzalez et al., 2008). Because of the inhomogeneous distribution of D1R- and D2R-expressing output neurons in the NAc, we examined the patterns of P-ERK-positive neurons taking into account the accumbal subterritories. A single injection of cocaine (15 mg/kg) or d-amphetamine (10 mg/kg) increased the number of P-ERK-positive neurons in D1R-containing MSNs in the NAc core (Figure 13A). In contrast, a more complex pattern of cocaine-induced ERK phosphorylation was observed within the NAc shell subterritories (Figures 13B–G). In the ventral part of the shell, cocaine increased ERK phosphorylation only in the zones lacking D2R-expressing MSNs while d-amphetamine also increased it in the surrounding area (Figures 13B,C,G). The analyses performed in the caudomedial part of the shell revealed that cocaine and d-amphetamine triggered almost similar patterns of ERK activation (Figures 13D–G). Thus, increased ERK phosphorylation restricted to D2R-negative MSNs was observed in the bundle-shaped area and the “cone” following administration of cocaine or d-amphetamine (Figures 13D,F,G). On the other hand, cocaine at this dose failed to activate ERK in the D2R-expressing MSNs-poor zone while d-amphetamine induced a weak increase (Figures 13E,G).
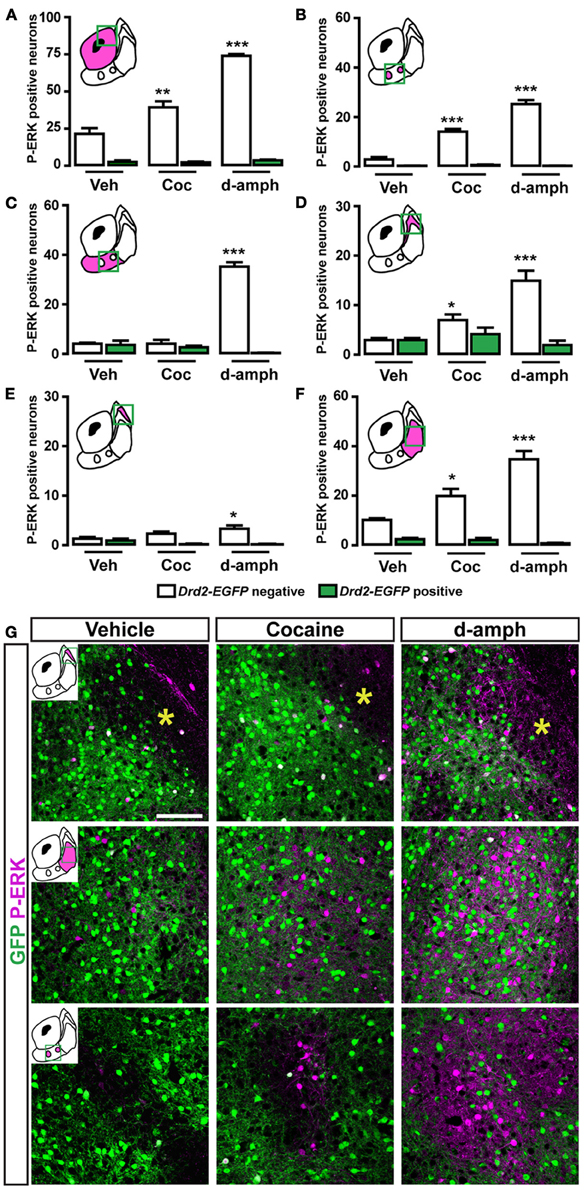
Figure 13. Topographical and cell-type specific regulation of P-ERK by cocaine and d-amphetamine in the NAc. (A–F) Quantification of P-ERK positive cells among GFP-negative (white bars) and GFP-positive (green bars) neurons in the NAc core (A), in the ventral NAc shell [(B) D2R-expressing MSNs-poor zone and (C) area surrounding the D2R-expressing MSNs-poor zone] and in the caudomedial NAc shell [(D) bundle-shaped area; (E) D2R-expressing MSNs-poor zone; and (F) cone] in Drd2-EGFP mice, 15 min after vehicle (Veh), cocaine (Coc), and d-amphetamine (d-amph) administration. Note that cocaine- and d-amphetamine-induced ERK activation is restricted to D1R-expressing MSNs. Yellow asterisk indicates the D2R-expressing MSNs-poor zone. Green squares in diagrams indicate the region analyzed. Data are number of cells per area (see Table A2) and are expressed as means ± SEM (4–5) and were analyzed using one-way ANOVA (see Table A3 for F values). Dunnett's test: *p < 0.05, **p < 0.01, ***p < 0.001 veh vs. drugs in Drd2-EGFP negative. (G) Double immunofluorescence for P-ERK (magenta) and GFP (green) in various subterritories of the NAc shell in Drd2-EGFP mice treated with vehicle, cocaine (15 mg/kg) and d-amphetamine (10 mg/kg). Images are single confocal sections. Scale bar: 100 μm.
Discussion
Recent advances in technologies for the identification of specific cell types, including BAC transgenic mice expressing fluorescent reporter or the Cre recombinase, allow a more comprehensive understanding of the involvement of D1R- and D2R-expressing MSNs in various physiological and pathological conditions. Although, potential caveats or difficulties in using such approaches have to be taken into account (i.e., incomplete and/or ectopic expression depending on the insertion site of the transgenes) (Gong and Yang, 2005), a careful identification and characterization of the mouse line that produces expression patterns matching that of the endogenous gene should avoid overstated conclusions. By using various BAC transgenic mice (Drd1a-EGFP, Drd2-EGFP, Drd3-Cre, and Adora2-Cre) combined with several immunohistochemical markers, we reveal a high level of heterogeneity of the NAc shell cellular organization. In the NAc core as in the adjacent dorsal striatum, D1R- and D2R-expressing MSNs appear to be randomly distributed. In contrast, in the ventral and the caudomedial part of the NAc shell, D1R- and D2R-expressing MSNs exhibit an inhomogeneous distribution. Identified patterns are closely associated with specific accumbal subterritories previously delineated by specific neurochemical markers. Figure A1 summarizes the main differences between the subterritories. Moreover, our results support the hypothesis that the heterogeneous composition of the NAc can be functionally important as illustrated by the distinct patterns of ERK activation triggered by pharmacological treatments.
The Bundle-Shaped Area
Generally seen as an integral part of the striatal complex, the identification of several anatomical features has led to propose that the NAc was an independent functional entity. Beyond the well-known NAc core and shell compartmentalization, selective markers and tract–tracing studies performed in rats allowed the identification of multiple accumbal shell subterritories (Zahm and Brog, 1992). Among them, cell clusters (Herkenham et al., 1984) or “corridors” (Seifert et al., 1998) have been identified in the caudomedial shell in the border region between the core and shell. Characterized by an enrichment of opioid receptors and low staining for acetylcholinesterase, substance P, and enkephalin (Herkenham et al., 1984; Voorn et al., 1989), the bundle-shaped area is also avoided by terminals originating from the ventral subiculum (Groenewegen et al., 1987), the infralimbic cortex (Berendse et al., 1992) and the paraventricular thalamic nucleus that are identified by VGluT2/calretinin immunoreactivity (Hartig et al., 2003). In addition, dopaminergic projections from the VTA also poorly innervate the bundle-shaped area as demonstrated by the weak density of dopamine, TH and DAT immunoreactive terminals (Voorn et al., 1989; Jansson et al., 1999, and present study). The paucity of these extrinsic afferent projections within the bundle-shaped area largely contributed to put forward the hypothesis that this accumbal subterritory would constitute a way-station favoring intrinsic information processing (Herkenham et al., 1984). However, the demonstration of a dense plexus of VGluT1 immunopositive fibers arising from the prelimbic cortex and the caudal parvicellular basal amygdaloid nucleus (Berendse et al., 1992; Wright and Groenewegen, 1996; Wright et al., 1996; Hartig et al., 2003) strongly supports the idea that MSNs located in the bundle-shaped area could also integrate and process specific cortical and subcortical information.
Our study clearly points out that the bundle-shaped area also displays several specific features regarding the distribution pattern of D1R- and D2R-expressing MSNs. Thus, this area can be identified by an enrichment of GFP immunofluorescence in Drd2-EGFP mice and a low number of D3R-containing MSNs (10% of all DARPP-32 immunoreactive cells). Interestingly, our estimated percent of D1R/D2R co-expression of 38% was roughly 2-fold higher than our previous evaluation in the whole NAc shell (Bertran-Gonzalez et al., 2008; Matamales et al., 2009). Although informative, these estimations should be taken with caution since numbers were obtained from different mice and calculations were based on the assumption that every MSN express either D1R or D2R or both in the case of the bundle-shaped area and either D1R or A2aR or both in the case of the D2R-expressing MSNs-poor zone in the caudomedial shell. Because recent studies suggest that MSNs co-expressing both receptors display unique signaling properties (Perreault et al., 2010, 2011), the bundle-shaped area would therefore represent an ideal anatomical substrate where D1R-D2R heteromers-dependent signaling could preferentially take place. In light of these observations, it is interesting to note that, because of the low TH and DAT expression, previous studies proposed that dopaminergic transmission in the bundle-shaped area results from a non-synaptic, volume transmission type of DA communication (Garris et al., 1994; Jansson et al., 1999). Further studies will be therefore necessary to determine whether DA-dependent signaling in the bundle-shaped area results in a prolonged action of DA as a consequence of a slow diffusion into the extracellular space following DA release from the rich surrounding DA networks.
D2R-Expressing MSNS-Poor Zones
Another level of compartmentalization of the NAc shell results from the existence of D2R-expressing MSNs-poor zones. Such areas located in the ventral shell have been identified. These zones contain neither A2aR nor D3R as demonstrated by the absence of GFP in the Adora2-Cre and Drd3-Cre mice, respectively. Therefore, the high number of DARPP-32-immunoreactive cells suggests that these D2R-expressing MSNs-poor zones are composed almost exclusively of D1R-contaning MSNs. It must be noted that the other histochemical markers used in previous or present studies did not allow the identification of this specific shell subterritory. Whether these clusters exhibit other particular features remains to be determined.
The second D2R-expressing MSNs-poor zone is located in the upper part of the caudomedial part of the shell. Identified as VGluT2-, calretinin-, TH/DAT-rich zone, this small area receives massive inputs from the paraventricular thalamic nucleus, the infralimbic cortex, and the VTA (Herkenham et al., 1984; Berendse et al., 1992; Groenewegen et al., 1999; Jansson et al., 1999; Hartig et al., 2003). Surprisingly, while D1R-expressing neurons represented 75% of DARPP-32-positive neurons, 93% of the MSNs in this area were GFP-positive in Adora2a-Cre mice suggesting (1) the existence of MSNs co-expressing D1R and A2aR and (2) the lack of co-localization between A2aR and D2R, which is normally observed in the dorsal striatum and others accumbal regions. These observations have important functional implications since the reciprocal antagonistic interactions between A2aR and D2R should not occur. This contrasts with the dorsal striatum, in which the co-expressed D2R and A2aR interact either directly, to form heteromers, or indirectly, at the level of adenylyl cyclase, to trigger the activation of specific signaling cascades (Ferre et al., 2011). Interestingly, half of the DARPP-32-containing neurons of this subterritory also express D3R suggesting that MSNs located in this area display a high degree of D1R, A2aR, and D3R co-expression. Whether this accumbal subterritory constitutes a “hot spot” where these receptors could interact and form functional D1R-D3R and A2aR-D3R heteromeric complexes will require further investigations (Torvinen et al., 2005; Fiorentini et al., 2008; Marcellino et al., 2008).
Functional Aspects of MSNs Distribution in the NAc: Impact on ERK Activation
The pharmacological, physiological and pathological regulation of the ERK pathway in striatal and accumbal MSNs has been extensively studied (Girault et al., 2007; Santini et al., 2008; Gangarossa et al., 2012). Our present findings demonstrate the existence of a topographical and cell-type specific regulation of the ERK cascade signaling in the NAc in response to SKF81297, quinpirole, and apomorphine. As in the dorsal striatum, stimulation of D2R by quinpirole administration inhibited basal ERK phosphorylation in D1R-containing MSNs most likely as a result of DA release inhibition through the activation of D2 autoreceptors (Mercuri et al., 1997; Centonze et al., 2002; Gangarossa et al., 2012).
Following selective D1R stimulation, the most striking difference concerned the cell-type selectivity. Our data indicate that following SKF81297 administration ERK activation occurred in both D2R-positive and negative neurons in the bundle-shaped area. The most parsimonious explanation is that D2R-expressing MSNs in which ERK activation occurred could also contain D1R, a hypothesis supported by the high degree of D1R/D2R co-localization (38%) in this zone and indirectly by our results obtained with apomorphine. In that case, ERK phosphorylation occurred exclusively in D2R-negative MSNs suggesting that when both D1R and D2R are stimulated in the MSNs co-expressing them, ERK activation does not occur. In line with this hypothesis, a recent study showed that the co-activation of both receptors within the dopamine D1R-D2R heteromers by the selective D1R-D2R heteromer agonist SKF83959 failed to increase ERK phosphorylation in the NAc (Perreault et al., 2012).
In the dorsal striatum, the blockade of D2R by haloperidol or raclopride activates ERK selectively in D2R-expressing striatopallidal MSNs (Bertran-Gonzalez et al., 2008, 2009). Our study reveals different principles of regulation in the NAc. Thus, raclopride-induced ERK phosphorylation was observed exclusively in D1R-expressing MSNs in the NAc core and in both D2R and D1R-MSNs in the NAc shell. In the dorsal striatum, haloperidol-induced ERK activation in D2R-expressing MSNs involved A2aR (Bertran-Gonzalez et al., 2009). Given that raclopride produces a marked increase in extracellular adenosine in the NAc (Nagel and Hauber, 2004), it is tempting to speculate that similarly to the dorsal striatum, A2aR contributes to ERK activation in D2R-containing MSNs of the NAc shell following raclopride administration. On the other hand, the increase of ERK phosphorylation in D1R-expressing MSNs could result from the ability of raclopride to enhance DA release in the NAc core and shell (Aragona et al., 2008).
As previously reported cocaine- and d-amphetamine-induced ERK phosphorylation in the NAc was always restricted to D1R-expressing MSNs (Bertran-Gonzalez et al., 2008; Gerfen et al., 2008). Our study highlights an additional level of complexity since we show here that psychostimulants trigger specific patterns of ERK activation, which vary in the accumbal subterritories analyzed. In the ventral shell, contrasting with d-amphetamine, cocaine administration induced a small increase in the number of ERK-positive cells, which was restricted to the D2R-expressing MSNs-poor zone. A subterritory-specific ERK phosphorylation was also observed in the caudomedial NAc shell. Thus, ERK activation is restricted to the bundle-shaped area and surrounding zones but absent from the D2R-expressing MSNs-poor zone located in the upper part of the caudomedial shell. Several mechanisms could explain why psychostimulant drugs trigger compartmentalized patterns of ERK phosphorylation. First, the segregated activation of ERK could be directly linked to the various combinatorial expressions of D1R, D2R, A2aR, and D3R within the different accumbal subterritories. Thus, MSNs located in the D2R-expressing MSNs-poor zone, which display a high degree of D1R, A2aR, and D3R expression would have distinct signaling properties than MSNs co-expressing only D1R and D2R. Second, the inhomogeneous release of DA in the NAc shell following psychostimulants administration could be also an important factor that would drive this specific pattern of ERK phosphorylation (Aragona et al., 2008). Interestingly, recent studies revealed that in the NAc shell, different populations of DA neurons might release glutamate eliciting therefore excitatory postsynaptic responses in MSNs innervated by these DA neurons (Stuber et al., 2010; Tecuapetla et al., 2010). Whether those particular DA neurons also participate in cocaine-induced ERK regulation will require further investigations. Finally, given that the glutamatergic transmission largely contributes to psychostimulant-evoked ERK activation in the NAc (Valjent et al., 2000, 2005; Pascoli et al., 2011), it is tempting to speculate that specific inputs arising from distinct cortical, subcortical, and thalamic areas play also a critical role in the establishment of the compartmentalized ERK phosphorylation induced by cocaine and d-amphetamine.
In conclusion, we demonstrate that the inhomogeneous distribution of D2R-expressing MSNs allows defining subterritories in the NAc shell, which exhibit particular neurochemical and inputs-specific features. Combined with our in vivo functional signaling analysis, our study highlights the importance to precisely determine the neuronal populations in which signaling pathways are activated in order to better understand how they are regulated and what their corresponding functions are.
Conflict of Interest Statement
The authors declare that the research was conducted in the absence of any commercial or financial relationships that could be construed as a potential conflict of interest.
Acknowledgments
This work was supported by Inserm and grants from ATIP-Avenir (Inserm), Sanofi-Aventis R&D, and from the Agence Nationale de la Recherche (ANR-2010-JCJC-1412) to Emmanuel Valjent. Research in Jean-Antoine Girault and Denis Hervé lab was supported by grants from the Fondation pour la recherche médicale (FRM), the Agence nationale de la recherche (ANR-BLAN08-1_346422), European Union Framework program 7 (FP7, SynSys), and the European research council (ERC). AdKdE is a Research Associate of the FRS-FNRS (Belgium) and is supported by FRS-FNRS (Belgium), FER from ULB, Action de Recherche Concertée from the CFWB. Julie Espallergues was a recipient of a postdoctoral fellowship from UM1. We are grateful to Laurent Fagni and Julie Perroy (Institut de Génomique Fonctionnelle) for providing some transgenic mice used in this study. We thank Fredéric Gallardo (IGF) and Natacha Roblot, Rachida Boukhari, and Yohann Bertelle (IFM) for animal care, breeding and genotyping.
References
Aragona, B. J., Cleaveland, N. A., Stuber, G. D., Day, J. J., Carelli, R. M., and Wightman, R. M. (2008). Preferential enhancement of dopamine transmission within the nucleus accumbens shell by cocaine is attributable to a direct increase in phasic dopamine release events. J. Neurosci. 28, 8821–8831.
Berendse, H. W., Galis-De Graaf, Y., and Groenewegen, H. J. (1992). Topographical organization and relationship with ventral striatal compartments of prefrontal corticostriatal projections in the rat. J. Comp. Neurol. 316, 314–347.
Bertran-Gonzalez, J., Bosch, C., Maroteaux, M., Matamales, M., Herve, D., Valjent, E., et al. (2008). Opposing patterns of signaling activation in dopamine D1 and D2 receptor-expressing striatal neurons in response to cocaine and haloperidol. J. Neurosci. 28, 5671–5685.
Bertran-Gonzalez, J., Hakansson, K., Borgkvist, A., Irinopoulou, T., Brami-Cherrier, K., Usiello, A., et al. (2009). Histone H3 phosphorylation is under the opposite tonic control of dopamine D2 and adenosine A2A receptors in striatopallidal neurons. Neuropsychopharmacology 34, 1710–1720.
Bertran-Gonzalez, J., Hervé, D., Girault, J. A., and Valjent, E. (2010). What is the degree of Segregation between Striatonigral and Striatopallidal Projections? Front. Neuroanat. 4:136. doi: 10.3389/fnana.2010.00136
Bouthenet, M. L., Souil, E., Martres, M. P., Sokoloff, P., Giros, B., and Schwartz, J. C. (1991). Localization of dopamine D3 receptor mRNA in the rat brain using in situ hybridization histochemistry: comparison with dopamine D2 receptor mRNA. Brain Res. 564, 203–219.
Centonze, D., Usiello, A., Gubellini, P., Pisani, A., Borrelli, E., Bernardi, G., et al. (2002). Dopamine D2 receptor-mediated inhibition of dopaminergic neurons in mice lacking D2L receptors. Neuropsychopharmacology 27, 723–726.
Diaz, J., Levesque, D., Lammers, C. H., Griffon, N., Martres, M. P., Schwartz, J. C., et al. (1995). Phenotypical characterization of neurons expressing the dopamine D3 receptor in the rat brain. Neuroscience 65, 731–745.
Durieux, P. F., Bearzatto, B., Guiducci, S., Buch, T., Waisman, A., Zoli, M., et al. (2009). D2R striatopallidal neurons inhibit both locomotor and drug reward processes. Nat. Neurosci. 12, 393–395.
Durieux, P. F., Schiffmann, S. N., and de Kerchove D'Exaerde, A. (2011). Differential regulation of motor control and response to dopaminergic drugs by D1R and D2R neurons in distinct dorsal striatum subregions. EMBO J. 31, 640–653.
Ferre, S., Quiroz, C., Orru, M., Guitart, X., Navarro, G., Cortes, A., et al. (2011). Adenosine A(2A) receptors and A(2A) receptor heteromers as key players in striatal function. Front. Neuroanat. 5:36. doi: 10.3389/fnana.2011.00036
Fink, J. S., Weaver, D. R., Rivkees, S. A., Peterfreund, R. A., Pollack, A. E., Adler, E. M., et al. (1992). Molecular cloning of the rat A2 adenosine receptor: selective co-expression with D2 dopamine receptors in rat striatum. Brain Res. Mol. Brain Res. 14, 186–195.
Fiorentini, C., Busi, C., Gorruso, E., Gotti, C., Spano, P., and Missale, C. (2008). Reciprocal regulation of dopamine D1 and D3 receptor function and trafficking by heterodimerization. Mol. Pharmacol. 74, 59–69.
Franklin, K., and Paxinos, G. (2007). The Mouse Brain in Stereotaxic Coordinates, 3rd Edn. Amsterdam: Elsevier.
Gangarossa, G., Perroy, J., and Valjent, E. (2012). Combinatorial topography and cell-type specific regulation of the ERK pathway by dopaminergic agonists in the mouse striatum. Brain Struct. Funct. doi: 10.1007/s00429-012-0405-6. [Epub ahead of print].
Garris, P. A., Ciolkowski, E. L., Pastore, P., and Wightman, R. M. (1994). Efflux of dopamine from the synaptic cleft in the nucleus accumbens of the rat brain. J. Neurosci. 14, 6084–6093.
Gerfen, C. R. (1992). The neostriatal mosaic: multiple levels of compartmental organization. Trends Neurosci. 15, 133–139.
Gerfen, C. R., Engber, T. M., Mahan, L. C., Susel, Z., Chase, T. N., Monsma, F. J. Jr., et al. (1990). D1 and D2 dopamine receptor-regulated gene expression of striatonigral and striatopallidal neurons. Science 250, 1429–1432.
Gerfen, C. R., Paletzki, R., and Worley, P. (2008). Differences between dorsal and ventral striatum in Drd1a dopamine receptor coupling of dopamine- and cAMP-regulated phosphoprotein-32 to activation of extracellular signal-regulated kinase. J. Neurosci. 28, 7113–7120.
Girault, J. A., Valjent, E., Caboche, J., and Herve, D. (2007). ERK2: a logical AND gate critical for drug-induced plasticity? Curr. Opin. Pharmacol. 7, 77–85.
Gong, S., and Yang, X. W. (2005). Modification of bacterial artificial chromosomes (BACs) and preparation of intact BAC DNA for generation of transgenic mice. Curr. Protoc. Neurosci. Chapter 5:Unit 5.21. doi: 10.1002/0471142301.ns0521s31
Gong, S., Zheng, C., Doughty, M. L., Losos, K., Didkovsky, N., Schambra, U. B., et al. (2003). A gene expression atlas of the central nervous system based on bacterial artificial chromosomes. Nature 425, 917–925.
Groenewegen, H. J., Vermeulen-Van Der Zee, E., Te Kortschot, A., and Witter, M. P. (1987). Organization of the projections from the subiculum to the ventral striatum in the rat. A study using anterograde transport of Phaseolus vulgaris leucoagglutinin. Neuroscience 23, 103–120.
Groenewegen, H. J., Wright, C. I., Beijer, A. V., and Voorn, P. (1999). Convergence and segregation of ventral striatal inputs and outputs. Ann. N.Y. Acad. Sci. 877, 49–63.
Hartig, W., Riedel, A., Grosche, J., Edwards, R. H., Fremeau, R. T. Jr., Harkany, T., et al. (2003). Complementary distribution of vesicular glutamate transporters 1 and 2 in the nucleus accumbens of rat: relationship to calretinin-containing extrinsic innervation and calbindin-immunoreactive neurons. J. Comp. Neurol. 465, 1–10.
Heimer, L., Zahm, D. S., Churchill, L., Kalivas, P. W., and Wohltmann, C. (1991). Specificity in the projection patterns of accumbal core and shell in the rat. Neuroscience 41, 89–125.
Herkenham, M., Edley, S. M., and Stuart, J. (1984). Cell clusters in the nucleus accumbens of the rat, and the mosaic relationship of opiate receptors, acetylcholinesterase and subcortical afferent terminations. Neuroscience 11, 561–593.
Humphries, M. D., and Prescott, T. J. (2010). The ventral basal ganglia, a selection mechanism at the crossroads of space, strategy, and reward. Prog. Neurobiol. 90, 385–417.
Jansson, A., Goldstein, M., Tinner, B., Zoli, M., Meador-Woodruff, J. H., Lew, J. Y., et al. (1999). On the distribution patterns of D1, D2, tyrosine hydroxylase and dopamine transporter immunoreactivities in the ventral striatum of the rat. Neuroscience 89, 473–489.
Jensen, J., McIntosh, A. R., Crawley, A. P., Mikulis, D. J., Remington, G., and Kapur, S. (2003). Direct activation of the ventral striatum in anticipation of aversive stimuli. Neuron 40, 1251–1257.
Jongen-Relo, A. L., Groenewegen, H. J., and Voorn, P. (1993). Evidence for a multi-compartmental histochemical organization of the nucleus accumbens in the rat. J. Comp. Neurol. 337, 267–276.
Jongen-Relo, A. L., Voorn, P., and Groenewegen, H. J. (1994). Immunohistochemical characterization of the shell and core territories of the nucleus accumbens in the rat. Eur. J. Neurosci. 6, 1255–1264.
Kalivas, P. W., and Duffy, P. (1995). Selective activation of dopamine transmission in the shell of the nucleus accumbens by stress. Brain Res. 675, 325–328.
Le Moine, C., and Bloch, B. (1995). D1 and D2 dopamine receptor gene expression in the rat striatum: sensitive cRNA probes demonstrate prominent segregation of D1 and D2 mRNAs in distinct neuronal populations of the dorsal and ventral striatum. J. Comp. Neurol. 355, 418–426.
Le Moine, C., and Bloch, B. (1996). Expression of the D3 dopamine receptor in peptidergic neurons of the nucleus accumbens: comparison with the D1 and D2 dopamine receptors. Neuroscience 73, 131–143.
Lu, X. Y., Ghasemzadeh, M. B., and Kalivas, P. W. (1998). Expression of D1 receptor, D2 receptor, substance P and enkephalin messenger RNAs in the neurons projecting from the nucleus accaumbens. Neuroscience 25, 767–780.
Marcellino, D., Ferre, S., Casado, V., Cortes, A., Le Foll, B., Mazzola, C., et al. (2008). Identification of dopamine D1-D3 receptor heteromers. Indications for a role of synergistic D1-D3 receptor interactions in the striatum. J. Biol. Chem. 283, 26016–26025.
Matamales, M., Bertran-Gonzalez, J., Salomon, L., Degos, B., Deniau, J. M., Valjent, E., et al. (2009). Striatal medium-sized spiny neurons: identification by nuclear staining and study of neuronal subpopulations in BAC transgenic mice. PLoS ONE 4:e4770. doi: 10.1371/journal.pone.0004770
Mercuri, N. B., Saiardi, A., Bonci, A., Picetti, R., Calabresi, P., Bernardi, G., et al. (1997). Loss of autoreceptor function in dopaminergic neurons from dopamine D2 receptor deficient mice. Neuroscience 79, 323–327.
Meredith, G. E., Pennartz, C. M., and Groenewegen, H. J. (1993). The cellular framework for chemical signalling in the nucleus accumbens. Prog. Brain Res. 99, 3–24.
Miyoshi, G., Hjerling-Leffler, J., Karayannis, T., Sousa, V. H., Butt, S. J., Battiste, J., et al. (2010). Genetic fate mapping reveals that the caudal ganglionic eminence produces a large and diverse population of superficial cortical interneurons. J. Neurosci. 30, 1582–1594.
Nagel, J., and Hauber, W. (2004). Reverse microdialysis of a dopamine D2 receptor antagonist alters extracellular adenosine levels in the rat nucleus accumbens. Neurochem. Int. 44, 609–615.
Nicola, S. M. (2007). The nucleus accumbens as part of a basal ganglia action selection circuit. Psychopharmacology (Berl.) 191, 521–550.
Ouimet, C. C., Miller, P. E., Hemmings, H. C. Jr., Walaas, S. I., and Greengard, P. (1984). DARPP-32, a dopamine- and adenosine 3':5'-monophosphate-regulated phopshoprotein enriched in dopamine-innervated brain regions. III. Immunocytochemical localization. J. Neurosci. 4, 111–124.
Pascoli, V., Besnard, A., Herve, D., Pages, C., Heck, N., Girault, J. A., et al. (2011). Cyclic adenosine monophosphate-independent tyrosine phosphorylation of NR2B mediates cocaine-induced extracellular signal-regulated kinase activation. Biol. Psychiatry 69, 218–227.
Perreault, M. L., Fan, T., Alijaniaram, M., O'Dowd, B. F., and George, S. R. (2012). Dopamine D1-D2 receptor heteromer in dual phenotype GABA/glutamate-coexpressing striatal medium spiny neurons: regulation of BDNF, GAD67 and VGLUT1/2. PLoS ONE 7:e33348. doi: 10.1371/journal.pone.0033348
Perreault, M. L., Hasbi, A., Alijaniaram, M., Fan, T., Varghese, G., Fletcher, P. J., et al. (2010). The dopamine D1-D2 receptor heteromer localizes in dynorphin/enkephalin neurons: increased high affinity state following amphetamine and in schizophrenia. J. Biol. Chem. 285, 36625–36634.
Perreault, M. L., Hasbi, A., O'Dowd, B. F., and George, S. R. (2011). The dopamine d1-d2 receptor heteromer in striatal medium spiny neurons: evidence for a third distinct neuronal pathway in Basal Ganglia. Front. Neuroanat. 5:31. doi: 10.3389/fnana.2011.00031
Reynolds, S. M., and Berridge, K. C. (2002). Positive and negative motivation in nucleus accumbens shell: bivalent rostrocaudal gradients for GABA-elicited eating, taste “liking”/“disliking” reactions, place preference/avoidance, and fear. J. Neurosci. 22, 7308–7320.
Santini, E., Valjent, E., and Fisone, G. (2008). Parkinson's disease: levodopa-induced dyskinesia and signal transduction. FEBS J. 275, 1392–1399.
Schiffmann, S. N., Jacobs, O., and Vanderhaeghen, J. J. (1991). Striatal restricted adenosine A2 receptor (RDC8) is expressed by enkephalin but not by substance P neurons: an in situ hybridization histochemistry study. J. Neurochem. 57, 1062–1067.
Seifert, U., Hartig, W., Grosche, J., Bruckner, G., Riedel, A., and Brauer, K. (1998). Axonal expression sites of tyrosine hydroxylase, calretinin- and calbindin-immunoreactivity in striato-pallidal and septal nuclei of the rat brain: a double-immunolabelling study. Brain Res. 795, 227–246.
Sesack, S. R., and Grace, A. A. (2010). Cortico-Basal Ganglia reward network: microcircuitry. Neuropsychopharmacology 35, 27–47.
Sokoloff, P., Giros, B., Martres, M. P., Bouthenet, M. L., and Schwartz, J. C. (1990). Molecular cloning and characterization of a novel dopamine receptor (D3) as a target for neuroleptics. Nature 347, 146–151.
Srinivas, S., Watanabe, T., Lin, C. S., William, C. M., Tanabe, Y., Jessell, T. M., et al. (2001). Cre reporter strains produced by targeted insertion of EYFP and ECFP into the ROSA26 locus. BMC Dev. Biol. 1:4. doi: 10.1186/1471-213X-1-4
Stuber, G. D., Hnasko, T. S., Britt, J. P., Edwards, R. H., and Bonci, A. (2010). Dopaminergic terminals in the nucleus accumbens but not the dorsal striatum corelease glutamate. J. Neurosci. 30, 8229–8233.
Tecuapetla, F., Patel, J. C., Xenias, H., English, D., Tadros, I., Shah, F., et al. (2010). Glutamatergic signaling by mesolimbic dopamine neurons in the nucleus accumbens. J. Neurosci. 30, 7105–7110.
Todtenkopf, M. S., and Stellar, J. R. (2000). Assessment of tyrosine hydroxylase immunoreactive innervation in five subregions of the nucleus accumbens in rats treated with repeated cocaine. Synapse 38, 261–270.
Torvinen, M., Marcellino, D., Canals, M., Agnati, L. F., Lluis, C., Franco, R., et al. (2005). Adenosine A2A receptor and dopamine D3 receptor interactions: evidence of functional A2A/D3 heteromeric complexes. Mol. Pharmacol. 67, 400–407.
Valjent, E., Bertran-Gonzalez, J., Herve, D., Fisone, G., and Girault, J. A. (2009). Looking BAC at striatal signaling: cell-specific analysis in new transgenic mice. Trends Neurosci. 32, 538–547.
Valjent, E., Corvol, J. C., Pages, C., Besson, M. J., Maldonado, R., and Caboche, J. (2000). Involvement of the extracellular signal-regulated kinase cascade for cocaine-rewarding properties. J. Neurosci. 20, 8701–8709.
Valjent, E., Pascoli, V., Svenningsson, P., Paul, S., Enslen, H., Corvol, J. C., et al. (2005). Regulation of a protein phosphatase cascade allows convergent dopamine and glutamate signals to activate ERK in the striatum. Proc. Natl. Acad. Sci. U.S.A. 102, 491–496.
Van Dongen, Y. C., Mailly, P., Thierry, A. M., Groenewegen, H. J., and Deniau, J. M. (2008). Three-dimensional organization of dendrites and local axon collaterals of shell and core medium-sized spiny projection neurons of the rat nucleus accumbens. Brain Struct. Funct. 213, 129–147.
Voorn, P., Gerfen, C. R., and Groenewegen, H. J. (1989). Compartmental organization of the ventral striatum of the rat: immunohistochemical distribution of enkephalin, substance P, dopamine, and calcium-binding protein. J. Comp. Neurol. 289, 189–201.
Wright, C. I., Beijer, A. V., and Groenewegen, H. J. (1996). Basal amygdaloid complex afferents to the rat nucleus accumbens are compartmentally organized. J. Neurosci. 16, 1877–1893.
Wright, C. I., and Groenewegen, H. J. (1996). Patterns of overlap and segregation between insular cortical, intermediodorsal thalamic and basal amygdaloid afferents in the nucleus accumbens of the rat. Neuroscience 73, 359–373.
Zaborszky, L., Alheid, G. F., Beinfeld, M. C., Eiden, L. E., Heimer, L., and Palkovits, M. (1985). Cholecystokinin innervation of the ventral striatum: a morphological and radioimmunological study. Neuroscience 14, 427–453.
Zahm, D. S., and Brog, J. S. (1992). On the significance of subterritories in the “accumbens” part of the rat ventral striatum. Neuroscience 50, 751–767.
Appendix
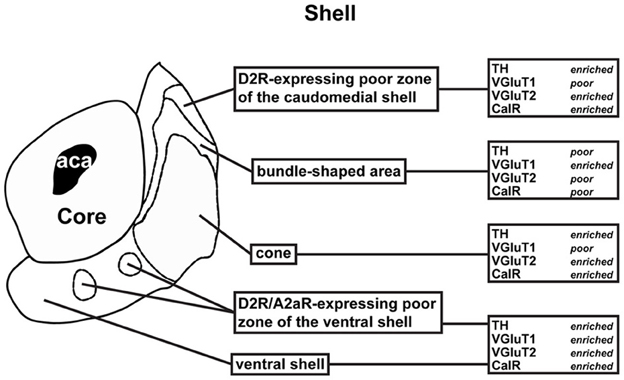
Figure A1. Schematic representation of the subterritories of the caudomedial NAc shell analyzed. Each region was defined based on a review of previous anatomical and neurochemical studies. See text for more detailed description.
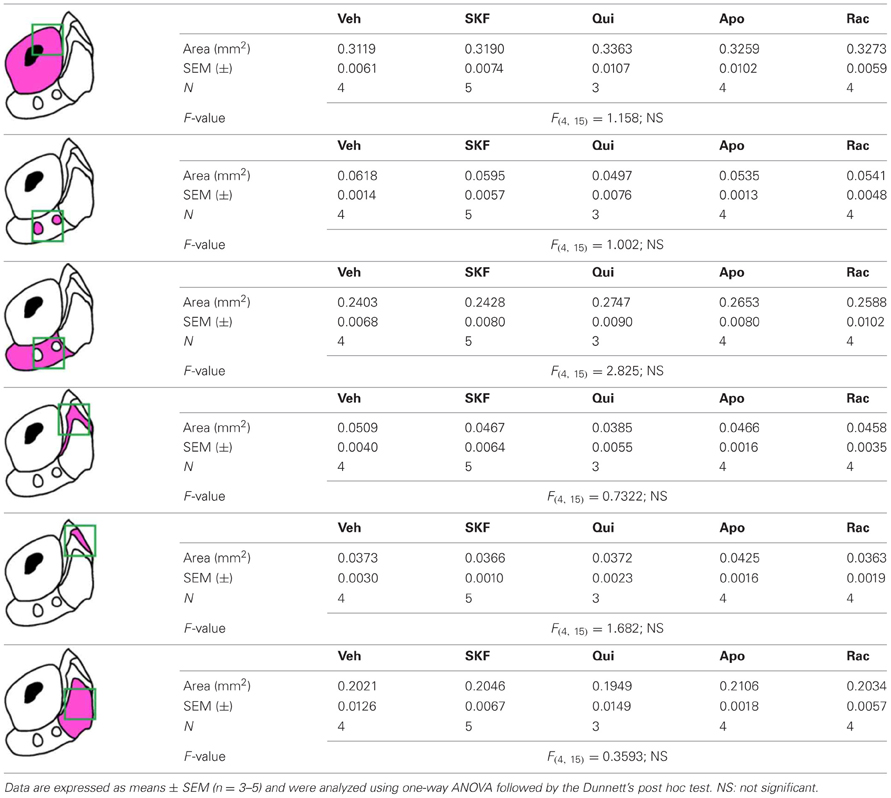
Table A1. Measurement of the surface areas of the NAc subregions analyzed in Figure 10
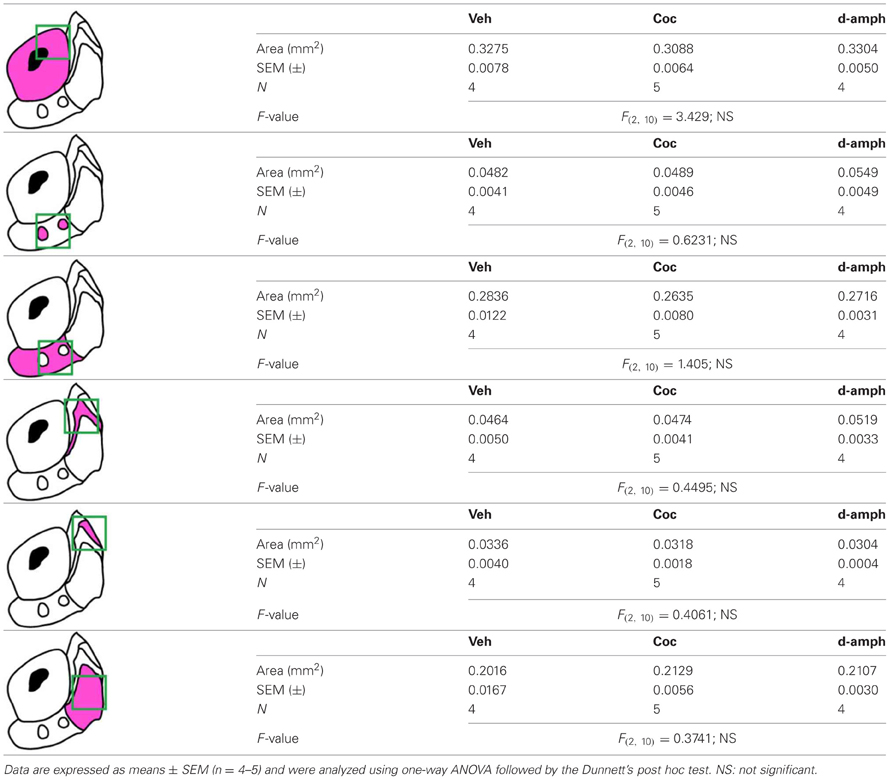
Table A2. Measurement of the surface areas of the NAc subregions analyzed in Figure 13
Keywords: medium-sized spiny neurons, BAC transgenic, nucleus accumbens, dopamine, psychostimulant, ERK signaling, neural circuits
Citation: Gangarossa G, Espallergues J, de Kerchove d'Exaerde A, El Mestikawy S, Gerfen CR, Hervé D, Girault J-A and Valjent E (2013) Distribution and compartmental organization of GABAergic medium-sized spiny neurons in the mouse nucleus accumbens. Front. Neural Circuits 7:22. doi: 10.3389/fncir.2013.00022
Received: 06 December 2012; Paper pending published: 28 December 2012;
Accepted: 02 February 2013; Published online: 19 February 2013.
Edited by:
Luis De Lecea, Stanford University, USAReviewed by:
Deborah Baro, Georgia State University, USAGarret Stuber, University of North Carolina at Chapel Hill, USA
Marisela Morales, National Institute on Drug Abuse, National Institutes of Health, USA
Copyright © 2013 Gangarossa, Espallergues, de Kerchove d'Exaerde, El Mestikawy, Gerfen, Hervé, Girault and Valjent. This is an open-access article distributed under the terms of the Creative Commons Attribution License, which permits use, distribution and reproduction in other forums, provided the original authors and source are credited and subject to any copyright notices concerning any third-party graphics etc.
*Correspondence: Emmanuel Valjent, INSERM, U661, Universités de Montpellier 1 & 2, Montpellier, F-34094, France.
CNRS, UMR 5203, Institut de Génomique Fonctionnelle, Universités de Montpellier 1 & 2, 141 rue de la Cardonille, 34094 Montpellier, Cedex 05, France. e-mail: emmanuel.valjent@igf.cnrs.fr; emmanuel.valjent@gmail.com