Patients with schizophrenia fail to up-regulate task-positive and down-regulate task-negative brain networks: an fMRI study using an ICA analysis approach
- 1 Department of Biological and Medical Psychology, University of Bergen, Bergen, Norway
- 2 Section for Clinical Neurophysiology, Haukeland University Hospital, Bergen, Norway
- 3 Department of Biomedicine, K.G. Jebsen Centre for Research on Neuropsychiatric Disorders, University of Bergen, Bergen, Norway
- 4 Mind Research Network, Albuquerque, NM, USA
- 5 Division of Psychiatry, Haukeland University Hospital, Bergen, Norway
- 6 Section of Psychiatry, Department of Clinical Medicine, University of Bergen, Bergen, Norway
- 7 Department of Radiology, Haukeland University Hospital, Bergen, Norway
Recent research suggests that the cerebral correlates of cognitive deficits in schizophrenia are nested in the activity of widespread, inter-regional networks rather than being restricted to any specific brain location. One of the networks that have received focus lately is the default mode network. Parts of this network have been reported as hyper-activated in schizophrenia patients (SZ) during rest and during task performance compared to healthy controls (HC), although other parts have been found to be hypo-activated. In contrast to this network, task-positive networks have been reported as hypo-activated compared in SZ during task performance. However, the results are mixed, with, e.g., the dorsolateral prefrontal cortex showing both hyper- and hypo-activation in SZ. In this study we were interested in signal increase and decrease differences between a group of SZ and HC in cortical networks, assuming that the regulatory dynamics of alternating task-positive and task-negative neuronal processes are aberrant in SZ. We compared 31 SZ to age- and gender-matched HC, and used fMRI and independent component analysis (ICA) in order to identify relevant networks. We selected the independent components (ICs) with the largest signal intensity increases (STG, insula, supplementary motor cortex, anterior cingulate cortex, and MTG) and decreases (fusiform gyri, occipital lobe, PFC, cingulate, precuneus, and angular gyrus) in response to a dichotic auditory cognitive task. These ICs were then tested for group differences. Our findings showed deficient up-regulation of the executive network and a corresponding deficit in the down-regulation of the anterior default mode, or effort network during task performance in SZ when compared with HC. These findings may indicate a deficit in the dynamics of alternating task-dependent and task-independent neuronal processes in SZ. The results may cast new light on the mechanisms underlying cognitive deficits in schizophrenia, and may be of relevance for diagnostics and new treatments.
Introduction
There is a considerably body of evidence showing that patients with schizophrenia reveal global cognitive deficits (see, e.g., Gold and Harvey, 1993; Egeland et al., 2003; Rund et al., 2006) in a range from low-level perceptual processes to high-level attention and executive processes (see Green et al., 2000; Green et al., 2004). A comparable body of both ERP and functional neuroimaging studies has likewise revealed corresponding changes in activations in specific brain areas related to specific cognitive processes (Callicott et al., 1998; Hugdahl et al., 2004; Pearlson and Calhoun, 2009 for data and selective reviews; Agarwal et al., 2010; Brown and Thompson, 2010; Gur and Gur, 2010; Dias et al., 2011). The current literature is however ambiguous regarding the exact nature of activation localization and the magnitude and direction of activation differences between patients and healthy controls (HC), with both hypo- and hyper-activations being reported in the patients (Callicott et al., 2003; Egan et al., 2004; Hugdahl et al., 2004; Rasser et al., 2005; Weiss et al., 2007). An explanation for this diversity regarding the imaging studies may be that the neuronal correlates of global cognitive deficits most likely involve large-scale networks that would be common for a variety of cognitive processes, and go beyond solitary activations (c.f. Smith et al., 2009). Complicating factors are however, the diversity of the tasks being performed while the subject is in the MRI scanner, and the small number of participants often used in imaging studies (see for example review Adams and David, 2007). Another factor may be the general disorganization of cortical networks in schizophrenia (Bassett et al., 2008) and the existence of different connectivity patterns among brain regions in schizophrenia compared to HCs (Jafri et al., 2008). Thus, both hyper- and hypo-activation may be present simultaneously if up-regulating (higher signal intensity) of one network will require the down-regulation (lower signal intensity) of another network (c.f. Hugdahl et al., 2009a) in order for efficient cognitive processing to occur. This was also recently suggested by Guerrero-Pedraza et al. (2011), who found that the co-existence of frontal hypo- and hyper-activation could be mediated by aberrant network dynamics with regard to up- and down-regulation of cortical networks. It is therefore appropriate at the systems level of explanation (Friston et al., 1999; Wright et al., 1999) to approach a global cognitive failure in schizophrenia with a large-scale multivariate analysis approach.
Recent imaging studies have shown differences between schizophrenia and control subjects in intrinsic connectivity networks, mostly during resting state periods with no explicit cognitive task to be performed (Calhoun et al., 2008, 2009; Rotarska-Jagiela et al., 2010), in particular indicating differences in the default mode network (Raichle et al., 2001; Garrity et al., 2007; Raichle, 2010). In another study where the auditory oddball task was performed, Kim et al. (2009b) discussed the possibility that patients suffering of schizophrenia might have difficulties shifting from baseline network activity to networks involved in task performance.
We therefore compared signal decreasing and signal increasing during alternating task-present and task-absent epochs while the participants were in the scanner. A possible disturbance in the patient group, would potentially interfere with the ability to adequately monitor, process, and evaluate stimuli in the surrounding environment, in short, would interfere with cognitive processing. In order to drive task-positive and task-negative networks that would correspond to a global cognitive deficit, one will need a corresponding “global” cognitive task that encompasses cognitive processes at different levels of processing demands. We have previously used a modified dichotic listening (DL) task with simple speech sounds and with instructions to focus attention on either the left or right ear stimulus (Hugdahl and Andersson, 1986; Løberg et al., 1999; Hugdahl et al., 2009a). This task has shown to encompass three different cognitive components in the same experimental design, with maximum experimental control of extraneous confounding factors. The three processes are a basic auditory perception component, an attention focus component, and an executive control component (c.f. Hugdahl et al., 2009b for further details; Bouma and Gootjes, 2011), going from low-level to high-level processing demands. A unique feature of the instruction-modulated DL task is that the stimuli and general procedure stay the same across all three instructions, with minimalistic experimental manipulations between conditions. When also analyzing data by combining data from all three conditions into a common measure we obtain an estimate of the overall cognitive processing. This would include both basic sensory and complex cognitive processes embedded within the same experimental frame. Such an approach will also be less sensitive to shifts of processing modes between tasks as is typical of standard neuropsychological tests, which also differ in overall task difficulty and task design and outline.
In order to investigate the different networks involved in the alternating task-dependent and task-independent neuronal processes during alternating epochs of task presence and absence, we used an independent component analysis (ICA) approach when analyzing the fMRI data. ICA is a model-free way of analyzing fMRI data by extracting the different time-courses attached to voxel-wise spatial locations (Calhoun et al., 2001, 2009). By identifying voxels showing signal increasing during time-courses that correspond to task-positive (task presence, or positive difference measure ON-OFF blocks) versus voxels showing signal increasing during time-courses corresponding to task-negative (task absence, or negative difference measure ON-OFF blocks) time-series, and comparing these signal intensities between groups, it would be possible to simultaneously identify corresponding anti-correlated signal increasing and signal decreasing differences between the groups. We further assumed that mean average difference between task ON and OFF conditions is an informative feature of the dynamics of alternating task-positive and task-negative neuronal processes. Regarding task-positive and task-negative networks, we would like to point out that different studies have reported mixed results regarding task-positive and task-negative networks in patients and HCs (see for example Garrity et al., 2007; Kim et al., 2009a; Mannell et al., 2010). However we specifically predicted that patients should be deficient compared to controls in up-regulation of the executive network (labelled effort network by Hugdahl et al., 2009a), showing reduced signal intensity in the included ICA components, and also be deficient in down-regulation of selected components included in the default mode network (see Sridharan et al., 2008). Further, we predicted that the anterior cingulate cortex (ACC) would be particularly activated in the patient group when switching between network operational modus, based on the findings on healthy individuals reported by Sridharan et al. (2008), where this area together with the right fronto-insular cortex seems to act to switch between the two networks.
Materials and Methods
Participants
The present study included 31 patients diagnosed with schizophrenia (SZ, 22 male/eight female, all-right-handed, Age; mean = 35, range 18–57, SD = 10.24, median = 37, Years of education: mean = 13, range 9–19, SD = 2.72, median = 13) and 31 HC (22 male/eight female, four ambidextrous hand preference/27 right-handed, Age; mean = 35, range 19–59, SD = 10.30, median = 39, Years of education: mean = 15, range 10–24, SD = 2.96, median = 15). All participants gave written informed consent and the study was approved by the Regional Ethic Committee for Medical Research. The SZ and HC groups were matched for age, gender, and years of education on a one-to-one basis (see Table 1). The SZ had previously been diagnosed according to both the Diagnostic and Statistical Manual of Mental Disorders Revised Fourth Edition (DSM-IV) and the International Statistical Classification of Diseases and Related Health Problems 10th Revision (ICD-10). Equivalent drug dosage for all drugs used was calculated among the SZ by conversion to defined daily doses (DDDs) as developed by the World Health Organization Collaborating Center for Drug Statistics Methodology1. The basic definition of the DDD unit is the assumed average maintenance dose per day for a drug used for its main indication in adults. Three SZ were not using any medication at the time of scanning, and information from four SZ was not available. These four SZ were included with imputations of the average dose based upon the group average (see Table 1 for further information). The SZ group underwent the Positive and Negative Syndrome Scale (PANSS) interview (Kay et al., 1987) about 30 min before MR-scanning.
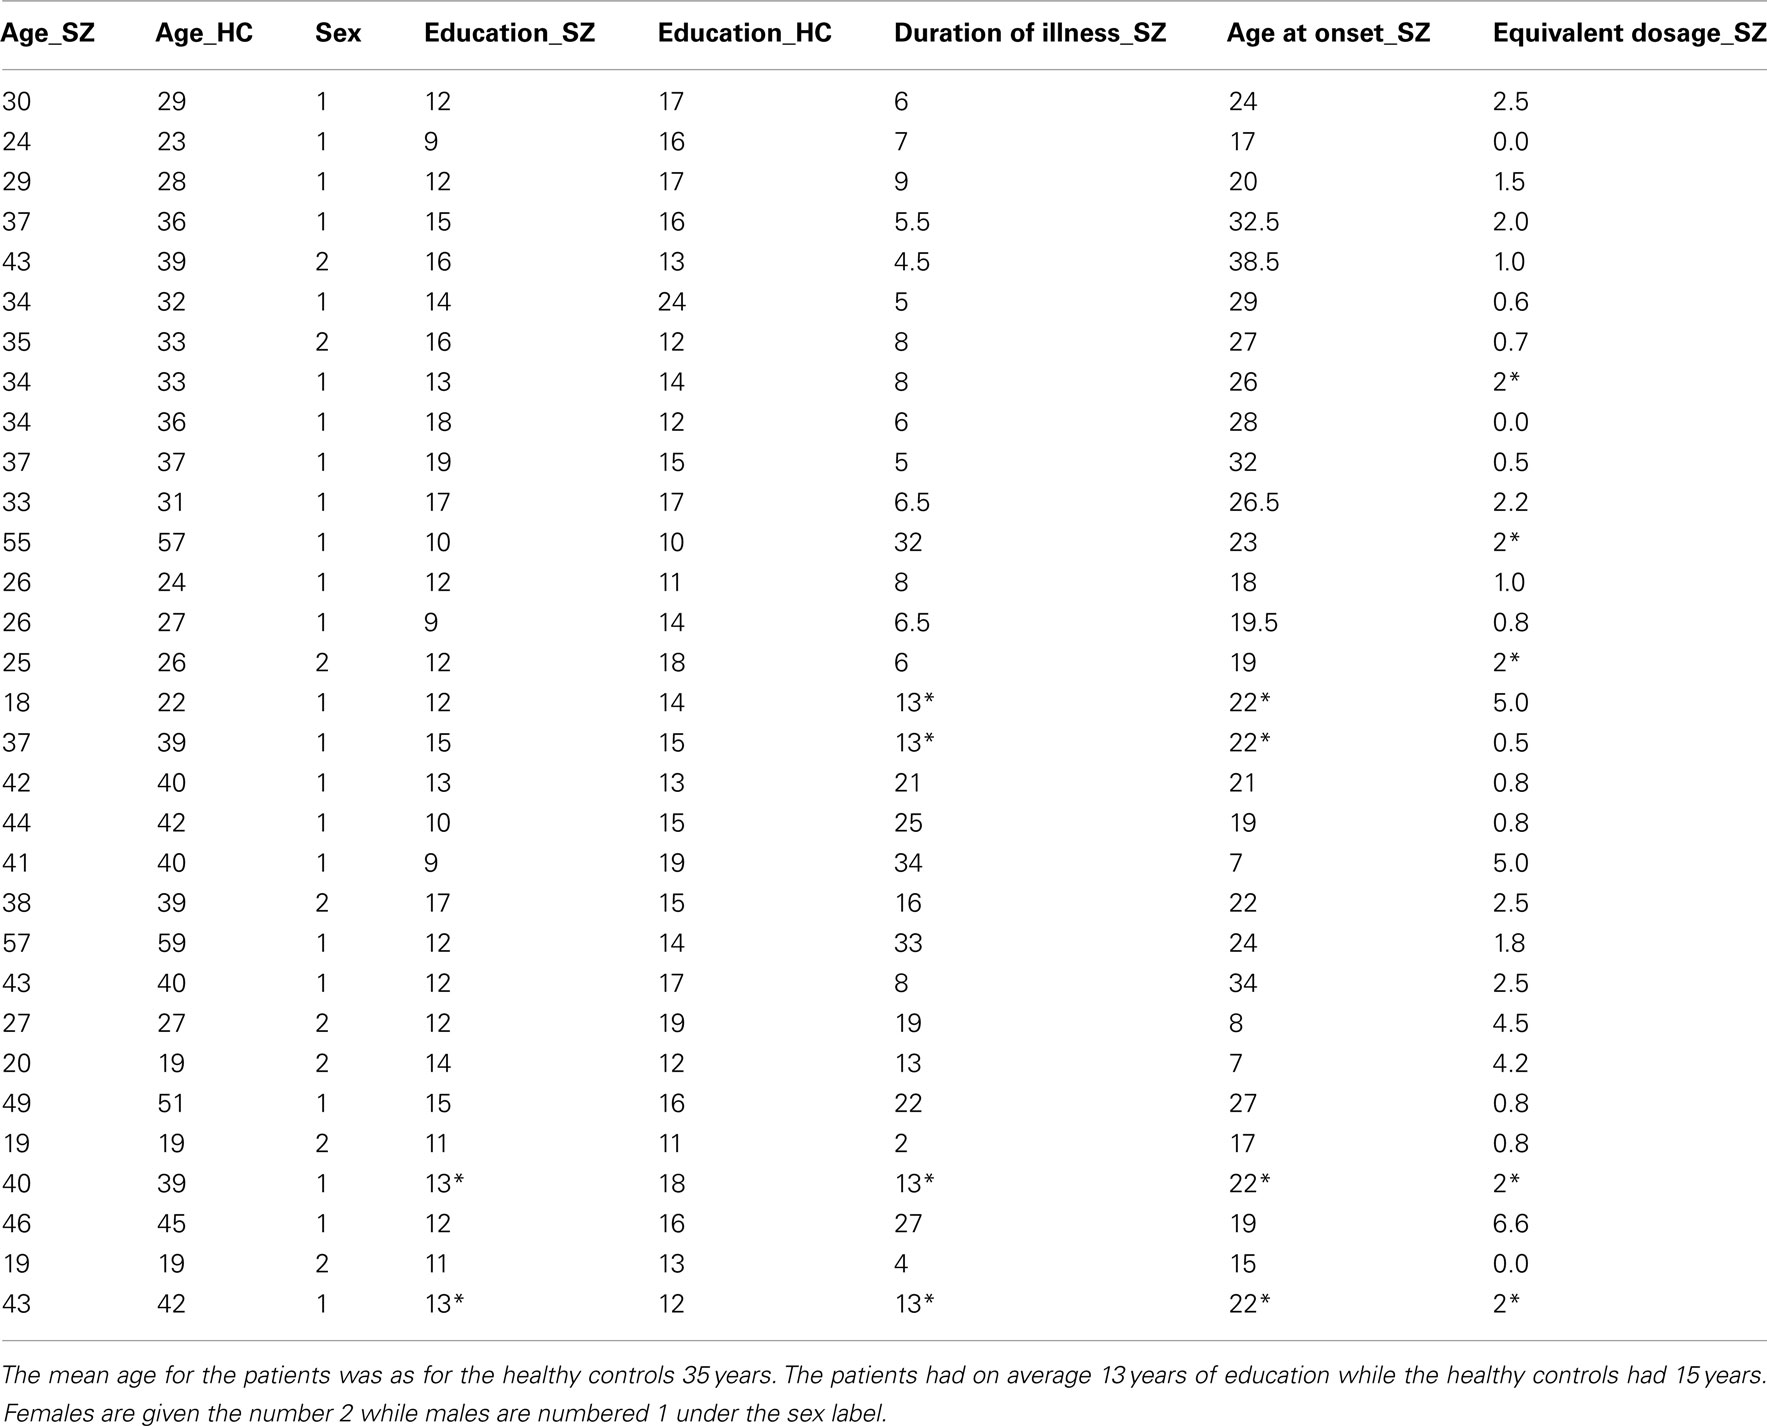
Table 1. Demographics regarding the participants in the study: due to missing data the * indicates that the average was used.
Handedness was established by the handedness-questionnaire first suggested by Raczkowski et al. (1974). The participants were considered right-handers if they used the right hand (one foot item) in least 13 of the 15-items in the questionnaire.
Exclusion criteria were left-handedness, a hearing deficit of more than 20 dB on any of the frequencies 500, 1000, 2000, and 4000 Hz or an interaural difference larger than 15 dB. Hearing was tested with the Oscilla® AudioConsole software program2, or manually by use of Micromate 304 Audiogram3. Among the HC there was no history of drug abuse or psychiatric illness. All participants were paid compensation (500 NOK, ∼90 USD) for their expenses and use of time.
The Cognitive Task
We used a DL paradigm with six consonant-vowel (CV) syllables, ba/ta/ga/pa/ka/da, that were presented dichotically, i.e., two different syllables simultaneously, one in each ear. The subjects were in addition instructed to focus attention to and report from either the left (forced-left attention, FL) or right ear (forced-right attention, FR) stimulus, or with no instruction of attention focus (non-forced focus, NF). Previous studies (Hugdahl et al., 2009b) have shown that the NF condition taps a lateralized perceptual component, the FR condition taps a non-executive attention component, and the FL condition taps an executive cognitive control component. There were a total of 30 syllable-pair representations. The participants were not informed about the dichotic nature of the task, and were only told that they would be hearing series of syllable sounds that would come about every fourth second, and that they should orally report after each presentation which syllable they heard best or first. Oral responses were transmitted via an in-house built air-conducting microphone that was placed on the head-coil and subsequently recorded on a digital recorder (M-audio Microtracker 24/964) outside the scanner room. Responses were later scored, by use of GoldWave audio software version 5.555. On the MR examination day instructions about the DL task and what was expected of the participant were given orally before the experiment began and again in written form via LCD goggles (NordicNeuroLab6) during scanning. The instruction to report the right or left ear stimulus during the FR and FL attention conditions, respectively, was indicated by an arrow in the goggles together with written instructions, also presented in the LCD goggles.
MR Imaging
The MR-scanning was done with a 3.0 Signa HDx MR scanner. Anatomical images were recorded with a high-resolution T1-weighted sequence for 3D volume images before the functional scans were acquired with an echo planar imaging (EPI) sequence. The T1-images were acquired with an EPI sequence. The T1-images were acquired with a FSPGR pulse sequence with 122 sagittal slices [64 × 64 matrix size, slice thickness = 1.0 mm, echo time (TE) = 30 ms, repetition time (TR) = 1.5 s, flip angle (FA) = 90].
The T1-weighted 3D volume images were used for positioning of the slices for the definition and identification the functional EPI volumes parallel to the AC-PC line. A sparse-sampling EPI sequence protocol was used with a silent “gap” between successive volume acquisitions when the auditory stimuli were presented and the verbal responses collected (van den Noort et al., 2008; van Wageningen et al., 2009). The sparse-sampling protocol had the following parameters: TA = 1.5 s, TR = 5.5 s, voxel size = 3.44 mm × 3.44 mm × 5.5 mm, volumes acquired = 184, slice thickness = 3 mm, FA = 90. Four “dummy” scans were acquired at the beginning in order to avoid confounding by initial arousal and other effects.
The CV-syllables presentation started 0.6 s after the TA, leaving approximately 2.9 s for the oral response recording after each stimulus presentation.
fMRI Data Pre-Processing and Statistical Analysis
The DICOM images were converted to the ANALYZE file format using the nICE software version 2.3.67 The images were preprocessed using the Statistical Parametric Mapping (SPM8) software package (Wellcome Trust Centre for Neuroimaging8) implemented in Matlab R2009b (Mathworks Sherborn, MA, USA9). Images where further realigned and corrected for possible movement distortion (unwarp) and normalized into the Montreal Neurologic Institute (MNI) reference brain space (Ashburner and Friston, 1999), where the EPI template included in the SPM8 software was used. The normalized images were then resliced with a voxel size of 3 mm3 and smoothed using an 8-mm full-width at half maximum of the Gaussian smoothing kernel.
Group-level spatial ICA was then performed (Calhoun et al., 2001) with the GIFT toolbox, version 1.3h10 implemented in Matlab, with a two-step principal component data reduction, Infomax ICA (Bell and Sejnowski, 1995) with ICASSO (Himberg et al., 2004) and subsequent back-reconstruction. In the first reduction step, the data were intensity-normalized, scaling voxel time-series to a mean of 100, before the data were reduced with temporal principal components analysis (PCA) within subjects. This data reduction step privileges differences among the subjects (Erhardt et al., 2011). Hence the dimensionality of the data was reduced from 180 time points to 90 principal components.
In a second data reduction step, the individual components were concatenated across subjects and further reduced to 60 components. Infomax ICA was performed in this aggregate dataset, estimating the 60 components. The ICA was performed 100 times with random initial conditions, hereafter using ICASSO (Himberg et al., 2004) to assess the stability of the components and using the centroids for back-reconstruction of individual components. For reconstructing subject specific images and enable comparison of both time-courses and spatial maps for both the groups, the “GICA3” back-reconstruction method was used (recommended also by Erhardt et al., 2011).
Prior to the group-level analysis, we selected task-dependent components by means of a simple amplitude criterion. The reconstructed time-series of each participant’s components set were filtered with a Butterworth 256s hi-pass filter and then segmented into four ON-OFF blocks repeats and averaged. The distribution of the component amplitudes was then assessed, i.e., sorted on the overall amplitude differences and six components (three from each tail) were selected for further testing, i.e., 5% largest signal increases (task-positive) and 5% largest signal decreases (task-negative), respectively to the DL task across the whole sample. These independent components (ICs) were then tested for significant group differences. In order to control for covariates of no interest, we used a multiple linear regression model with sex, age, and the years of education as predictors and tested for group differences in the residual. Due to scanner upgrade during the data acquisition period, we had to rectify the intensity signal differences. Regarding these signal differences, the mean image intensity changed and the directionality of the effects remained constant. This has been taken into consideration and is calculated for as a covariate in these analyses.
The difference in signal intensity between the two groups was further evaluated for the six components showing the largest absolute difference between the ON-OFF epochs. We assumed reduced signal intensity in the SZ, and used a Mann-Whitney U-test due to non-parametric distribution of the residuals within each group with a one-tailed significance level at p < = 0.05 (see also Figure 1 for further information and results).
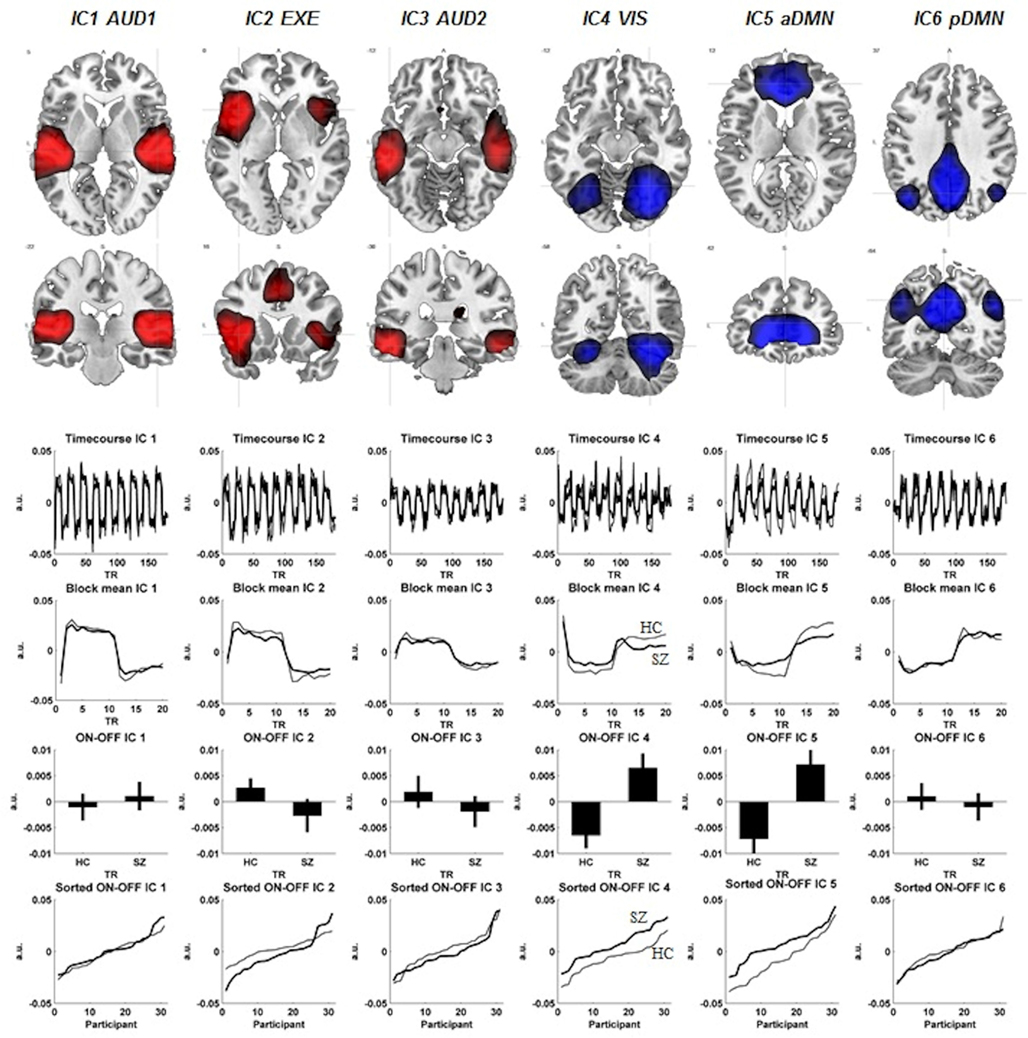
Figure 1. The figure displays each components spatial extension (FWE correction, p < 0.01, cluster extension of 10 voxels). Below each component are corresponding time-courses, the ON-OFF block difference expressed as positive signal change, co-registration effects shown as standard error of the mean in both groups and last the ON-OFF block activation difference visualized between the two groups. The schizophrenia patients (SZ) are visualized with the thicker black line, whereas the healthy controls (HC) have the thinner black line in the figure. The red color represents the activation situation (ON), whereas the blue color visualizes the de-activation (OFF).
Results
Behavioral Data
There was a significant difference between the groups in overall performance on the DL task (pairwise two-sided t-test: p = 0.042), with the HC group showing higher accuracy for reported syllables. For further details regarding behavioral data, see Table 2.
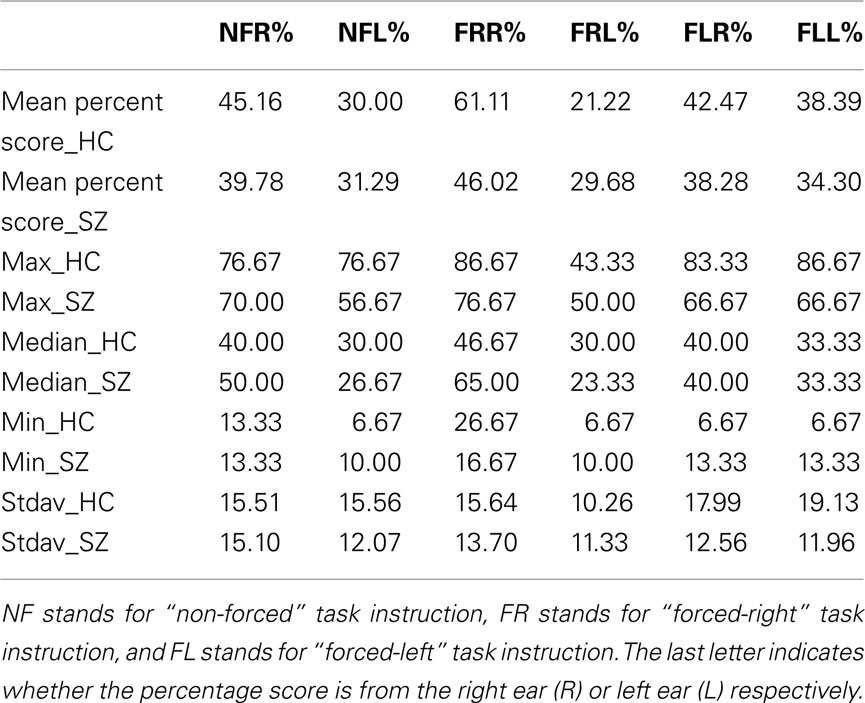
Table 2. Behavior data score shown as percentage (significant group difference; t = 0.42).
fMRI Data
Back-reconstructed individual component maps were subjected to voxel-wise mass-univariate one-sample t-test implemented in the SPM8 software. Component activations were considered significant at p < 0.01 FWE. The regional activation maxima are reported below and illustrated in Figure 1 (see also Table 3 for further details regarding the activation maxima in the ICs). The following networks were identified.
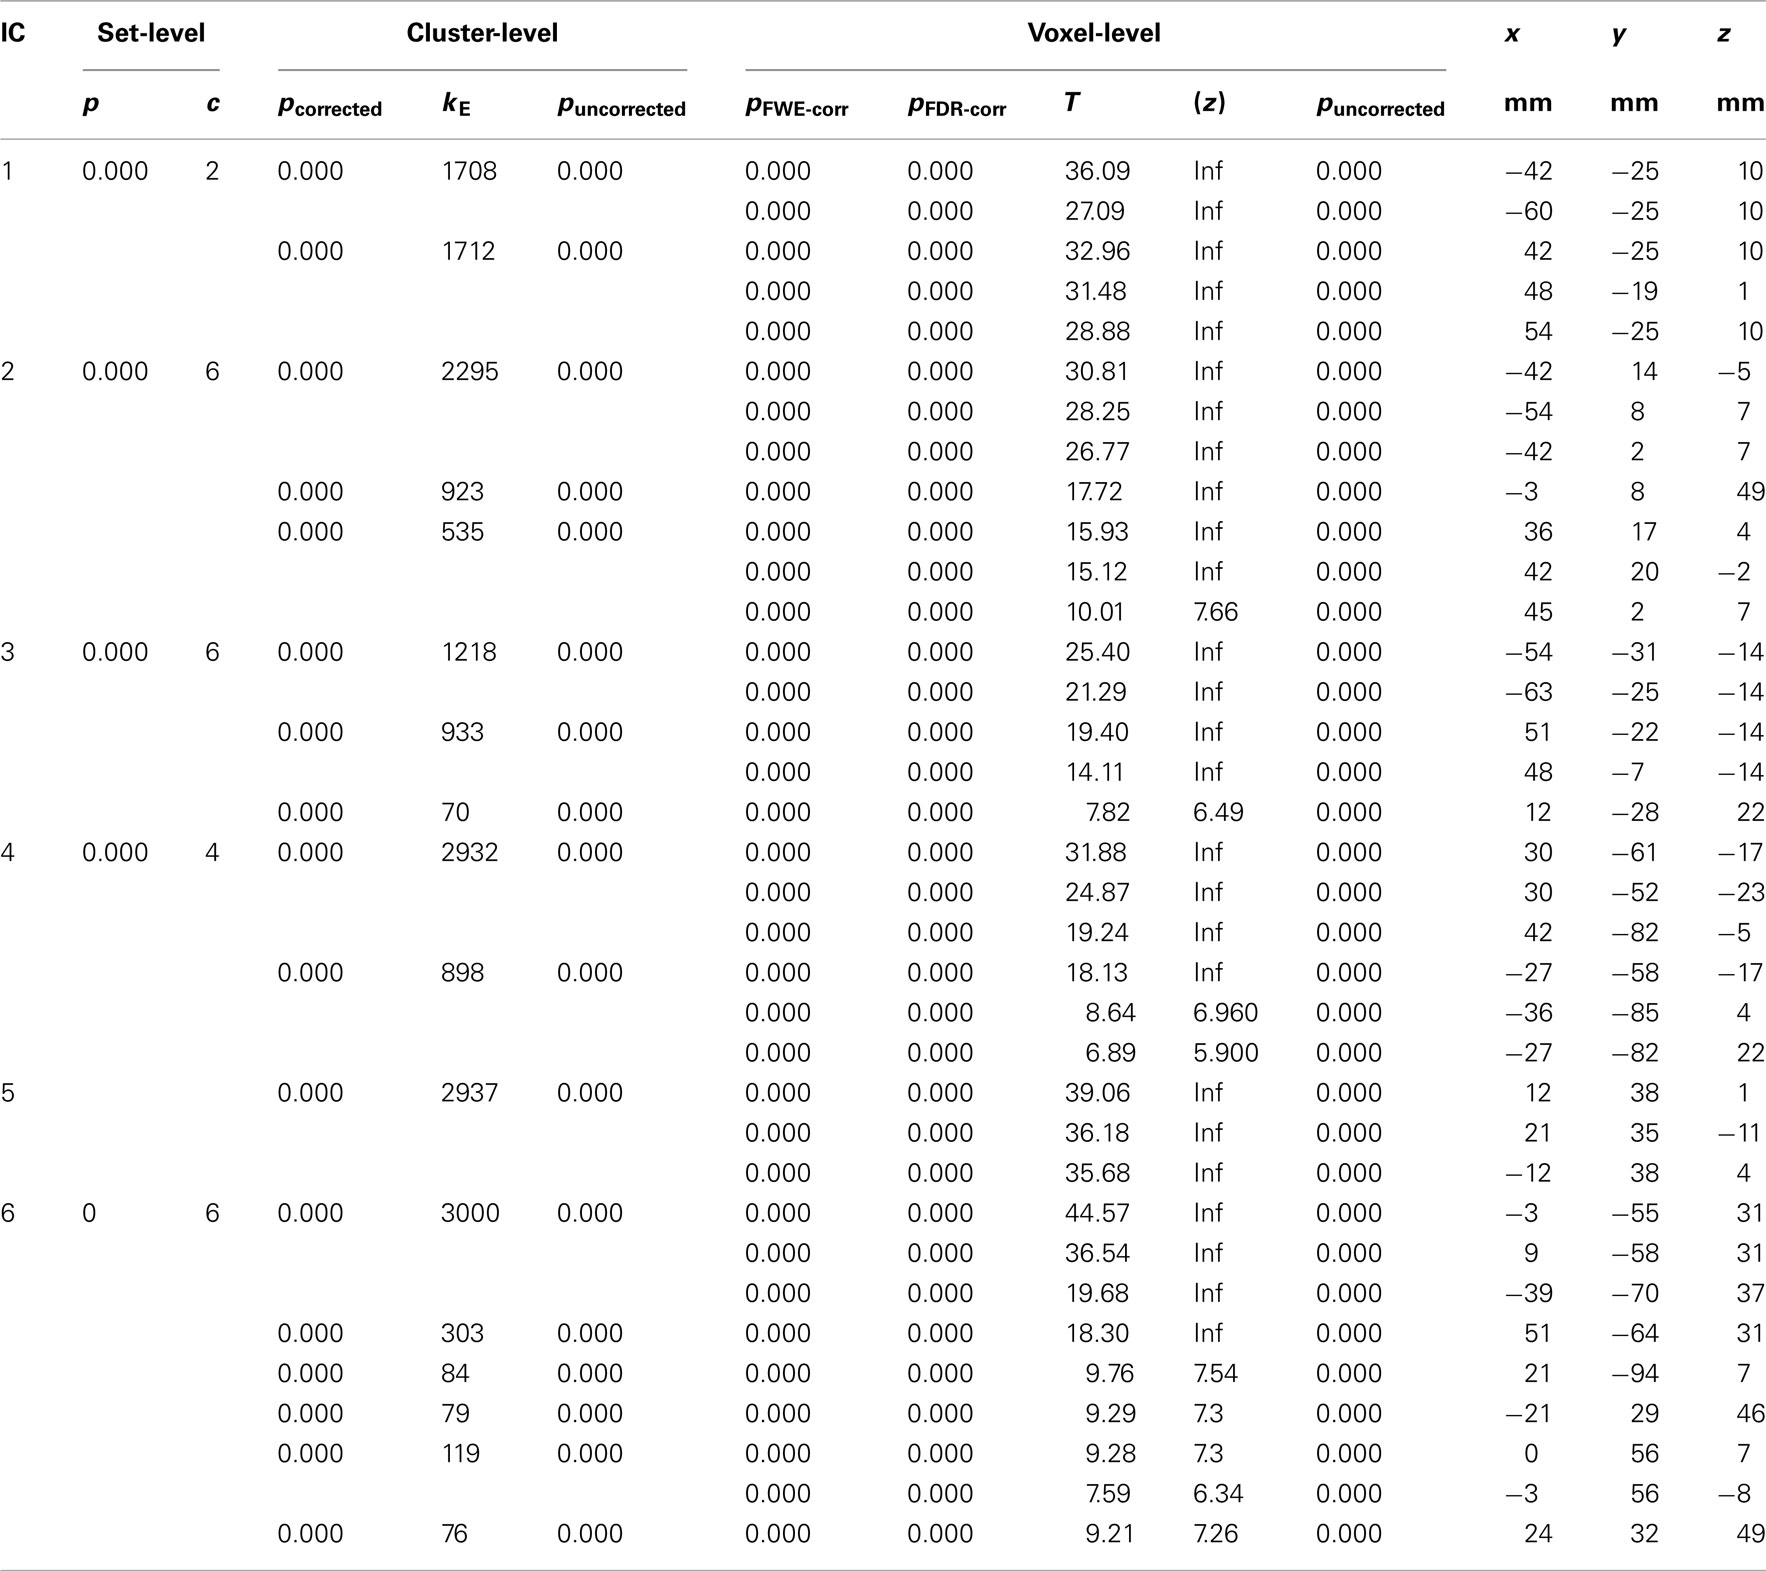
Table 3. The ICs MNI coordinates and respective degree of activation in clusters defined.
IC1-AUD1
An auditory network with signal intensity detected bilateral in the superior temporal gyri, with slight leftward dominance (−42, −25, 10, t = 36.09).
IC2-EXE
An executive network with bilateral signal intensity detected in the Insula, with leftward dominance (−42, 14, −5, t = 30.81) together with signal intensity detected in supplementary motor cortex (SMA). The SMA signal intensities also showed a leftward dominance (−3, 8, 49, t = 17.72). The dorsolateral area of the ACC also showed signal intensities in the IC2-EXE component (−6, 23, 31, t = 9.01). The IC2-EXE component is typically involved in cognitive control/performance monitoring network component (see for example Cole et al., 2010).
IC3-AUD2
A second auditory network with bilateral signal intensity in the inferior and middle temporal gyri with leftward predominance (−54, −31, −14, t = 25.40 and −63, −25, −14, t = 21.29, respectively).
IC4-VIS
A visual network with bilateral signal decreasing with predominance to the right in the fusiform gyri (30, −61, −17, t = 31.88), the cerebellum (30, −52, −23, t = 24.87), and the occipital lobe (42, −82, −5, t = 19.24).
IC5-aDMN
An anterior default mode network with bilateral signal decreasing in the ventromedial prefrontal cortex/anterior cingulate with rightward predominance (12, 38, 1, t = 39.06).
IC6-pDMN
A posterior default mode network with bilateral signal decreasing in the precuneus with leftward predominance (−3, −55, 31, t = 44.57) and rightward preponderance for the angular gyrus (51, −64, 31, t = 18.30).
Three out of the six selected components showed significant ON-OFF difference between the groups. IC2-EXE showed significantly less signal intensity in the SZ group (p = 0.04). Significant lesser signal decreasing in the SZ group was seen in IC4-VIS (p = 0.001) and IC5-aDMN (p = 0.003; see Table 4 for further information for group differences across components). Regarding spatial differences among the component maps, no differences were detected with a two sample t-test, indicating that the overall topography of the networks did not change while alternating between ON (task presence) and OFF (task absence) periods, while the signal intensity did.
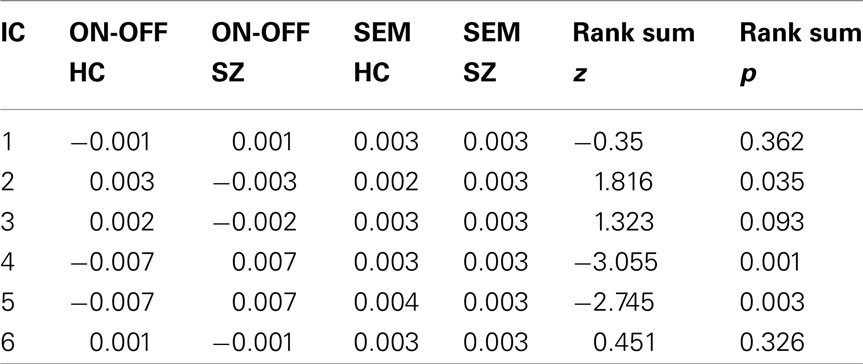
Table 4. The table visualizes the components degree of activation among the two groups.
Positive and Negative Syndrome Scale
There were two significant correlations between IC components and PANSS symptoms. These correlations were however driven by anomalies in the distributions, and we therefore conclude that the ICs and PANSS symptoms in essence were non-correlated (see Table 5; Figure 2 for details).
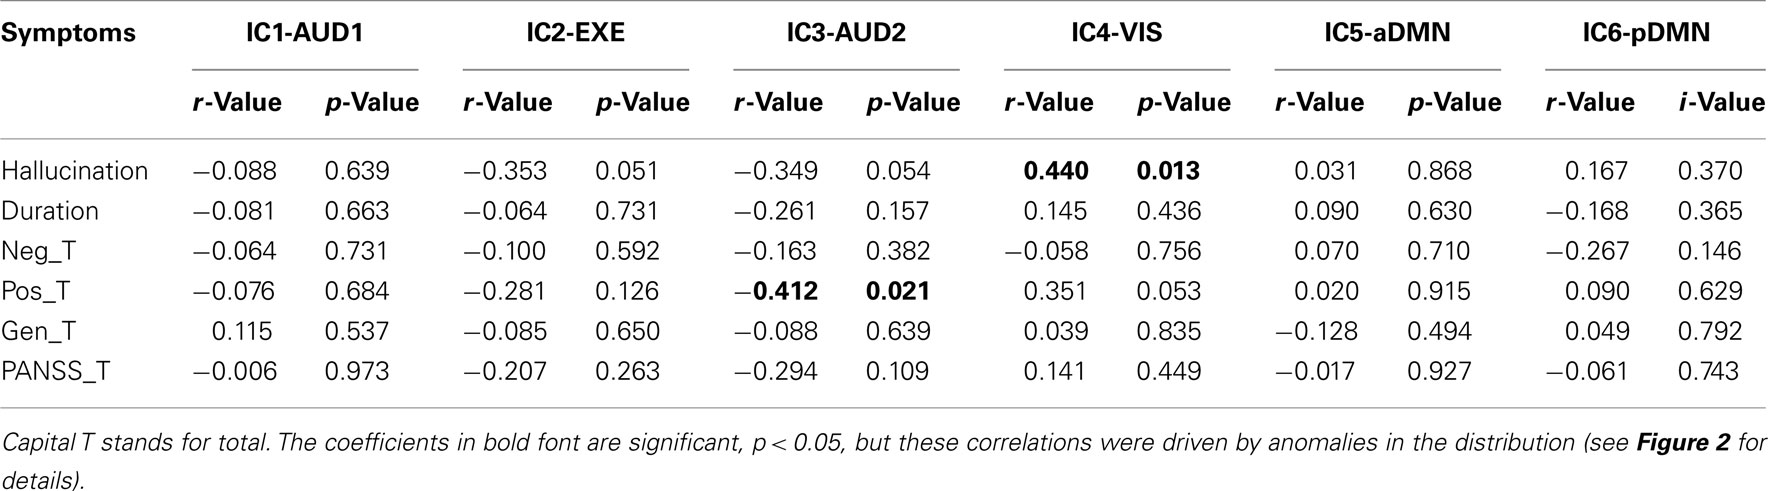
Table 5. The table visualizes the correlation coefficients between PANSS parameters and BOLD activation for the different ICs and the corresponding p-values.
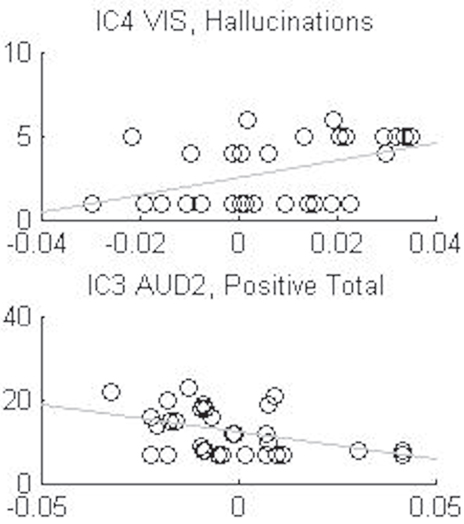
Figure 2. Shows the anomalies in the distributions of the two significant correlations, IC3 auditive component (AUD2) with the sum total of positive symptoms and the IC4 visual component (VIS) with the hallucination symptom, from Table 5.
Discussion
Focusing on the 10% of ICA components with the highest BOLD-fMRI signal amplitudes revealed significant differences between the two groups in three of the component networks. One component related to task-positive networks: the IC2-EXE showed reduced signal intensity in the SZ group in the Insula, SMA, and dorsolateral section of the ACC. The IC4-VIS showed increased signal intensity in the SZ group in the fusiform gyri, in the anterior lobe, and in the occipital lobe. The IC5-aDMN showed increased signal intensity in the SZ group in the ACC. Taken together, these findings indicate impaired signal decreasing in the SZ group compared to the HC group of components belonging to task-negative, or absence, networks during OFF epochs, and a corresponding failure of up-regulating components belonging to task-positive, or presence, networks during ON epochs.
A first interpretation of the findings is of dynamic reallocation of cognitive resources during resting state and task performance, such that certain processes are present both during resting and task periods. In particular this is the case for sustained signal intensity in the ACC (as previously described by McKiernan et al., 2003; Sridharan et al., 2008 in healthy individuals). We now suggest that the SZ patients may have failed to reallocate cognitive resources from a resting state situation to an active processing situation due to sustained hyper-activation of the default mode network (c.f. Pomarol-Clotet et al., 2008; Kim et al., 2009a; Whitfield-Gabrieli et al., 2009). This could also explain the often reported finding that patients with schizophrenia are impaired compared to HCs on most cognitive functions, including perception, attention, and executive functions (c.f. Saccuzzo et al., 1982; Berndl et al., 1986; Green et al., 2000; Rund et al., 2006; Harvey, 2010) seen in standard neuropsychological tests.
An interesting finding is the observation of sustained signal intensity in the ACC in the IC5-aDMN component. ACC is typically activated during periods of active processing or task presence (Bush et al., 2000 for review; Diwadkar et al., 2011). However the role of the ACC during periods of resting, or task absence, is not clear. Raichle et al. (2001) did not include the ACC in the default mode network in the 2001 publication, but it is today consensus that the default mode network exists of several networks where ACC is one of the nodes. Current data suggest that the default mode network consists of primary and secondary sub-networks, where the ACC is believed to belong to the primary default mode network (see for example Mannell et al., 2010). Camchong et al. (2011) suggested that the ACC is a region comprising of the default mode network, which will also show signal intensity during cognitive processing. Thus, increased ACC signal intensity in the SZ group in the task-negative networks, and decreased signal intensity in the positive networks may reflect hyper- versus hypo-activation of the ACC in schizophrenia during periods of task absence or resting versus periods of active task processing, respectively. Seen as such, the ACC may have a dual role as a cognitive hub during both absence of a stimulus and periods of active processing in the presence of a stimulus or task instruction, and that schizophrenia patients show impairments of ACC activation for both passive and active processing (c.f. Sridharan et al., 2008; Guerrero-Pedraza et al., 2011).
Other components that showed significantly more signal intensity by the SZ group in the task-negative networks were the visual component, IC4-VIS. One of the main nodes in this network, the fusiform gyrus, has been found to be reduced in schizophrenia patients compared to HCs (Takahashi et al., 2006). Furthermore, increased signal intensity has also been reported in this area by Lagioia et al. (2010), though in persons with schizotypal personality trait expression. However we do believe that their explanation also can be a possible explaining for our findings, particularly in patients with frequent positive symptoms that could be thought of as engaging a mental imagery component.
Turning to the component showing a significant group difference in the executive component, IC2-EXE, the hypo-frontal signal intensity in the SZ group is similar to what has been frequently reported in the literature of impaired prefrontal function in schizophrenia to cognitive task processing (see for example Fu et al., 2005). The IC2-EXE component extended into the Insula, SMA, and ACC. As mentioned by Craig (2009), joint signal intensity of the Insula and the ACC are commonly reported in most studies. The Insula has shown signal intensity with fMRI during affective-, cognitive-, and aversive interceptive processing and therefore claimed for linking emotions to cognitive processes and behavior responses (Paulus and Stein, 2006), but the Insula has also been suggested to be part of representation of awareness (Craig, 2009). Further Bush et al. (2000, review) summarized the ACC to serve as a monitor for crosstalk between brain areas related to conflict and competition. We would like to extend this by suggesting that failure in the ACC signal intensity in the SZ group when required for active processing may be related to the general deficit in cognitive processing seen in schizophrenia. Kim et al. (2009b) also mentioned in their paper that the ACC, but also the DLPFC, did seem to overlap in their components of relevance. The signal they detected in a component consisting of ACC, DLPFC, thalamus, and Insula, was reported in their paper with higher signal intensity in their controls than their patients (schizophrenia and schizoaffective persons), which also were quite similar to our findings in the IC2-EXE component.
As also discussed by Sridharan et al. (2008) we believe that the ACC may be of particular interest concerning the dynamic shift between default mode and executive networks, acting like a gate-keeper or switch (c.f.r. Kim et al., 2009b). The existence of alterations in dynamic networks connectivity has previously been suggested to be one of the reasons for developing more severe symptoms in the schizophrenia patients (Arnsten et al., 2010). We suggest that an alteration in the ACC alone may contribute to different symptoms depending on which brain structures such alteration further influences (see also van Veen and Carter, 2002). There seems to be consensus in the literature that the default mode network is up-regulated in the schizophrenia patients compared to HCs, whereas the executive network is down-regulated (however see Fu et al., 2005 for other interpretations).
A limitation of the present results is that when using a brain template, individual changes in brain anatomy among participants may influence location and degree of the brains signal intensity. This would be most prominent for the patient group since brain anatomy changes have commonly been reported in this group (see review by McCarley et al., 1999; Takahashi et al., 2006). Moreover it is unclear what effect antipsychotic medication may have on brain structure and function (see, e.g., recent longitudinal studies by Ho et al., 2011; van Haren et al., 2011). Lastly, the heterogeneity of symptoms in the SZ group could have influence on the results.
Conflict of Interest Statement
Erik Johnsen has received honoraria for lectures given in meetings arranged by Bristol-Myers Squibb, Eli Lilly, and AstraZeneca, and for a contribution to an information brochure by Eli Lilly. Erik Johnsen has been reimbursed by the Eli Lilly Company and the Janssen Cilag Company for attending conferences. Kenneth Hugdahl owns stock in the NordicNeuroLab Inc., who supplied the audio-visual equipment for stimulus presentations. Jan Øystein Berle has received honoraria for lectures given in meetings arranged by Bristol-Myers Squibb, Eli Lilly, and AstraZeneca, and for a contribution to an information brochure by Eli Lilly. He has participated in educational workshop sent on satellite television reporting from APA Meetings, USA (San Diego, Honolulu) in program set up by Eli Lilly. He also serves in an Advisory Board on Zyprexa/ZypAdhera for Eli Lilly Norway. Author Rune A. Kroken has reimbursed by Eli Lilly, Janssen Cilag Bristol-Myers Squibb, and Lundbeck for attending conferences. Hugo A. Ørgensen has received honoraria for contribution to an information brochure by Eli Lilly. All other authors declare that they have no conflicts of interest.
Acknowledgments
The authors thank first of all the participants who contributed to this study. We also like to thank the radiographers at Haukeland University Hospital; Roger Bardon, Turid Randa, and Eva Øksnes, and the psychiatric research nurse, Marianne Langeland at the Research Department, Division of Psychiatry. The present research was funded by grants from the European Research Council (ERC) and the Research Council of Norway (RCN) to Kenneth Hugdahl.
Footnotes
References
Adams, R., and David, A. S. (2007). Patterns of anterior cingulate activation in schizophrenia: a selective review. Neuropsychiatr. Dis. Treat. 3, 87–101.
Agarwal, N., Port, J. D., Bazzocchi, M., and Renshaw, P. F. (2010). Update on the use of MR for assessment and diagnosis of psychiatric diseases. Radiology 255, 23–41.
Arnsten, A. F., Paspalas, C. D., Gamo, N. J., Yang, Y., and Wang, M. (2010). Dynamic network connectivity: a new form of neuroplasticity. Trends Cogn. Sci. (Regul. Ed.) 14, 365–375.
Ashburner, J., and Friston, K. J. (1999). Nonlinear spatial normalization using basis functions. Hum. Brain Mapp. 7, 254–266.
Bassett, D. S., Bullmore, E., Verchinski, B. A., Mattay, V. S., Weinberger, D. R., and Meyer-Lindenberg, A. (2008). Hierarchical organization of human cortical networks in health and schizophrenia. J. Neurosci. 28, 9239–9248.
Bell, A. J., and Sejnowski, T. J. (1995). An information-maximization approach to blind separation and blind deconvolution. Neural Comput. 7, 1129–1159.
Berndl, K., Von Cranach, M., and Grusser, O. J. (1986). Impairment of perception and recognition of faces, mimic expression and gestures in schizophrenic patients. Eur. Arch. Psychiatry Neurol. Sci. 235, 282–291.
Bouma, A., and Gootjes, L. (2011). Effects of attention on dichotic listening in elderly and patients with dementia of the Alzheimer type. Brain Cogn. 76, 286–293.
Brown, G. G., and Thompson, W. K. (2010). Functional brain imaging in schizophrenia: selected results and methods. Curr. Top. Behav. Neurosci. 4, 181–214.
Bush, G., Luu, P., and Posner, M. I. (2000). Cognitive and emotional influences in anterior cingulate cortex. Trends Cogn. Sci. (Regul. Ed.) 4, 215–222.
Calhoun, V. D., Adali, T., Pearlson, G. D., and Pekar, J. J. (2001). Spatial and temporal independent component analysis of functional MRI data containing a pair of task-related waveforms. Hum. Brain Mapp. 13, 43–53.
Calhoun, V. D., Eichele, T., and Pearlson, G. (2009). Functional brain networks in schizophrenia: a review. Front. Hum. Neurosci. 3:17. doi:10.3389/neuro.09.017.2009
Calhoun, V. D., Kiehl, K. A., and Pearlson, G. D. (2008). Modulation of temporally coherent brain networks estimated using ICA at rest and during cognitive tasks. Hum. Brain Mapp. 29, 828–838.
Callicott, J. H., Mattay, V. S., Verchinski, B. A., Marenco, S., Egan, M. F., and Weinberger, D. R. (2003). Complexity of prefrontal cortical dysfunction in schizophrenia: more than up or down. Am. J. Psychiatry 160, 2209–2215.
Callicott, J. H., Ramsey, N. F., Tallent, K., Bertolino, A., Knable, M. B., Coppola, R., Goldberg, T., Van Gelderen, P., Mattay, V. S., Frank, J. A., Moonen, C. T., and Weinberger, D. R. (1998). Functional magnetic resonance imaging brain mapping in psychiatry: methodological issues illustrated in a study of working memory in schizophrenia. Neuropsychopharmacology 18, 186–196.
Camchong, J., Macdonald, A. W. III, Bell, C., Mueller, B. A., and Lim, K. O. (2011). Altered functional and anatomical connectivity in schizophrenia. Schizophr. Bull. 37, 640–650.
Cole, M. W., Pathak, S., and Schneider, W. (2010). Identifying the brain’s most globally connected regions. Neuroimage 49, 3132–3148.
Craig, A. D. (2009). How do you feel – now? The anterior insula and human awareness. Nat. Rev. Neurosci. 10, 59–70.
Dias, E. C., Butler, P. D., Hoptman, M. J., and Javitt, D. C. (2011). Early sensory contributions to contextual encoding deficits in schizophrenia. Arch. Gen. Psychiatry 68, 654–664.
Diwadkar, V. A., Segel, J., Pruitt, P., Murphy, E. R., Keshavan, M. S., Radwan, J., Rajan, U., and Zajac-Benitez, C. (2011). Hypo-activation in the executive core of the sustained attention network in adolescent offspring of schizophrenia patients mediated by premorbid functional deficits. Psychiatry Res. 192, 91–99.
Egan, M. F., Straub, R. E., Goldberg, T. E., Yakub, I., Callicott, J. H., Hariri, A. R., Mattay, V. S., Bertolino, A., Hyde, T. M., Shannon-Weickert, C., Akil, M., Crook, J., Vakkalanka, R. K., Balkissoon, R., Gibbs, R. A., Kleinman, J. E., and Weinberger, D. R. (2004). Variation in GRM3 affects cognition, prefrontal glutamate, and risk for schizophrenia. Proc. Natl. Acad. Sci. U.S.A. 101, 12604–12609.
Egeland, J., Rund, B. R., Sundet, K., Landrø, N. I., Asbjørnsen, A., Lund, A., Roness, A., Stordal, K. I., and Hugdahl, K. (2003). Attention profile in schizophrenia compared with depression: differential effects of processing speed, selective attention and vigilance. Acta Psychiatrica Scandinavica, 108, 276–284.
Erhardt, E. B., Rachakonda, S., Bedrick, E. J., Allen, E. A., Adali, T., and Calhoun, V. D. (2011). Comparison of multi-subject ICA methods for analysis of fMRI data. Hum. Brain Mapp. 32, 2075–2095.
Friston, K., Phillips, J., Chawla, D., and Büchel, C. (1999). Revealing interactions among brain systems with nonlinear PCA. Hum. Brain Mapp. 8, 92–97.
Fu, C. H., Suckling, J., Williams, S. C., Andrew, C. M., Vythelingum, G. N., and Mcguire, P. K. (2005). Effects of psychotic state and task demand on prefrontal function in schizophrenia: an fMRI study of overt verbal fluency. Am. J. Psychiatry 162, 485–494.
Garrity, A. G., Pearlson, G. D., Mckiernan, K., Lloyd, D., Kiehl, K. A., and Calhoun, V. D. (2007). Aberrant “default mode” functional connectivity in schizophrenia. Am. J. Psychiatry 164, 450–457.
Gold, J. M., and Harvey, P. D. (1993). Cognitive deficits in schizophrenia. Psychiatr. Clin. North Am. 16, 295–312.
Green, M. F., Kern, R. S., Braff, D. L., and Mintz, J. (2000). Neurocognitive deficits and functional outcome in schizophrenia: are we measuring the “right stuff?” Schizophr. Bull. 26, 119–136.
Green, M. F., Kern, R. S., and Heaton, R. K. (2004). Longitudinal studies of cognition and functional outcome in schizophrenia: implications for MATRICS. Schizophr. Res. 72, 41–51.
Guerrero-Pedraza, A., Mckenna, P. J., Gomar, J. J., Sarro, S., Salvador, R., Amann, B., Carrion, M. I., Landin-Romero, R., Blanch, J., and Pomarol-Clotet, E. (2011). First-episode psychosis is characterized by failure of deactivation but not by hypo- or hyperfrontality. Psychol. Med. 42, 1–12.
Gur, R. E., and Gur, R. C. (2010). Functional magnetic resonance imaging in schizophrenia. Dialogues Clin. Neurosci. 12, 333–343.
Harvey, P. D. (2010). Cognitive functioning and disability in schizophrenia. Psychol. Sci. 19, 249–254.
Himberg, J., Hyvarinen, A., and Esposito, F. (2004). Validating the independent components of neuroimaging time series via clustering and visualization. Neuroimage 22, 1214–1222.
Ho, B. C., Andreasen, N. C., Ziebell, S., Pierson, R., and Magnotta, V. (2011). Long-term antipsychotic treatment and brain volumes: a longitudinal study of first-episode schizophrenia. Arch. Gen. Psychiatry 68, 128–137.
Hugdahl, K., and Andersson, L. (1986). The “forced-attention paradigm” in dichotic listening to CV-syllables: a comparison between adults and children. Cortex 22, 417–432.
Hugdahl, K., Løberg, E. M., and Nygård, M. (2009a). Left temporal lobe structural and functional abnormality underlying auditory hallucinations in schizophrenia. Front. Neurosci. 3:1. doi:10.3389/neuro.01.001.2009
Hugdahl, K., Westerhausen, R., Alho, K., Medvedev, S., Laine, M., and Hamalainen, H. (2009b). Attention and cognitive control: unfolding the dichotic listening story. Scand. J. Psychol. 50, 11–22.
Hugdahl, K., Rund, B. R., Lund, A., Asbjornsen, A., Egeland, J., Ersland, L., Landro, N. I., Roness, A., Stordal, K. I., Sundet, K., and Thomsen, T. (2004). Brain activation measured with fMRI during a mental arithmetic task in schizophrenia and major depression. Am. J. Psychiatry 161, 286–293.
Jafri, M. J., Pearlson, G. D., Stevens, M., and Calhoun, V. D. (2008). A method for functional network connectivity among spatially independent resting-state components in schizophrenia. Neuroimage 39, 1666–1681.
Kay, S. R., Fiszbein, A., and Opler, L. A. (1987). The positive and negative syndrome scale (PANSS) for schizophrenia. Schizophr. Bull. 13, 261–276.
Kim, D. I., Manoach, D. S., Mathalon, D. H., Turner, J. A., Mannell, M., Brown, G. G., Ford, J. M., Gollub, R. L., White, T., Wible, C., Belger, A., Bockholt, H. J., Clark, V. P., Lauriello, J., O’Leary, D., Mueller, B. A., Lim, K. O., Andreasen, N., Potkin, S. G., and Calhoun, V. D. (2009a). Dysregulation of working memory and default-mode networks in schizophrenia using independent component analysis, an fBIRN and MCIC study. Hum. Brain Mapp. 30, 3795–3811.
Kim, D. I., Mathalon, D. H., Ford, J. M., Mannell, M., Turner, J. A., Brown, G. G., Belger, A., Gollub, R., Lauriello, J., Wible, C., O’Leary, D., Lim, K., Toga, A., Potkin, S. G., Birn, F., and Calhoun, V. D. (2009b). Auditory oddball deficits in schizophrenia: an independent component analysis of the fMRI multisite function BIRN study. Schizophr. Bull. 35, 67–81.
Lagioia, A., Van De Ville, D., Debbane, M., Lazeyras, F., and Eliez, S. (2010). Adolescent resting state networks and their associations with schizotypal trait expression. Front. Syst. Neurosci. 4:35. doi:10.3389/fnsys.2010.00035
Løberg, E. M., Hugdahl, K., and Green, M. F. (1999). Hemispheric asymmetry in schizophrenia: a “dual deficits” model. Biol. Psychiatry 45, 76–81.
Mannell, M. V., Franco, A. R., Calhoun, V. D., Canive, J. M., Thoma, R. J., and Mayer, A. R. (2010). Resting state and task-induced deactivation: a methodological comparison in patients with schizophrenia and healthy controls. Hum. Brain Mapp. 31, 424–437.
McCarley, R. W., Wible, C. G., Frumin, M., Hirayasu, Y., Levitt, J. J., Fischer, I. A., and Shenton, M. E. (1999). MRI anatomy of schizophrenia. Biol. Psychiatry 45, 1099–1119.
McKiernan, K. A., Kaufman, J. N., Kucera-Thompson, J., and Binder, J. R. (2003). A parametric manipulation of factors affecting task-induced deactivation in functional neuroimaging. J. Cogn. Neurosci. 15, 394–408.
Pearlson, G. D., and Calhoun, V. D. (2009). Convergent approaches for defining functional imaging endophenotypes in schizophrenia. Front. Hum. Neurosci. 3:37. doi:10.3389/neuro.09.037.2009
Pomarol-Clotet, E., Salvador, R., Sarro, S., Gomar, J., Vila, F., Martinez, A., Guerrero, A., Ortiz-Gil, J., Sans-Sansa, B., Capdevila, A., Cebamanos, J. M., and Mckenna, P. J. (2008). Failure to deactivate in the prefrontal cortex in schizophrenia: dysfunction of the default mode network? Psychol. Med. 38, 1185–1193.
Raczkowski, D., Kalat, J. W., and Nebes, R. (1974). Reliability and validity of some handedness questionnaire items. Neuropsychologia 12, 43–47.
Raichle, M. E., Macleod, A. M., Snyder, A. Z., Powers, W. J., Gusnard, D. A., and Shulman, G. L. (2001). A default mode of brain function. Proc. Natl. Acad. Sci. U.S.A. 98, 676–682.
Rasser, P. E., Johnston, P., Lagopoulos, J., Ward, P. B., Schall, U., Thienel, R., Bender, S., Toga, A. W., and Thompson, P. M. (2005). Functional MRI BOLD response to Tower of London performance of first-episode schizophrenia patients using cortical pattern matching. Neuroimage 26, 941–951.
Rotarska-Jagiela, A., Van De Ven, V., Oertel-Knochel, V., Uhlhaas, P. J., Vogeley, K., and Linden, D. E. (2010). Resting-state functional network correlates of psychotic symptoms in schizophrenia. Schizophr. Res. 117, 21–30.
Rund, B. R., Sundet, K., Asbjornsen, A., Egeland, J., Landro, N. I., Lund, A., Roness, A., Stordal, K. I., and Hugdahl, K. (2006). Neuropsychological test profiles in schizophrenia and non-psychotic depression. Acta Psychiatr. Scand. 113, 350–359.
Saccuzzo, D. P., Braff, D. L., and Sprock, J. (1982). The effect of mental retardation and schizophrenia on information processing. J. Nerv. Ment. Dis. 170, 102–106.
Smith, S. M., Fox, P. T., Miller, K. L., Glahn, D. C., Fox, P. M., Mackay, C. E., Filippini, N., Watkins, K. E., Toro, R., Laird, A. R., and Beckmann, C. F. (2009). Correspondence of the brain’s functional architecture during activation and rest. Proc. Natl. Acad. Sci. U.S.A. 106, 13040–13045.
Sridharan, D., Levitin, D. J., and Menon, V. (2008). A critical role for the right fronto-insular cortex in switching between central-executive and default-mode networks. Proc. Natl. Acad. Sci. U.S.A. 105, 12569–12574.
Takahashi, T., Suzuki, M., Zhou, S. Y., Tanino, R., Hagino, H., Niu, L., Kawasaki, Y., Seto, H., and Kurachi, M. (2006). Temporal lobe gray matter in schizophrenia spectrum: a volumetric MRI study of the fusiform gyrus, parahippocampal gyrus, and middle and inferior temporal gyri. Schizophr. Res. 87, 116–126.
van den Noort, M., Specht, K., Rimol, L. M., Ersland, L., and Hugdahl, K. (2008). A new verbal reports fMRI dichotic listening paradigm for studies of hemispheric asymmetry. Neuroimage 40, 902–911.
van Haren, N. E., Schnack, H. G., Cahn, W., Van Den Heuvel, M. P., Lepage, C., Collins, L., Evans, A. C., Hulshoff Pol, H. E., and Kahn, R. S. (2011). Changes in cortical thickness during the course of illness in schizophrenia. Arch. Gen. Psychiatry 68, 871–880.
van Veen, V., and Carter, C. S. (2002). The anterior cingulate as a conflict monitor: fMRI and ERP studies. Physiol. Behav. 77, 477–482.
van Wageningen, H., Jørgensen, H. A., Specht, K., and Hugdahl, K. (2009). Evidence for glutamatergic neurotransmission in cognitive control in an auditory attention task. Neurosci. Lett. 454, 171–175.
Weiss, E. M., Siedentopf, C., Golaszewski, S., Mottaghy, F. M., Hofer, A., Kremser, C., Felber, S., and Fleischhacker, W. W. (2007). Brain activation patterns during a selective attention test – a functional MRI study in healthy volunteers and unmedicated patients during an acute episode of schizophrenia. Psychiatry Res. 154, 31–40.
Whitfield-Gabrieli, S., Thermenos, H. W., Milanovic, S., Tsuang, M. T., Faraone, S. V., Mccarley, R. W., Shenton, M. E., Green, A. I., Nieto-Castanon, A., Laviolette, P., Wojcik, J., Gabrieli, J. D., and Seidman, L. J. (2009). Hyperactivity and hyperconnectivity of the default network in schizophrenia and in first-degree relatives of persons with schizophrenia. Proc. Natl. Acad. Sci. U.S.A. 106, 1279–1284.
Keywords: schizophrenia, fMRI, ICA, cognitive processing, default mode network, executive network, brain activation, dichotic listening
Citation: Nygård M, Eichele T, Løberg E-M, Jørgensen HA, Johnsen E, Kroken RA, Berle JØ and Hugdahl K (2012) Patients with schizophrenia fail to up-regulate task-positive and down-regulate task-negative brain networks: an fMRI study using an ICA analysis approach. Front. Hum. Neurosci. 6:149. doi: 10.3389/fnhum.2012.00149
Received: 25 November 2011; Accepted: 13 May 2012;
Published online: 31 May 2012.
Edited by:
Vince D. Calhoun, University of New Mexico, USAReviewed by:
Vince D. Calhoun, University of New Mexico, USAJudith M. Ford, Yale University School of Medicine, USA
Copyright: © 2012 Nygård, Eichele, Løberg, Jørgensen, Johnsen, Kroken, Berle and Hugdahl. This is an open-access article distributed under the terms of the Creative Commons Attribution Non Commercial License, which permits non-commercial use, distribution, and reproduction in other forums, provided the original authors and source are credited.
*Correspondence: Merethe Nygård, Department of Biological and Medical Psychology, University of Bergen, Jonas Lies vei 91, N-5009 Bergen, Norway. e-mail: merethe.nygard@psybp.uib.no