High dimensional classification of structural MRI Alzheimer’s disease data based on large scale regularization
- 1 Department of Biostatistical Sciences, Wake Forest School of Medicine, Winston-Salem, NC, USA
- 2 Department of Radiology, Wake Forest School of Medicine, Winston-Salem, NC, USA
- 3 Department of Medicine and the Roena Kulynych Center for Memory and Cognition Research, Winston-Salem, NC, USA
- 4 Department of Social Sciences, Wake Forest School of Medicine, Winston-Salem, NC, USA
In this work we use a large scale regularization approach based on penalized logistic regression to automatically classify structural MRI images (sMRI) according to cognitive status. Its performance is illustrated using sMRI data from the Alzheimer Disease Neuroimaging Initiative (ADNI) clinical database. We downloaded sMRI data from 98 subjects (49 cognitive normal and 49 patients) matched by age and sex from the ADNI website. Images were segmented and normalized using SPM8 and ANTS software packages. Classification was performed using GLMNET library implementation of penalized logistic regression based on coordinate-wise descent optimization techniques. To avoid optimistic estimates classification accuracy, sensitivity, and specificity were determined based on a combination of three-way split of the data with nested 10-fold cross-validations. One of the main features of this approach is that classification is performed based on large scale regularization. The methodology presented here was highly accurate, sensitive, and specific when automatically classifying sMRI images of cognitive normal subjects and Alzheimer disease (AD) patients. Higher levels of accuracy, sensitivity, and specificity were achieved for gray matter (GM) volume maps (85.7, 82.9, and 90%, respectively) compared to white matter volume maps (81.1, 80.6, and 82.5%, respectively). We found that GM and white matter tissues carry useful information for discriminating patients from cognitive normal subjects using sMRI brain data. Although we have demonstrated the efficacy of this voxel-wise classification method in discriminating cognitive normal subjects from AD patients, in principle it could be applied to any clinical population.
Introduction
Machine learning methods have become powerful tools for analyzing neuroimaging data. Their multivariate nature allows them to take into consideration correlations present in the data, overcoming limitations of standard analytical approaches. In particular, the prediction capabilities of machine learning methods are ideal for many clinical applications. One area of neuroimaging research where these techniques have gained attention is in the early detection and diagnosis of Alzheimer’s disease (AD). Since it is very likely that the pathophysiologic processes leading to AD start well before the onset of clinically detectable symptoms, methods of early detection are paramount to facilitate subsequent interventions that might decrease progression and morbidity associated with this devastating disease (Mueller et al., 2005a,b). Machine learning techniques could be of great utility for their potential to uncover subtle atrophy patterns in the neuroimaging data that otherwise are very difficult to detect by a human expert using traditional analyses and diagnostic techniques (Davatzikos, 2004).
Brain aging classification analyses of structural MRI images (sMRI) are especially challenging due to the high dimensionality defined by the large number of voxels, while the number of available samples is often small. This characteristic makes the classification problem intrinsically ill-posed and regularization is needed to solve it (Tikhonov and Arsenin, 1977). One way to alleviate the problem is to use dimensionality reduction, for example, via region of interest (ROI) based measures instead of voxels as input features (Lerch et al., 2008; Magnin et al., 2009), principal component analysis (Teipel et al., 2007), or partial least squares (PLS; Phan et al., 2010). Vemuri et al. (2008) have developed a method composed of several steps that uses down sampling of the sMRI images and feature selection to construct the final feature vectors that are fed into a linear support vector machine (SVM; Boser et al., 1992; Vapnik, 1998) for the final classification step. Davatzikos and colleagues have developed a methodology called COMPARE (Fan et al., 2007) that also consists of several steps that combine filtering, image processing, and feature selection procedures, with the goal of identifying homogeneously discriminative regions that are fed into a non-linear SVM. In the case of COMPARE, the processing steps are preceded by a normalization procedure based on a high dimensional warping method called HAMMER (Shen and Davatzikos, 2002). Potential drawbacks of all these approaches are the possibility of discarding useful information present in the images during the dimension reduction process and producing features that do not necessarily follow the patterns associated with different disease processes. In order to avoid these problems it would be desirable to have a classification procedure able to directly operate on voxel space. We introduce here a large scale classification method based on penalized logistic regression, as well as on recent methodological developments in optimization and regularization theory. Different versions of penalized logistic regression have been used before in genetics research to analyze microarray and sequence data (Shevade and Keerthi, 2003; Zhu and Hastie, 2004; Liu et al., 2007; Park and Hastie, 2008), stroke deficits prediction (Phan et al., 2010), fMRI data analysis (Yamashita et al., 2008; Ryali et al., 2011), and to study associations of brain tissue atrophy to hormone therapy treatments (Casanova et al., 2011). Here, our main aim is prediction of cognitive status based on sMRI images via large scale regularization, or, in other words, solving problems of very large size. For this purpose we applied PLR with coordinate-wise descent optimization as implemented in the GLMNET library (Friedman et al., 2007, 2010) to solve the classification problem. This family of methods is very efficient and has the ability to deal with very large classification and regression problems, as the one posed by voxel-wise classification of sMRI images. We combine our classification procedures with a high dimensional normalization procedure implemented in the software package ANTS, which is based on symmetric diffeomorphic registration (SyN; Avants et al., 2008). In the largest evaluation of non-linear brain registration algorithms to date, SyN was found to be a top-ranking performer, providing among the best results according to overlap and distance measures, and delivering the most consistently high accuracy across subjects and label sets (Klein et al., 2009). Previous work has evaluated ANTS performance when automated labeling of elderly and neurodegenerative brain images is carried out (Avants et al., 2008) and also the impact of ANTS similarity metrics on brain image registration (Avants et al., 2011). Our work sheds further light about ANTS performance in the context of machine learning analyses of brain imaging data and specifically for automatic detection of AD.
There are a few classification methodologies that rely on large scale regularization; most are based on SVM (Ashburner, 2007; Kloppel et al., 2008; Cuingnet et al., 2010a) and the kernel approach. For example, Kloppel and colleagues used linear SVM for automatic classification of gray matter (GM) maps combining it with a high dimensional normalization technique called DARTEL (Ashburner, 2007; Kloppel et al., 2008). We characterize the performance of our approach by reporting the accuracy, sensitivity, and specificity of classifying sMRI images downloaded from the Alzheimer’s Disease Neuroimaging Initiative (ADNI) website (Mueller et al., 2005a; Petersen et al., 2009). We also study how informative different brain tissues and morphometric measures are for automatic classification of sMRI in AD.
Materials and Methods
ADNI Database
Magnetic resonance imaging (MRI) data used in this study were obtained from the ADNI database1 sponsored by the NIH and industrial partners. The primary goal of ADNI is to test whether serial MRI, positron emission tomography (PET), other biological markers, and clinical and neuropsychological assessment can measure the progression of mild cognitive impairment (MCI) and early AD. Further information can be found in (Mueller et al., 2005b) and at www.adni-info.org.
Participants
We used baseline 1.5T T1-weighted MRI data as described in the ADNI acquisition protocol (Jack et al., 2008) from 49 subjects with AD and 49 cognitively normal controls (CN). The selected controls did not convert to MCI across the follow-up period of 36 months. The average age and baseline MMSE score was 76 and 29.9 for the controls, and 75 and 23.6 for the AD group, respectively. The two groups were matched approximately by sex (AD – 24 m, 25 f and CN – 25 f, 24 m).
MRI Scans
The ADNI protocol acquires two sets of structural data at each visit. These data are rated for image quality and artifacts by ADNI investigators (Jack et al., 2008). To enhance standardization across sites and platforms, the best quality data set then undergoes additional preprocessing, including correction for gradient non-linearity (Jovicich et al., 2006) and correction for intensity non-uniformity (Narayana et al., 1988). In the present study, these optimally pre-processed images were downloaded from the ADNI database and used for subsequent analysis in this study.
Image Processing
Symmetric diffeomorphic registration
Identification of differences in populations on the basis of imaging studies is highly dependent on the ability to precisely align the cortical and subcortical features between different subjects. SyN uses diffeomorphisms (differentiable and invertible maps with differentiable inverse) to capture both large deformations and small shape changes (Avants et al., 2008). The SyN normalization procedures have been implemented in the freely available ANTS software toolbox. A separate pipedream toolbox is also available, which scripts the procedures for implementation on grid computing systems. We created a series of in-house matlab wrappers for accessing the ANTS and pipedream programs allowing user-tunable parameter modifications and work-flow definition with run-time batch script generation for implementation on the Sun Grid Engine. The data were processed using a 30-node computer cluster. In Figure 1 a flowchart outlining the preprocessing steps described next is presented.
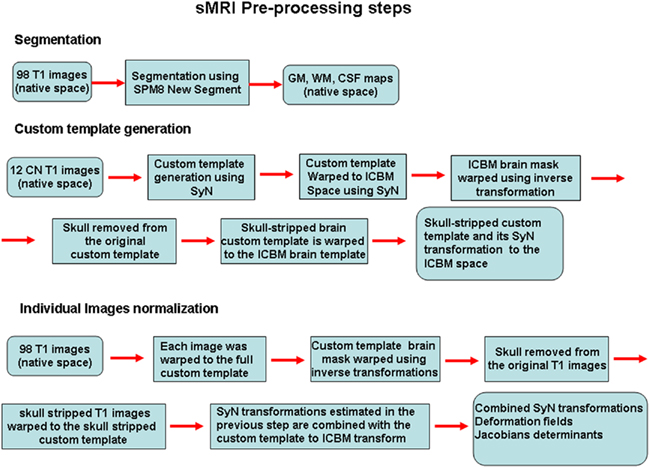
Figure 1. A flowchart outlining the preprocessing steps is presented. The non-linear transformations from the SyN procedure provide deformation tensor fields describing the voxel-wise shape changes from the template to each subject’s brain. The Jacobian determinants of these deformation fields indicate the fractional volume expansion and contraction at each voxel required to match the template. The native space gray matter segmentation maps generated from the SPM8 new segment procedure were brought into template space using the combined SyN transform. The Jacobian maps were then multiplied by the respective GM or WM segmentation maps to limit analysis to gray matter or white matter volume changes. The modulated GM, WM, and Jacobian maps were evaluated separately in the machine learning analyses.
Custom template construction
A custom MRI template representing the average of the brain images from a subset of 12 elderly normal subjects, selected at random from the 49 CN described above, was built using a diffeomorphic shape and intensity averaging technique Parameters for the template construction procedure included a four-level Gaussian pyramid as the multi-resolution strategy and the cross-correlation similarity metric, with 200 maximum iterations. A two-step normalization procedure was used to generate a highly accurate skull-stripped version of the custom template normalized to the ICBM atlas. The steps for building the template can be summarized as follows:
(1) Selecting 12 CN subjects at random
(2) Using SyN (Avants and Gee, 2004; Avants et al., 2008) an unbiased average shape and appearance template was generated.
(3) The resulting study template was then normalized to the ICBM T1 label atlas2 in order to allow automated label information to be obtained from each subject. The ICBM atlas files include a high resolution T1 image, segmented labels, and a brain mask.
(4) A skull-stripped version of the custom template is generated by applying the inverse transformation resulting from the previous step to the ICBM brain mask with then is applied to the original custom template to remove the skull.
(5) A second SyN normalization was then performed using the skull-stripped custom template and the skull-stripped ICBM atlas to generate the final transformation parameters defining custom template space to ICBM template space.
These procedures produced a full custom template (with scalp), a scalp stripped version of the custom template, a custom template brain mask, and fully invertible parameters defining custom template space to ICBM atlas space.
Segmentation
The optimal T1-weighted data for each subject were segmented using the SPM8 new segment tool (Ashburner and Friston, 2005). This performs a five-class segmentation using prior probability maps with classes for GM, white matter, CSF, adipose tissue, and bone. The procedure also performs a high dimensional normalization to the SPM MNI template based on a model with approximately 1000 parameters. The normalized MNI space transformations and images generated by SPM however, were not employed in this study.
Spatial normalization
The native space optimal T1-weighted images obtained from the ADNI database for each subject were used for image analysis. These images had already undergone gradient field inhomogeneity correction, and N3 bias correction. Each optimal subject T1 image was normalized to the custom study template using SyN (Avants and Gee, 2004; Avants et al., 2008) in a two-step process similar to the one used to generate the custom template in ICBM space. The steps can be summarized as follows:
(1) Each subject image was normalized to the full custom template.
(2) The inverse transformation and the custom template brain mask were then used to generate a skull-stripped version of the subject T1 image in native space.
(3) A second SyN normalization was then performed between the skull-stripped native T1 image and the skull-stripped custom template.
(4) The previously computed custom template to ICBM normalization parameters were combined with the native space to custom template parameters, generating a set of transformation parameters to bring native space T1 images into ICBM space with a single resampling step.
The non-linear transformations from the SyN procedure provide deformation tensor fields describing the voxel-wise shape changes from the template to each subject’s brain. The Jacobian determinants of these deformation fields indicate the fractional volume expansion and contraction at each voxel required to match the template. These maps can be used directly as in tensor-based morphometry to determine population differences, or they can be combined with the segmentation maps to generate maps of tissue-specific volume change (modulated maps). The native space GM segmentation maps generated from the SPM8 new segment procedure were brought into template space using the combined SyN transform. The Jacobian maps were then multiplied by the respective GM or WM segmentation maps (thresholded at 0.3) to limit analysis to GM or white matter volume changes. The modulated GM, WM, and Jacobian maps were evaluated separately in the machine learning analyses.
Penalized Logistic Regression
Logistic regression is a common choice when the response variable Y is binary. It models the class-conditional probabilities through a linear function of predictors
In problems where the number of predictors (voxels in our case) is much greater than the number of samples (vectorized GM, WM, and Jacobian images in our case) it is necessary to apply regularization (Tikhonov and Arsenin, 1977). In the present study, we evaluate the performance of penalized logistic regression when applied to classification of sMRI images as implemented in the GLMNET library (Friedman et al., 2010). In general GLMNET solves the problem defined by

where N is the number of samples (98 subjects in our case), xi∈Rp is the ith sample or feature vector containing the gray and/or white matter voxels entering the analysis, p is the number of voxels entering the analysis, yi∈{1,2} is the ith label (1 for CN and 2 for AD participants), β0, β∈Rp+1 are the parameters of the model, and λ is the regularization parameter. The regularization scheme described by Eq. 2 contains two terms: a loss term defined by the logistic loss or binomial deviance function and a penalty term called elastic net which is a linear combination of L1 and L2 penalties. The first term drives the fidelity of the solution to the data and the second term introduces constrains to the solution in order to stabilize the problem. The regularization parameter λ regulates a tradeoff between these two criteria. In this case we forced α = 0 in order to enforce the L2 penalization in a similar manner to ridge regression (Hoerl, 1962).
The GLMNET library (Friedman et al., 2010) uses a very efficient optimization technique called coordinate-wise descent (Friedman et al., 2007). The basic idea of the method is to solve a sequence of one dimensional optimization problems by fixing all variables except one. The process is iterated until convergence. This class of methods has been independently developed by different groups (Fu, 1998; Daubechies et al., 2004; Krishnapuram and Hartemink, 2005) and its convergence has been proven for classes of convex optimization problems (Tseng, 1988). Our software implementation is based on MATLAB where the glmnet library is called using a freely available matlab wrapper developed by Hui Jiang.3
Evaluation of Classifier Performance and Estimation of Regularization Parameters
To estimate the optimal values of the regularization parameters, we combined a three-way split of the data (training–validation–testing) with 10-fold cross-validations (CV) and grid search. This was done to avoid upward bias in the metrics of performance estimates (Guyon and Elisseeff, 2003; Ritchie et al., 2003; Su et al., 2007; Cheng et al., 2008; Chu, 2009a; Ryali et al., 2010). We implemented an external K1-fold CV where at each step we leave onefold for testing and use the remaining K1 − 1-folds for training and validation. These last two procedures are implemented by using a nested K2-fold CV. We divide the K1 − 1-folds into K2-folds and we leave onefold for validation and K2 − 1-folds for training combined with a grid search to determine the optimal parameters. The grid we used in our analyses was λ = 0.5, 1, 5, 10, 11, 12…98, 99, 100, 200, 500, 1000. At each grid point, the classifier is trained and its performance is assessed using the fold left for validation by estimating the classification accuracy. We select the regularization parameters that produce maximum average accuracy across the K2-folds of the internal CV procedure. The classifier is then retrained using the data in the K1 − 1-folds left for training and validation and the selected optimal regularization parameters. The classifier’s generalization capability is then evaluated by computing the classification accuracy, sensitivity, and specificity (see below) using the fold originally left for testing in the external CV. This is repeated K1 times and the average classification accuracy is computed.
Finally, the discriminative maps are generated. The vector β of parameters (or classifier’s weights) described in Eq. 2 are estimated using the whole data set and the average values of the selected optimal regularization parameters across the K1-folds. These weights (one per voxel) are then employed to generate the discriminative maps which reflect the brain areas that were more informative when discriminating between the two groups of subjects. The discriminative maps presented in Figure 2 represent the average of the weights vectors β obtained across 10 repetitions of the computations to evaluate variability due to CV partitioning.
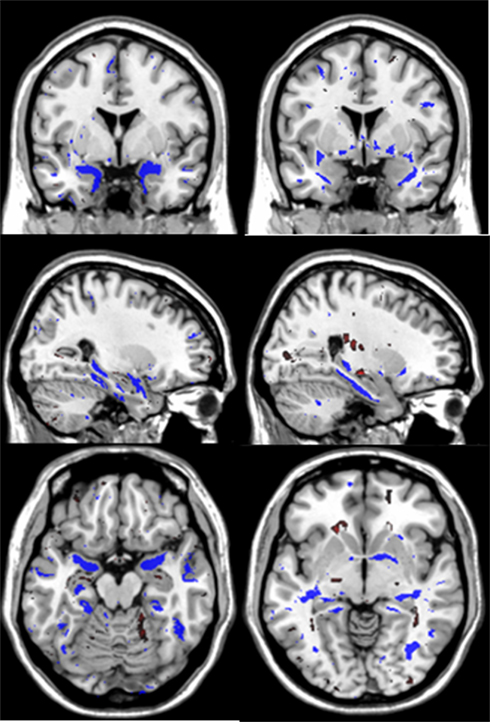
Figure 2. These are the average discriminative maps computed using the PLR model parameters (voxels weights) that were estimated across the 10 repetitions of the computations. The left and right columns present coronal, sagittal and axial views of the discriminative maps associated to GM and WM tissues respectively. The views follow the neurological convention. In blue are indicated brain areas associated with increased likelihood of classification as AD while red indicates the opposite.
In our analyses we used K1 = 10 and K2 = 10. We used 10-fold CV (K1 = K2 = 10) because it has been recommended in the general machine learning literature (Breiman and Spector, 1992; Kohavi, 1995). The leave-one-out (LOO) CV is known to be approximately unbiased but highly variable and in addition computationally time consuming. Tenfold CV is a less time consuming tradeoff between both criteria.
Metrics of Performance
We computed overall classification accuracy, sensitivity, and specificity to evaluate classifier performance:
where TP are AD patients correctly identified as AD, TN are controls correctly classified as controls, FN are AD patients incorrectly identified as controls and FP are controls incorrectly identified as AD. These metrics describe the degree to which gray and white matter tissue types are informative when predicting CN and AD, using the specific tissue voxel-wise volumetric and deformation information. To study the variation due to different CV partitions we repeat the computation 10 times and report mean and SD of the three metrics described above (Table 1).
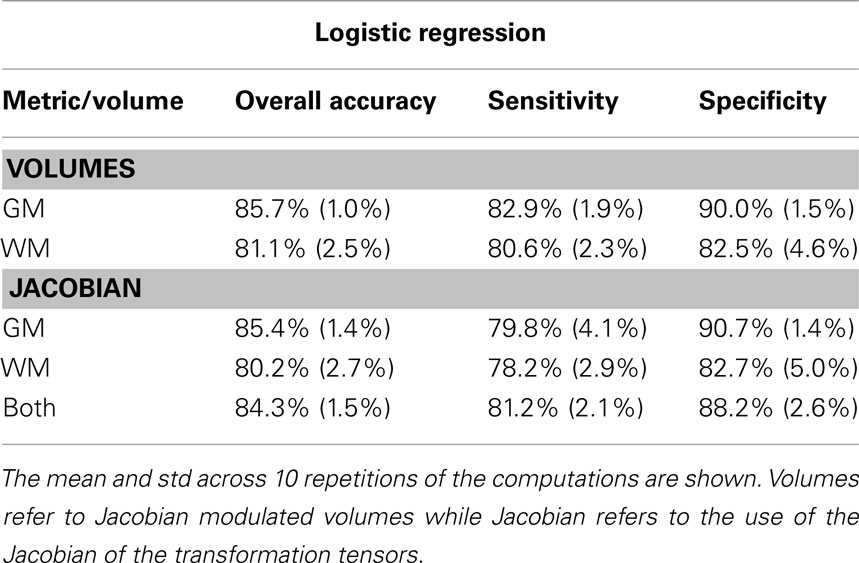
Table 1. Overall accuracy, sensitivity, and specificity obtained for different brain tissues.
Results
Both gray and white matter tissue types were very informative for CN–AD classification, although GM produced typically higher and less variable values than white matter (Table 1). The use of the deformation data instead of the modulated volumes did not lead to improvement in subsequently calculated metrics. Figure 2 shows the discriminative maps obtained by averaging the weight maps of the 10 repetitions using gray and white matter volumetric information. The blue areas indicate increased likelihood of classification as AD while the red areas are associated with increased likelihood of classification as CN.
The GM discriminative maps show excellent localization to temporal lobe structures including the hippocampus, parahippocampal gyrus and inferior and middle temporal gyri. Other areas include bilateral basal ganglia, posterior parietal cortex, frontal, and cerebellar areas. The white matter discriminative maps localize to temporal lobe white matter areas associated with the hippocampus, parahippocampal gyrus, inferior, and middle temporal gyri. Additional areas include the anterior commissure, splenium and body of the corpus callosum, forniceal columns, external capsule and bilateral parietal and occipital white matter regions.
Discussion
We have evaluated the use of penalized logistic regression for the automatic voxel-wise classification of sMRI images of a subset of CN and AD ADNI participants. We have based our analyses on very recent and powerful methodological developments in the fields of optimization and regularization theory. The GLMNET library employed in this work solves the problem described by Eq. 2 using coordinate-wise descent techniques (Friedman et al., 2007, 2010) that provide an efficient mechanism to solve problems of high dimension.
The approach applied here is one of the few (Kloppel et al., 2008; Cuingnet et al., 2010b; Hinrichs et al., 2011) reported in the AD classification sMRI literature that directly operate in the voxel space. Some previous approaches (Fan et al., 2007; Vemuri et al., 2008; Davatzikos et al., 2009) developed complex image processing steps that are time consuming driven by the need of dealing with the curse of dimensionality (Bellman, 1961; Donoho, 2000). While the curse of dimensionality is a real problem (which is still poorly understood), its effects on machine learning algorithms vary. One of the main merits of our work is to show that by using PLR and coordinate-wise descent techniques, it is possible to achieve excellent prediction performance when solving very large classification problems. The number of voxels in our analyses for the different tissues varied between 5.7 × 10⁵ (WM analyses), 7.4 × 10⁵ (GM analyses), and 2 × 10⁶ (whole brain analyses Jacobian based), while operating with 98 samples. Our results taken together with those previously reported in relation to SVMs and kernel approaches (Kloppel et al., 2008; Chu, 2009b) suggest that the regularization mechanisms associated to these linear classifiers effectively deal with classification problems of very large dimension. The difference is that the approach presented here operates directly in the voxel space via coordinate-wise descent optimization while previous SVM work (Kloppel et al., 2008) by making use of the kernel approach (representer theorem; Kimeldorf and Wahba, 1971; Scholkopf and Smola, 2002) solve an optimization problem of much lower dimensions. This work provides evidence that is not the dimension reduction implicit in linear SVM kernel based methods what makes them to deal effectively with problems of large size but the associated regularization penalty.
On the other hand, the results obtained with PLR predicting cognitive status seem to be very competitive with other previously reported by other researchers. The sensitivities and specificities of 10 of the most successful sMRI classification methods have recently been compared using ADNI data (Cuingnet et al., 2010c). The best performer in this group achieved sensitivity of 81% and specificity of 95% using a voxel-wise approach with a SVM and the high dimensional DARTEL normalization procedure. Although these results cannot be directly compared to ours for several reasons (differing ADNI samples, sample size, CV procedures, etc.) they serve as a reference, suggesting that our approach reaches similar levels of sensitivity and specificity to the best performers in the comparison.
One advantage of penalized logistic regression over SVMs which have dominated the field so far is that logistic regression directly models the class-conditional probabilities providing a decision probability and not just binary classification, which is very desirable property in a classification algorithm that can be very useful in a clinical setting. These probabilities could be used as an alternative to already existing diagnostic metrics such as STAND-scores or SPARE-AD index (Vemuri et al., 2008; Davatzikos et al., 2009). There several potential ways to improve the approach presented here, for example: (1) by introducing spatial constraints via regularization operators (Pascual-Marqui et al., 1994; Casanova et al., 2009; Cuingnet et al., 2010b); (2) By incorporating feature selection and (3) By using more sophisticated penalties.
We found that both GM and WM carry useful information for classification of CN and AD sMRI images, producing high levels of accuracy, sensitivity, and specificity. The large scale regularization approach used here provides discriminative maps localizing the changes to GM structures known to be involved in AD. For example, changes in GM associated with AD have been described to affect the entorhinal cortex and hippocampus before spreading to other temporal, frontal, and parietal areas, many of which were useful for discriminating AD patients from CN subjects in the present study (Braak and Braak, 1991, 1997; Gomez-Isla et al., 1996; Laakso et al., 1996, 1998; Insausti et al., 1998; Frisoni et al., 1999, 2007; Van Hoesen et al., 2000; Dickerson et al., 2001; Thompson et al., 2003, 2007; Apostolova and Thompson, 2008). The white matter discriminative maps add to a growing body of literature on white matter volume loss in AD (Black et al., 2000; Moon et al., 2008; Di Paola et al., 2010). Several studies have identified volume loss in various portions of the corpus callosum (Di Paola et al., 2010). The callosal white matter loss has been related to Wallerian degeneration, receiving axons from the temporo-parietal regions involved in AD. Other regions of white matter loss in AD have been less well studied.
Several methodological aspects of this study are worth noting. We utilized a high dimensional warping algorithm to bring the individual structural images into alignment. In particular, we used the SyN methodology, which has been shown to be a top performing method for image normalization. In addition, we used the SyN methodology in a two-step normalization procedure, with the sole purpose of the first step to perform skull-stripping. While there are a variety of skull-stripping algorithms available, in our own testing, we have found the quality of the SyN full brain normalization to provide consistently excellent results allowing direct masking of the results on the basis of the template brain image, without the need for additional manual editing. This enables a second high dimensional normalization of the skull-stripped brain to a skull-stripped template, allowing for a more accurate registration procedure without confounds of extraneous tissues affecting the normalization. We combined the SyN methodology with the SPM8 new segment tool for primary tissue type segmentation. While there are a variety of image segmentation methods available, we have found that the SPM8 multi-class segmentation algorithm performs especially well with elderly brain images as in the ADNI cohort. Proper segmentation in this age group can be very problematic due to the high white matter lesion load, which intensity based segmentation procedures can erroneously classify as GM, adversely affecting classification accuracy. In comparing classification accuracy for modulated GM, modulated white matter, and direct use of the Jacobian, we found the highest accuracy for the modulated GM maps. Interestingly, although classification accuracies were also high for the other input image types, the use of the full Jacobian map (which includes deformation information on gray, white, and CSF) did not improve the classification accuracy (not presented). A limitation of this study is that we did not study here the performance of this approach to detect patients with prodromal AD something that will be pursued in future work.
Conclusion
In this work we have introduced a large scale regularization approach based on penalized logistic regression to automatically classify sMRI according to cognitive status. Its performance is illustrated using sMRI data from the ADNI clinical database. This research represents one of the first steps of this voxel-wise methodology which could be improved by using more sophisticated penalties such as group lasso (Xu et al., 2010) or through combinations with other methods. We have shown that very large classification problems can be dealt with directly in the in the voxel space without severe dimension reduction measures such as filtering, PCA, PLS, etc., via the use of coordinate-wise descent techniques. To avoid optimistic estimates classification accuracy, sensitivity, and specificity were determined based on a combination of three-way split of the data with nested 10-fold CV.
In the future we intend to develop this work in several directions: (1) study the performance of imaging biomarkers for early prediction of AD based on the conditional probabilities modeled by PLR; (2) The evaluation of these technologies in the context of large size problems characteristic of imaging genetics and (3) the application of these methods to analyses across imaging clinical databases.
Conflict of Interest Statement
The authors declare that the research was conducted in the absence of any commercial or financial relationships that could be construed as a potential conflict of interest.
Acknowledgments
This work is funded in part by the NIH Supplement # HHSN268200464221C added to the N01-WH-4-4221 grant. Data collection and sharing for this project was funded by the Alzheimer’s Disease Neuroimaging Initiative (ADNI; Principal Investigator: Michael Weiner; NIH grant U01 AG024904). ADNI is funded by the National Institute on Aging, the National Institute of Biomedical Imaging and Bioengineering (NIBIB), and through generous contributions from the following: Pfizer Inc., Wyeth Research, Bristol-Myers Squibb, Eli Lilly and Company, GlaxoSmithKline, Merck Co. Inc., AstraZeneca AB, Novartis Pharmaceuticals Corporation, Alzheimer’s Association, Eisai Global Clinical Development, Elan Corporation plc, Forest Laboratories, and the Institute for the Study of Aging, with participation from the U.S. Food and Drug Administration. Industry partnerships are coordinated through the Foundation for the National Institutes of Health. The grantee organization is the Northern California Institute for Research and Education, and the study is coordinated by the Alzheimer’s Disease Cooperative Study at the University of California San Diego. ADNI data are disseminated by the Laboratory of NeuroImaging at the University of California Los Angeles. We also thank the anonymous reviewers for their thoughtful comments that allowed improving the work presented here.
Footnotes
References
Apostolova, L. G., and Thompson, P. M. (2008). Mapping progressive brain structural changes in early Alzheimer’s disease and mild cognitive impairment. Neuropsychologia 46, 1597–1612.
Avants, B., and Gee, J. C. (2004). Geodesic estimation for large deformation anatomical shape averaging and interpolation. Neuroimage 23(Suppl. 1), S139–S150.
Avants, B. B., Epstein, C. L., Grossman, M., and Gee, J. C. (2008). Symmetric diffeomorphic image registration with cross-correlation: evaluating automated labeling of elderly and neurodegenerative brain. Med. Image Anal. 12, 26–41.
Avants, B. B., Tustison, N. J., Song, G., Cook, P. A., Klein, A., and Gee, J. C. (2011). A reproducible evaluation of ANTs similarity metric performance in brain image registration. Neuroimage 54, 2033–2044.
Bellman, R. E. (1961). Adaptive Control Processes: A Guided Tour. Princeton, NJ: Princeton University Press.
Black, S. E., Moffat, S. D., Yu, D. C., Parker, J., Stanchev, P., and Bronskill, M. (2000). Callosal atrophy correlates with temporal lobe volume and mental status in Alzheimer’s disease. Can. J. Neurol. Sci. 27, 204–209.
Boser, B., Guyon, I., and Vapnik, V. (1992). “A training algorithm for optimal margin classifiers,” in Fifth Annual Workshop on Computational Learning Theory (Pittsburgh: ACM), 144–152.
Braak, H., and Braak, E. (1991). Neuropathological stageing of Alzheimer-related changes. Acta Neuropathol. 82, 239–259.
Braak, H., and Braak, E. (1997). Staging of Alzheimer-related cortical destruction. Int. Psychogeriatr. 9(Suppl. 1), 257–261; discussion 269–272.
Breiman, L., and Spector, P. (1992). Submodel selection and evaluation in regression: The X-random case. Int. Stat. Rev. 60, 291–319.
Casanova, R., Espeland, M. A., Goveas, J. S., Davatzikos, C., Gaussoin, S. A., Maldjian, J. A., Brunner, R. L., Kuller, L. H., Johnson, K. C., Mysiw, W. J., Wagner, B., Resnick, S. M., and Women’s Health Initiative Memory Study. (2011). Application of machine learning methods to describe the effects of conjugated equine estrogens therapy on region-specific brain volumes. Magn. Reson. Imaging 29, 546–553.
Casanova, R., Yang, L., Hairston, W. D., Laurienti, P. J., and Maldjian, J. A. (2009). Evaluating the impact of spatio-temporal smoothness constraints on the BOLD hemodynamic response function estimation: an analysis based on Tikhonov regularization. Physiol. Meas. 30, N37–N51.
Cheng, C. W., Su, E. C., Hwang, J. K., Sung, T. Y., and Hsu, W. L. (2008). Predicting RNA-binding sites of proteins using support vector machines and evolutionary information. BMC Bioinformatics 9(Suppl. 12), S6. doi: 10.1186/1471-2105-9-S12-S6
Chu, C. K. (2009a). “Pattern recognition and machine learning for magnetic resonance images with kernel methods,” in Wellcome Trust Center for Neuroimaging (London: University College London).
Chu, C. K. (2009b). Pattern Recognition and Machine Learning for Magnetic Resonance Images with Kernel Methods. London: University College London.
Cuingnet, R., Rosso, C., Lehericy, S., Dormont, D., Benali, H., Samson, Y., and Colliot, O. (2010a). Spatially regularized SVM for the detection of brain areas associated with stroke outcome. Med. Image Comput. Comput. Assist. Interv. 13, 316–323.
Cuingnet, R., Benali, H., Chupin, M., and Colliot, O. (2010b). Spatial and anatomical regularization of SVM for brain image analysis. Proceedings of the Neural Information Processing Systems Conference, 2010, 460–468.
Cuingnet, R., Gerardin, E., Tessieras, J., Auzias, G., Lehéricy, S., Habert, M. O., Chupin, M., Benali, H., Colliot, O., and Alzheimer’s Disease Neuroimaging Initiative. (2010c). Automatic classification of patients with Alzheimer’s disease from structural MRI: a comparison of ten methods using the ADNI database. Neuroimage 56, 766–781.
Daubechies, I., Defrise, M., and Mol, D. (2004). An iterative thresholding algorithm for linear inverse problems with sparsity constraint. Commun. Pure Appl. Math. 57, 1413–1457.
Davatzikos, C. (2004). Why voxel-based morphometric analysis should be used with great caution when characterizing group differences. Neuroimage 23, 17–20.
Davatzikos, C., Xu, F., An, Y., Fan, Y., and Resnick, S. M. (2009). Longitudinal progression of Alzheimer’s-like patterns of atrophy in normal older adults: the SPARE-AD index. Brain 132, 2026–2035.
Di Paola, M., Spalletta, G., and Caltagirone, C. (2010). In vivo structural neuroanatomy of corpus callosum in Alzheimer’s disease and mild cognitive impairment using different MRI techniques: a review. J. Alzheimers Dis. 20, 67–95.
Dickerson, B. C., Goncharova, I., Sullivan, M. P., Forchetti, C., Wilson, R. S., Bennett, D. A., Beckett, L. A., and deToledo-Morrell, L. (2001). MRI-derived entorhinal and hippocampal atrophy in incipient and very mild Alzheimer’s disease. Neurobiol. Aging 22, 747–754.
Donoho, D. (2000). High-Dimensional Data Analysis: The Curses and Blessings of Dimensionality. Lecture on August 8, 2000, To the American Mathematical Society Math Challenges of the 21st Century. Los Angeles, CA.
Fan, Y., Shen, D., Gur, R. C., and Gur, R. E. (2007). COMPARE: classification of morphological patterns using adaptive regional elements. IEEE Trans. Med. Imaging 26, 93–105.
Friedman, J., Hastie, T., Hofling, H., and Tibshirani, R. (2007). Pathwise coordinate optimization. Ann. Appl. Stat. 1, 302–332.
Friedman, J., Hastie, T., and Tibshirani, R. (2010). Regularization paths for generalized linear models via coordinate descent. J. Stat. Softw. 33, 1–22.
Frisoni, G. B., Laakso, M. P., Beltramello, A., Geroldi, C., Bianchetti, A., Soininen, H., and Trabucchi, M. (1999). Hippocampal and entorhinal cortex atrophy in frontotemporal dementia and Alzheimer’s disease. Neurology 52, 91–100.
Frisoni, G. B., Pievani, M., Testa, C., Sabattoli, F., Bresciani, L., Bonetti, M., Beltramello, A., Hayashi, K. M., Toga, A. W., and Thompson, P. M. (2007). The topography of grey matter involvement in early and late onset Alzheimer’s disease. Brain 130, 720–730.
Gomez-Isla, T., Price, J. L., McKeel, D. W. Jr., Morris, J. C., Growdon, J. H., and Hyman, B. T. (1996). Profound loss of layer II entorhinal cortex neurons occurs in very mild Alzheimer’s disease. J. Neurosci. 16, 4491–4500.
Guyon, I., and Elisseeff, A. (2003). An introduction to variable and feature selection. J. Mach. Learn. Res. 3, 1157–1182.
Hinrichs, C., Singh, V., Xu, G., and Johnson, S. C. (2011). Predictive markers for AD in a multi-modality framework: an analysis of MCI progression in the ADNI population. Neuroimage 55, 574–589.
Insausti, R., Juottonen, K., Soininen, H., Insausti, A. M., Partanen, K., Vainio, P., Laakso, M. P., and Pitkänen, A. (1998). MR volumetric analysis of the human entorhinal, perirhinal, and temporopolar cortices. AJNR Am. J. Neuroradiol. 19, 659–671.
Jack, C. R. Jr., Bernstein, M. A., Fox, N. C., Thompson, P., Alexander, G., Harvey, D., Borowski, B., Britson, P. J., Whitwell, J. L., Ward, C., Dale, A. M., Felmlee, J. P., Gunter, J. L., Hill, D. L., Killiany, R., Schuff, N., Fox-Bosetti, S., Lin, C., Studholme, C., DeCarli, C. S., Krueger, G., Ward, H. A., Metzger, G. J., Scott, K. T., Mallozzi, R., Blezek, D., Levy, J., Debbins, J. P., Fleisher, A. S., Albert, M., Green, R., Bartzokis, G., Glover, G., Mugler, J., and Weiner, M. W. (2008). The Alzheimer’s disease neuroimaging initiative (ADNI): MRI methods. J. Magn. Reson. Imaging 27, 685–691.
Jovicich, J., Czanner, S., Greve, D., Haley, E., van der Kouwe, A., Gollub, R., Kennedy, D., Schmitt, F., Brown, G., Macfall, J., Fischl, B., and Dale, A. (2006). Reliability in multi-site structural MRI studies: effects of gradient non-linearity correction on phantom and human data. Neuroimage 30, 436–443.
Kimeldorf, G., and Wahba, G. (1971). Some results on Tchebycheffian spline functions. J. Math. Anal. Appl. 33, 82–95.
Klein, A., Andersson, J., Ardekani, B. A., Ashburner, J., Avants, B., Chiang, M. C., Christensen, G. E., Collins, D. L., Gee, J., Hellier, P., Song, J. H., Jenkinson, M., Lepage, C., Rueckert, D., Thompson, P., Vercauteren, T., Woods, R. P., Mann, J. J., and Parsey, R. V. (2009). Evaluation of 14 nonlinear deformation algorithms applied to human brain MRI registration. Neuroimage 46, 786–802.
Kloppel, S., Stonnington, C. M., Chu, C., Draganski, B., Scahill, R. I., Rohrer, J. D., Fox, N. C., Jack, C. R. Jr., Ashburner, J., and Frackowiak, R. S. (2008). Automatic classification of MR scans in Alzheimer’s disease. Brain 131, 681–689.
Kohavi, R. (1995). “A study of cross-validation and bootstrap for accuracy estimation and model selection,” in International Joint Conferences on Artificial Intelligence (Montreal, QC: Morgan Kaufmann), 1137–1143.
Krishnapuram, B., and Hartemink, A. J. (2005). Sparse multinomial logistic regression: fast algorithms and generalization bounds. IEEE Trans. Pattern Anal. Mach. Intell. 27, 957–968.
Laakso, M. P., Partanen, K., Riekkinen, P., Lehtovirta, M., Helkala, E. L., Hallikainen, M., Hanninen, T., Vainio, P., and Soininen, H. (1996). Hippocampal volumes in Alzheimer’s disease, Parkinson’s disease with and without dementia, and in vascular dementia: an MRI study. Neurology 46, 678–681.
Laakso, M. P., Soininen, H., Partanen, K., Lehtovirta, M., Hallikainen, M., Hänninen, T., Helkala, E. L., Vainio, P., and Riekkinen, P. J. (1998). MRI of the hippocampus in Alzheimer’s disease: sensitivity, specificity, and analysis of the incorrectly classified subjects. Neurobiol. Aging 19, 23–31.
Lerch, J. P., Pruessner, J., Zijdenbos, A. P., Collins, D. L., Teipel, S. J., Hampel, H., and Evans, A. C. (2008). Automated cortical thickness measurements from MRI can accurately separate Alzheimer’s patients from normal elderly controls. Neurobiol. Aging 29, 23–30.
Liu, Z., Jiang, F., Tian, G., Wang, S., Sato, F., Meltzer, S. J., and Tan, M. (2007). Sparse logistic regression with Lp penalty for biomarker identification. Stat. Appl. Genet. Mol. Biol. 6, 1–20.
Magnin, B., Mesrob, L., Kinkingnehun, S., Pélégrini-Issac, M., Colliot, O., Sarazin, M., Dubois, B., Lehéricy, S., and Benali, H. (2009). Support vector machine-based classification of Alzheimer’s disease from whole-brain anatomical MRI. Neuroradiology 51, 73–83.
Moon, W. J., Kim, H. J., Roh, H. G., and Han, S. H. (2008). Atrophy measurement of the anterior commissure and substantia innominata with 3T high-resolution MR imaging: does the measurement differ for patients with frontotemporal lobar degeneration and Alzheimer disease and for healthy subjects? AJNR Am. J. Neuroradiol. 29, 1308–1313.
Mueller, S. G., Weiner, M. W., Thal, L. J., Petersen, R. C., Jack, C. R., Jagust, W., Trojanowski, J. Q., Toga, A. W., and Beckett, L. (2005a). Ways toward an early diagnosis in Alzheimer’s disease: the Alzheimer’s disease neuroimaging initiative (ADNI). Alzheimers Dement. 1, 55–66.
Mueller, S. G., Weiner, M. W., Thal, L. J., Petersen, R. C., Jack, C., Jagust, W., Trojanowski, J. Q., Toga, A. W., and Beckett, L. (2005b). The Alzheimer’s disease neuroimaging initiative. Neuroimaging Clin. N. Am. 15, 869–877; xi–xii.
Narayana, P. A., Brey, W. W., Kulkarni, M. V., and Sievenpiper, C. L. (1988). Compensation for surface coil sensitivity variation in magnetic resonance imaging. Magn. Reson. Imaging 6, 271–274.
Park, M. Y., and Hastie, T. (2008). Penalized logistic regression for detecting gene interactions. Biostatistics 9, 30–50.
Pascual-Marqui, R. D., Michel, C. M., and Lehmann, D. (1994). Low resolution electromagnetic tomography: a new method for localizing electrical activity in the brain. Int. J. Psychophysiol. 18, 49–65.
Petersen, R. C., Aisen, P. S., Beckett, L. A., Donohue, M. C., Gamst, A. C., Harvey, D. J., Jack, C. R. Jr., Jagust, W. J., Shaw, L. M., Toga, A. W., Trojanowski, J. Q., and Weiner, M. W. (2009). Alzheimer’s disease neuroimaging initiative (ADNI). Clinical characterization. Neurology 74, 201–209.
Phan, T. G., Chen, J., Donnan, G., Srikanth, V., Wood, A., and Reutens, D. C. (2010). Development of a new tool to correlate stroke outcome with infarct topography: a proof-of-concept study. Neuroimage 49, 127–133.
Ritchie, M. D., White, B. C., Parker, J. S., Hahn, L. W., and Moore, J. H. (2003). Optimization of neural network architecture using genetic programming improves detection and modeling of gene-gene interactions in studies of human diseases. BMC Bioinformatics 4, 28. doi: 10.1186/1471-2105-4-28
Ryali, S., Supekar, K., Abrams, D. A., and Menon, V. (2010). Sparse logistic regression for whole brain classification of fMRI data. Neuroimage 51, 752–764.
Ryali, S., Supekar, K., Abrams, D. A., and Menon, V. (2011). Sparse logistic regression for whole-brain classification of fMRI data. Neuroimage 51, 752–764.
Shen, D., and Davatzikos, C. (2002). HAMMER: hierarchical attribute matching mechanism for elastic registration. IEEE Trans. Med. Imaging 21, 1421–1439.
Shevade, K., and Keerthi, S. (2003). A simple and efficient algorithm for gene selection using sparse logistic regression. Bioinformatics 19, 2246–2253.
Su, E. C., Chiu, H. S., Lo, A., Hwang, J. K., Sung, T. Y., and Hsu, W. L. (2007). Protein subcellular localization prediction based on compartment-specific features and structure conservation. BMC Bioinformatics 8, 330. doi: 10.1186/1471-2105-8-330
Teipel, S. J., Born, C., Ewers, M., Bokde, A. L., Reiser, M. F., Möller, H. J., and Hampel, H. (2007). Multivariate deformation-based analysis of brain atrophy to predict Alzheimer’s disease in mild cognitive impairment. Neuroimage 38, 13–24.
Thompson, P. M., Hayashi, K. M., de Zubicaray, G., Janke, A. L., Rose, S. E., Semple, J., Herman, D., Hong, M. S., Dittmer, S. S., Doddrell, D. M., and Toga, A. W. (2003). Dynamics of gray matter loss in Alzheimer’s disease. J. Neurosci. 23, 994–1005.
Thompson, P. M., Hayashi, K. M., Dutton, R. A., Chiang, M. C., Leow, A. D., Sowell, E. R., De Zubicaray, G., Becker, J. T., Lopez, O. L., Aizenstein, H. J., and Toga, A. W. (2007). Tracking Alzheimer’s disease. Ann. N. Y. Acad. Sci. 1097, 183–214.
Tikhonov, A. N., and Arsenin, V. Y. (1977). Solution of Ill-Posed Problems. Washington, DC: W. H. Winston.
Tseng, P. (1988). Coordinate Ascent for Maximizing Nondifferentiable Concave Functions. Technical Report LIDS–P;1840. MIT, Laboratory for Information and Decision Systems.
Van Hoesen, G. W., Augustinack, J. C., Dierking, J., Redman, S. J., and Thangavel, R. (2000). The parahippocampal gyrus in Alzheimer’s disease. Clinical and preclinical neuroanatomical correlates. Ann. N. Y. Acad. Sci. 911, 254–274.
Vemuri, P., Gunter, J. L., Senjem, M. L., Whitwell, J. L., Kantarci, K., Knopman, D. S., Boeve, B. F., Petersen, R. C., and Jack, C. R. Jr. (2008). Alzheimer’s disease diagnosis in individual subjects using structural MR images: validation studies. Neuroimage 39, 1186–1197.
Xu, Z., Jin, R., Yang, H., King, I., and Lyu, M. R. (2010). “Simple and efficient multiple kernel learning by group lasso,” in 27th International Conference on Machine Learning, Haifa.
Yamashita, O., Sato, M. A., Yoshioka, T., Tong, F., and Kamitani, Y. (2008). Sparse estimation automatically selects voxels relevant for the decoding of fMRI activity patterns. Neuroimage 42, 1414–1429.
Keywords: high dimensional, large scale regularization, logistic regression, GLMNET, ADNI, curse of dimensionality, elastic net
Citation: Casanova R, Whitlow CT, Wagner B, Williamson J, Shumaker SA, Maldjian JA and Espeland MA (2011) High dimensional classification of structural MRI Alzheimer’s disease data based on large scale regularization. Front. Neuroinform. 5:22. doi: 10.3389/fninf.2011.00022
Received: 31 January 2011;
Accepted: 23 September 2011;
Published online: 14 October 2011.
Edited by:
Arthur W. Toga, UCLA School of Medicine, USAReviewed by:
Graham J. Galloway, The University of Queensland, AustraliaWieslaw L. Nowinski, Biomedical Imaging Lab, Singapore
Copyright: © 2011 Casanova, Whitlow, Wagner, Williamson, Shumaker, Maldjian and Espeland. This is an open-access article subject to a non-exclusive license between the authors and Frontiers Media SA, which permits use, distribution and reproduction in other forums, provided the original authors and source are credited and other Frontiers conditions are complied with.
*Correspondence: Ramon Casanova, Department of Biostatistical Sciences, Wake Forest School of Medicine, Medical Center Boulevard, Winston-Salem, NC, 27157, USA. e-mail: casanova@wfubmc.edu