Identifying abnormal connectivity in patients using dynamic causal modeling of fMRI responses
- 1 Wellcome Trust Centre for Neuroimaging, Institute of Neurology, University College London, London, UK
- 2 Institute of Cognitive Neuroscience, Institute of Neurology, University College London, London, UK
Functional imaging studies of brain damaged patients offer a unique opportunity to understand how sensorimotor and cognitive tasks can be carried out when parts of the neural system that support normal performance are no longer available. In addition to knowing which regions a patient activates, we also need to know how these regions interact with one another, and how these inter-regional interactions deviate from normal. Dynamic causal modeling (DCM) offers the opportunity to assess task-dependent interactions within a set of regions. Here we review its use in patients when the question of interest concerns the characterization of abnormal connectivity for a given pathology. We describe the currently available implementations of DCM for fMRI responses, varying from the deterministic bilinear models with one-state equation to the stochastic non-linear models with two-state equations. We also highlight the importance of the new Bayesian model selection and averaging tools that allow different plausible models to be compared at the single subject and group level. These procedures allow inferences to be made at different levels of model selection, from features (model families) to connectivity parameters. Following a critical review of previous DCM studies that investigated abnormal connectivity we propose a systematic procedure that will ensure more flexibility and efficiency when using DCM in patients. Finally, some practical and methodological issues crucial for interpreting or generalizing DCM findings in patients are discussed.
Introduction
Accurate characterization of abnormalities in neural processing is important for understanding pathological conditions and recovery mechanisms. It may also contribute to the tailoring of efficient therapy and intervention procedures. A large fMRI literature has already investigated how pathological conditions change neural processing, usually in terms of activity or signal changes in a set of spatially segregated regions. However, several studies have shown that characterizing such abnormal processes in terms of activation differences in a set of distinct (isolated) brain regions is not enough to provide a comprehensive picture of the abnormal brain (Meyer-Lindenberg et al., 2001; Ween, 2008). This is due to the fact that the function of any brain region cannot be understood in isolation but only in conjunction with the regions it interacts with during active behavior (e.g., McIntosh, 2000; He et al., 2007; Bassett and Bullmore, 2009; Bressler and Menon, 2010; Guye et al., 2010), a principle known as functional integration (Friston, 1994, 2002b, 2007).
Functional integration refers to task-dependent processing that emerges from changes in interactions among brain regions. In this context, deficits in functional integration or connectivity are implied when the influence of one brain region on another is stronger or weaker in patients relative to control subjects (Price et al., 2006; Ween, 2008). There are several approaches that have been proposed to assess functional integration or connectivity (for a review see Ramnani et al., 2004; Harrison et al., 2007; Rogers et al., 2007; Li et al., 2009; Bressler and Menon, 2010), including structural equation modeling (McIntosh and Gonzalez-Lima, 1994), dynamic causal modeling (DCM) (Friston et al., 2003), Granger causality (Roebroeck et al., 2005), psycho-physiological interactions (Friston et al., 1997), dynamic Bayesian networks (Rajapakse and Zhou, 2007), multivariate autoregressive modeling (Harrison et al., 2003), partial correlation analysis (Marrelec et al., 2009), non-linear system identification (Li et al., 2010b), and switching linear dynamic systems (Smith et al., 2010). Each method has its advantages and weaknesses (e.g., see Penny et al., 2004; Ramnani et al., 2004; Witt and Meyerand, 2009) and its use should be motivated by the question of interest, level of inference, paradigm design, data acquisition and analysis.
Here, we consider the use of DCM as a flexible and robust tool for assessing effective connectivity (Friston et al., 2003). In contrast to functional connectivity, effective connectivity provides a mechanistic account of the cause of the inter-regional interactions that would explain the emergence of a particular functional pattern (see for more details Friston, 1994, 2002b, 2009b). DCM has been widely used across different imaging modalities, populations and tasks (for a review see Stephan et al., 2007, 2010; Friston, 2009a). For instance, many studies have used DCM of fMRI data to explore inter-regional interactions during different cognitive tasks in normal healthy subjects. This literature has provided interesting insights about how brain regions talk to each other in healthy populations during cognitive and motor processing (Grol et al., 2007; Kasess et al., 2008), face processing (Fairhall and Ishai, 2007; Li et al., 2010a), word reading (Chow et al., 2008; Carreiras et al., 2009; Seghier and Price, 2010), speech perception (Leff et al., 2008; Eickhoff et al., 2009), semantic access (Heim et al., 2009; Fan et al., 2010; Seghier et al., submitted), spatial memory (Doeller et al., 2008), emotional processing (Ethofer et al., 2006; Smith et al., 2006), attentional control (Acs and Greenlee, 2008; Plailly et al., 2008; Wang et al., 2010), conflict monitoring (Fan et al., 2008), and decision making (Alexander and Brown, 2010; den Ouden et al., 2010).
In this review we highlight some of the issues that need to be considered when effective connectivity is assessed with DCM of patient data. The paper is divided into five sections. The first section provides some useful definitions that are important for interpreting abnormal functional integration in patients. The second succinctly presents the theoretical foundations of DCM including the effective connectivity parameters, the available frameworks, and the multiple levels of inference that DCM can provide. The third section reviews previous studies that used DCM of data from patients with focal or non-focal damage to characterize abnormal connectivity. The fourth section aims to describe some practical guidelines that we believe would improve the use of DCM of patient data. In this context, we provide a systematic and unbiased approach to reveal abnormal connectivity in patients. The fifth section is concerned with some critical methodological issues that need to be taken into account when interpreting DCM findings in patients.
Definitions and Principles
We need first to define some concepts used throughout this review. Our review of previous work indicates that different terms have been used across studies to refer to the same concept. First, the term “network” has been used to refer to a set of temporally and spatially segregated regions that interact and engage in multiple complex behaviors. A network is by definition dynamic, where nodes and interactions between these nodes change continuously in time and space across different cognitive processes. A network can also be referred to as a “system” or “circuit.” A part of a network can be referred to as a “sub-network” or “subsystem.” Second, the complex dynamics within the network have been described with different terms, including: inter-regional interactions, connectivity, coupling, interactivity, interdependency, and co-operative action. Here we refer to these complex dynamics as “inter-regional interactions.” Third, when characterizing how inter-regional interactions differ in patients and controls, previous studies used the terms: altered, abnormal, disturbed, atypical, impaired, or dysfunctional. Throughout the review we will use the term of “abnormal” when referring to inter-regional interactions in patients that are outside the range of those observed in healthy controls.
Using these definitions, we tentatively summarize some of the implicit assumptions that motivate studies of functional integration in patients:
(i) local damage to a part of a network can propagate throughout the whole network (e.g., Alstott et al., 2009; Kim and Horwitz, 2009);
(ii) an abnormal network can be viewed as a “new” network and not simply the normal network minus the damaged parts (e.g., He et al., 2007);
(iii) an abnormal network can comprise sub-networks that correspond to those seen in healthy subjects and novel sub-networks that are not typically seen in healthy subjects;
(iv) abnormal behavior can be an indicator of abnormal inter-regional interactions, however an abnormal network may not necessarily produce abnormal behavior;
(v) an abnormal network is not fixed; it can evolve and change during the course of therapy and recovery; and
(vi) for a given pathology, an abnormal network can vary from patient to patient even within a relatively homogenous population.
What is DCM?
Dynamic causal modeling aims to explain, quantitatively and mechanistically, how observed fMRI responses are generated (Friston et al., 2003). The key features that make DCM the method of choice for estimating effective connectivity can be summarized as follows (see detailed description in page 3100 of Stephan et al., 2010): (i) DCM is dynamic, in the sense that it uses differential equations to model inter-regional interactions, (ii) DCM is causal as it aims to infer the directionality of the inter-regional interactions and their context-dependent modulations, (iii) DCM is a hypothesis-driven approach that can incorporate any known effect (e.g., stimuli and tasks) to test specific hypotheses that motivated the experimental design, (iv) DCM is Bayesian in all its aspects and uses a generative model to constrain effects by prior knowledge, (v) DCM explicitly uses an empirical forward model that links observed hemodynamic responses to the (hidden) neuronal dynamics, allowing inferences to be made at the neuronal level, (vi) DCM estimates a range of connectivity parameters that present parallels with neuro-physiological models, including psycho-physiological or physio-physiological interactions, (vii) the use of DCM with Bayesian model selection (BMS) and averaging tools enables inferences at different levels, from a set of plausible models (a family of models) to a specific connectivity parameter, and (viii) DCM inferences can be made both at the single subject and group level.
Fundamentally, DCM is only appropriate for describing responses (fMRI, MEG, ERP) that result from controlled external stimuli (Friston, 2009a; Stephan et al., 2010). This requires datasets that also include periods when external stimuli are both present and absent. DCM is therefore not currently suitable for uncontrolled continuous “natural” stimulations such as resting-states. It treats the human brain as a dynamic system that is subject to multiple inputs and produces multiple outputs. Thus, DCM characterizes task-dependent inter-regional interactions.
The starting point for DCM is the selection of a fixed set of regions and their possible connections. Each combination of experimentally modulated connections corresponds to a model, which can then be compared to other alternative models in order to identify which model(s) best predict(s) the data (see illustration in Figure 1 for details of the practical steps). For a given model, DCM estimates three different sets of parameters: (i) input or extrinsic parameters that quantify how brain regions respond to external stimuli (i.e., the external inputs that perturb the model), (ii) endogenous or latent parameters that characterize context-independent (or average) inter-regional interactions, and (iii) modulatory parameters that measure changes in effective connectivity induced by the experimental conditions. These connectivity parameters are each expressed in Hz within the DCM framework. They are not necessarily constrained by mono-synaptic (i.e., direct) anatomical connections and can be either positive or negative. A positive parameter means that an increase in activity in one region results in increased rate of change in the activity of another region. Conversely, a negative parameter means that an increase in activity in one region results in a decreased rate of change in the activity of another region. Note that, due to the limited temporal resolution in fMRI, conduction delays in inputs and inter-regional interactions are ignored in DCM of fMRI responses, but not in DCM for EEG or MEG data (Friston et al., 2003). All DCM parameters and their posterior probabilities are assessed with Bayesian inversion by means of the expectation-maximization algorithm (Dempster et al., 1977; Friston, 2002a).
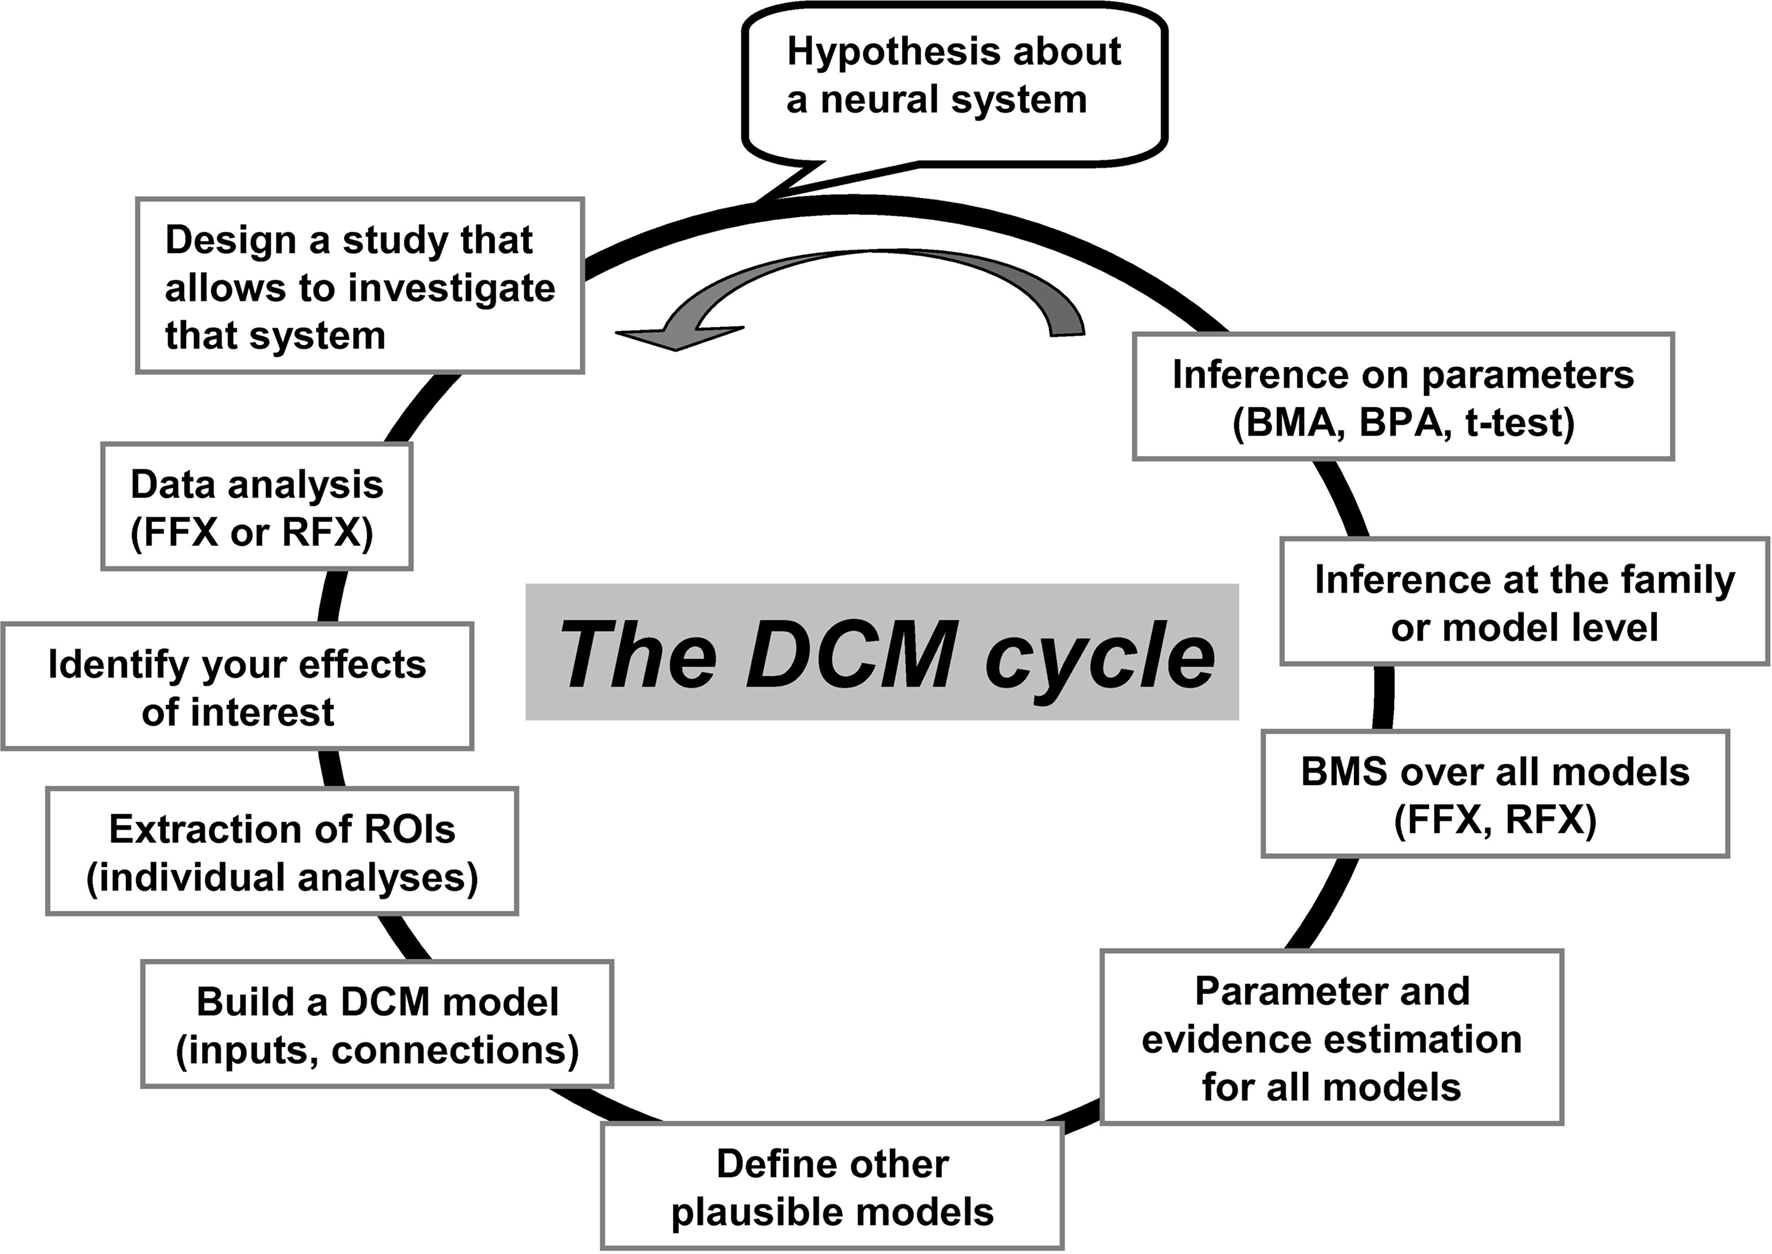
Figure 1. An illustration of the “cycle” of practical steps in a typical DCM analysis. These steps have been made easy and flexible within the SPM software package. It starts with the selection of effects of interest (activated patterns) and the time-series extraction of the appropriate regions. Then, a predefined structure of the model is specified, including the driving inputs and where they enter the system, how the regions inter-connect, and where modulatory effects are specified. Additional alternative models can be specified and then all models can be compared. ROIs, regions of interest; FFX, fixed-effect analysis; RFX, random-effect analysis; BMS, Bayesian model selection; BMA, Bayesian model averaging; BPA, Bayesian parameter averaging. This figure has been adapted from a previous talk given by KE Stephan and L Harrison (during the ICN-SPM course in May 2005).
Below, we succinctly present the available implementations of DCM, how to compare alternative models, and the different levels of inference that can be made with DCM.
Multiple Implementations
Since the seminal paper reported by Friston et al. (2003), there have been several extensions of the DCM algorithm to increase its flexibility. It is therefore necessary to consider which algorithms are most suitable for the question of interest. This section presents the extensions implemented for DCM of fMRI responses. By default, the most widely used DCM version corresponds to the bilinear and deterministic implementation with one-state equation per region (see below).
Bilinear vs. non-linear
The default implementation in DCM codes the rate change in neuronal activity according to the following bilinear evolution or state equation (Friston et al., 2003):
where z is the activity of the neuronal population, A is the first-order (endogenous, latent, or average) inter-regional interactions in the absence of inputs, B is the second-order interaction between activity and input (the modulatory effect), and C is the extrinsic effects of inputs “u” on activity. The bilinear term B is equivalent to the psycho-physiological interactions in the network that reflects how the inter-regional interactions are modulated by a given input/context. This fundamental equation in DCM has been extended for the assessment of physio-physiological interactions in a given network. The extension, known as non-linear DCM (Stephan et al., 2008), is suitable for explicitly testing whether the activity in a given region gates or enables interactions between other regions. The state equation in non-linear DCM is given by:
where the new term “D” is a quadratic quantity that represents the physio-physiological interactions in the model or the strength of the activity-dependent gating of connections.
This non-linear DCM equation can be helpful when modeling “neural gain control” mechanisms in short-term synaptic plasticity (Stephan et al., 2008) which are likely to be relevant for characterizing a given pathology. Such mechanisms are critical for various cognitive processes, including top-down modulation of attention and learning (see example in den Ouden et al., 2010).
One-state vs. two-state neuronal equations
Because each region is modeled by one neuronal state equation only (Eq. 1), it is not possible to assess selective changes in excitatory (e.g., glutamatergic) and inhibitory (e.g., GABAergic) subpopulations in each region of the DCM model. This is a very important issue that needs to be taken into account when, for instance, making inferences about potential inhibitory or excitatory mechanisms in DCM. To address this, an extended version of DCM exists that uses two-state neuronal equations (Marreiros et al., 2008) to model excitatory and inhibitory subpopulations in each region. This allows for an explicit description of intrinsic (between subpopulations) connectivity within a region. In other words, each region is modeled by two neuronal subpopulations and DCM can thus estimate the interactions between these two subpopulations. Interestingly, this parameterization confers dynamical stability on the system, enforces positivity constraints on the extrinsic connections, and enables context-dependent changes in the interactions to be modeled as a proportional increase or decrease in connection strength (Marreiros et al., 2008). The two-state DCM can be used, for instance, to specifically test whether patients and controls differ in the interactions between excitatory and inhibitory subpopulations.
Anatomical-based priors vs. default shrinkage priors
Different priors are embodied within the Bayesian framework of DCM. These include priors on the connectivity parameters (see for more details Friston et al., 2003) that are referred to as “shrinkage” priors because they tend to “shrink” posterior means to their prior expectation of zero, particularly when the data are noisy. These shrinkage priors make the detection of significant inter-regional interactions somewhat conservative. Thus only effects that have a significant likelihood with high precision are allowed to deviate from zero (i.e., when new data strongly support an existing effect). However, it has been shown that such priors can be modified (relaxed) to take into account an a priori knowledge about anatomical connectivity (Stephan et al., 2009b). The idea is to assign a stronger belief (i.e., by relaxing the shrinkage priors) to a particular interaction between two regions if one has strong evidence for an existing anatomical connection between the regions. These anatomically-based priors have been shown to provide stronger evidence for anatomically motivated models (Stephan et al., 2009b) and are particularly useful if tractography data (DTI) are available. They can also take advantage of the white matter tracts that are specified in recent atlases (e.g., Mori et al., 2005, 2008; Catani and Thiebaut de Schotten, 2008) and incorporate this information into the DCM when defining the appropriate model structure. In the context of the current paper, it is interesting to note that information about damaged tracts in a group of patients can be explicitly modeled. However, because of the deterministic nature of the current DCM implementation (see below), indirect influences on regions cannot be ruled out even if direct white matter tracts are missing.
Deterministic vs. stochastic
The default implementation of DCM in SPM is deterministic as only the explicitly modeled effects are allowed to influence the inter-regional interactions. Thus, DCM estimates the interactions between the spatially segregated regions that are temporally perturbed by the external inputs included in the model. However, it is obvious that this framework cannot rule out the influence of indirect effects, including interactions with regions not included in the DCM or temporal innovations not modeled in the inputs (see discussion in Smith et al., 2010). For instance, a connection can excite a group of neurons that inhibit another region thereby resulting in an overall effect of inhibition. An extended version, known as stochastic DCM (Daunizeau et al., 2009), allows such subtle indirect effects to be expressed. It extends the previous state equation to:
where η is the state noise that models stochastic innovations in the system. The new term η is defined by Gaussian variables with a mean of zero and a covariance structure that can express any form of innovations. In other words, in this framework, all indirect effects are modeled as stochastic phenomena, thereby allowing the hidden-states causing the data and any non-controlled exogenous inputs to the system to be inferred (Daunizeau et al., 2009). This framework can be very useful because it provides more flexibility in modeling unknown or indirect pathologic effects in patients.
Levels of Inference with Bayesian Model Selection
One exciting tool in DCM is its BMS procedure. This procedure compares the evidence for different competing hypotheses. Because the exact mechanisms behind any fMRI responses are unknown, it might not be possible to have an a priori prediction about the “exact” model. Therefore, it is important to specify a range of alternative models and search for the best (most useful) model in the model space, e.g., Leff et al. (2008), Seghier and Price (2010), and Seghier et al. (submitted). This procedure increases the certainty of the best model by testing many other potential explanations of the data.
During the Bayesian inversion of the model, the probability of the data given the model, known as the model evidence, is approximated by the negative variational Free-energy (Friston et al., 2007; Stephan et al., 2009a). This approximation, as a lower bound on the model evidence, points to the optimal compromise between the accuracy and complexity of a given model. It provides a better estimation for the complexity term, by taking into account the interdependency between the estimated parameters. Thus, model evidence is not an “absolute” measure of how good a model is; instead it is used in BMS to compare between alternative models. Moreover, by using the negative variational Free-energy as the optimal compromise between accuracy and complexity, the current implementation of DCM ensures that (i) model complexity will not increase if additional parameters are “redundant” to existing parameters and (ii) the parameter estimates of a good model are as precise and uncorrelated as possible. In short, BMS estimates the likelihood that a given model has generated the observed data.
Sampling the model space
The most critical step when using the BMS tool is the definition of the DCM model space (i.e., the set of specified models) because any inference at the model level depends on the way the model space has been defined (sampled). There are three principles that need to be considered: compatibility, size, and plausibility. First, compatibility between models is attained by ensuring that all models of a given subject have the same regions, that is, the models all contain the same data. Specifically, BMS cannot be applied to models that are fitted to different fMRI data. For group studies, a good practice is to ensure consistent regions between subjects since group BMS implicitly assumes functional compatibility of the modeled effects across subjects. Second, there are an infinite number of possibilities that can explain the data; it is impossible to sample all these possibilities and thus a practical limitation on the number of models (i.e., the size of the model space) is necessary. Third, plausibility reflects a systematic way of defining realistic and interpretable models according to a priori knowledge or some predefined criteria. This will automatically limit the size of the model space and crucially avoid including bad or unrealistic models.
Random-effects vs. fixed-effects
Once the model space has been defined and estimated in all subjects, BMS can be used to identify the best (most useful) models at the group level. There are two classic ways of achieving group BMS analyses: fixed-effects and random-effects (see Figure 1 in Stephan et al., 2010). The former assumes that the best models are comparable across subjects because subjects would reasonably perform the task in a similar way (e.g., identical cognitive strategies). The latter may be preferable when studying heterogeneous populations or using complex cognitive tasks where optimal models are likely to vary across subjects. Random-effects BMS is also preferable when outlier effects are suspected because the current implementation (in SPM8) of random-effects BMS uses a robust hierarchical Bayesian approach. It quantifies the likelihood that a specific model generated the data of a subject chosen at random, measured via two quantities: (i) the Dirichlet parameter estimates (alpha) represents a measure of the effective number of subjects in which a given model generated the observed data, and (ii) the “exceedance” probability (xp) describes the belief that a particular model is more likely than any other model given the group data (Stephan et al., 2009a). The exceedance probability “xp” is particularly intuitive as all exceedance probabilities sum to one over all tested models. Note also that there are two sampling schemes in random-effects BMS, the first uses a Variational Bayes method that is optimal and fast when the number of tested models is smaller than the number of subjects (Stephan et al., 2009a), and the second uses a Gibbs sampling method that is optimal and accurate when the number of models is larger than the number of subjects (Penny et al., 2010).
Inference at the family and the model level
When comparing models with BMS, the best model would be the winning model that has the most evidence (e.g., significant exceedance probability) compared to other models. However, it is commonly found that one single model does not dominate all other models, particularly when the number of models is very large with many connections shared between models. In this situation, one can look for any similarity in model structures that can better explain the data. To do this, a recent extension of BMS has introduced the ability to make inferences on a “family” of models (Penny et al., 2010). A family is a subset of models that share similar characteristics such as the same driving region or the same modulated connections (see Penny et al., 2010; Seghier and Price, 2010; Seghier et al., submitted). The formation of families should be motivated by the question of interest to ensure all models in the model space are partitioned into different families with no overlap. It is permissible to have different numbers of models in each family. BMS can then be used to compare these competing families and inferences can be made at the family level.
Inference at the connection level
The last level of inference assesses the significance of a particular connectivity parameter. Analysis of the connectivity parameters is conducted after comparing models or families because the posterior densities of such parameters are conditional on the particular model or family selected (Stephan et al., 2010). If a winning model has been identified, one can look at the consistency of effects across subjects using random-effects analysis (e.g., t-tests). Alternatively, fixed-effect approaches can be applied using Bayesian parameter averaging where the connectivity parameters are weighted by their precision during the computation of the mean across subjects or sessions. Significant effects at the group level are commonly reported at a corrected p-value (e.g., using a Bonferroni correction based on the number of tested connections, Sonty et al., 2007; Leff et al., 2008; Seghier and Price, 2010). If the inference has been made at the family level, it is possible to use the new Bayesian model averaging (BMA) method where the contribution of each model to the mean effect is weighted by its evidence (Penny et al., 2010).
Previous DCM Studies of Patients
In this section we review previous DCM studies of patients. We are particularly interested in the way DCM has been carried out in patients and how the differences between controls and patients have been statistically characterized both at the model and connection level. A PUBMED search was conducted with the following inclusion criteria: (i) fMRI studies, (ii) published in English that (ii) used DCM in (iv) patients with any disorder. A total of 28 studies were identified and are listed in Tables 1 and 2 (Bird et al., 2006; Mechelli et al., 2007; Rocca et al., 2007a,b; Sonty et al., 2007; Cao et al., 2008; Eickhoff et al., 2008; Grefkes et al., 2008, 2010; Hamandi et al., 2008; Schlosser et al., 2008, 2010; Abutalebi et al., 2009; Almeida et al., 2009a,b; Benetti et al., 2009; Crossley et al., 2009; Dima et al., 2009; Fujii et al., 2009; Grezes et al., 2009; Mintzopoulos et al., 2009; Shannon et al., 2009; Vaudano et al., 2009; Agosta et al., 2010; Allen et al., 2010; Goulden et al., 2010; Miyake et al., 2010; Rowe et al., 2010). These studies have provided valuable insights into the abnormal connectivity in patients with a range of pathologies. However, the aim of our review is not to discuss the relevance of their findings. This would necessitate a separate review that considered the models tested, tasks and stimuli used, region selection, driving and modulatory inputs, and the relevance of the findings in light of previous neuropsychological and computational models. Instead, the current review considers the methodological approaches that have been used (see Tables 1 and 2) and we refer to these studies for illustrations of the methods.
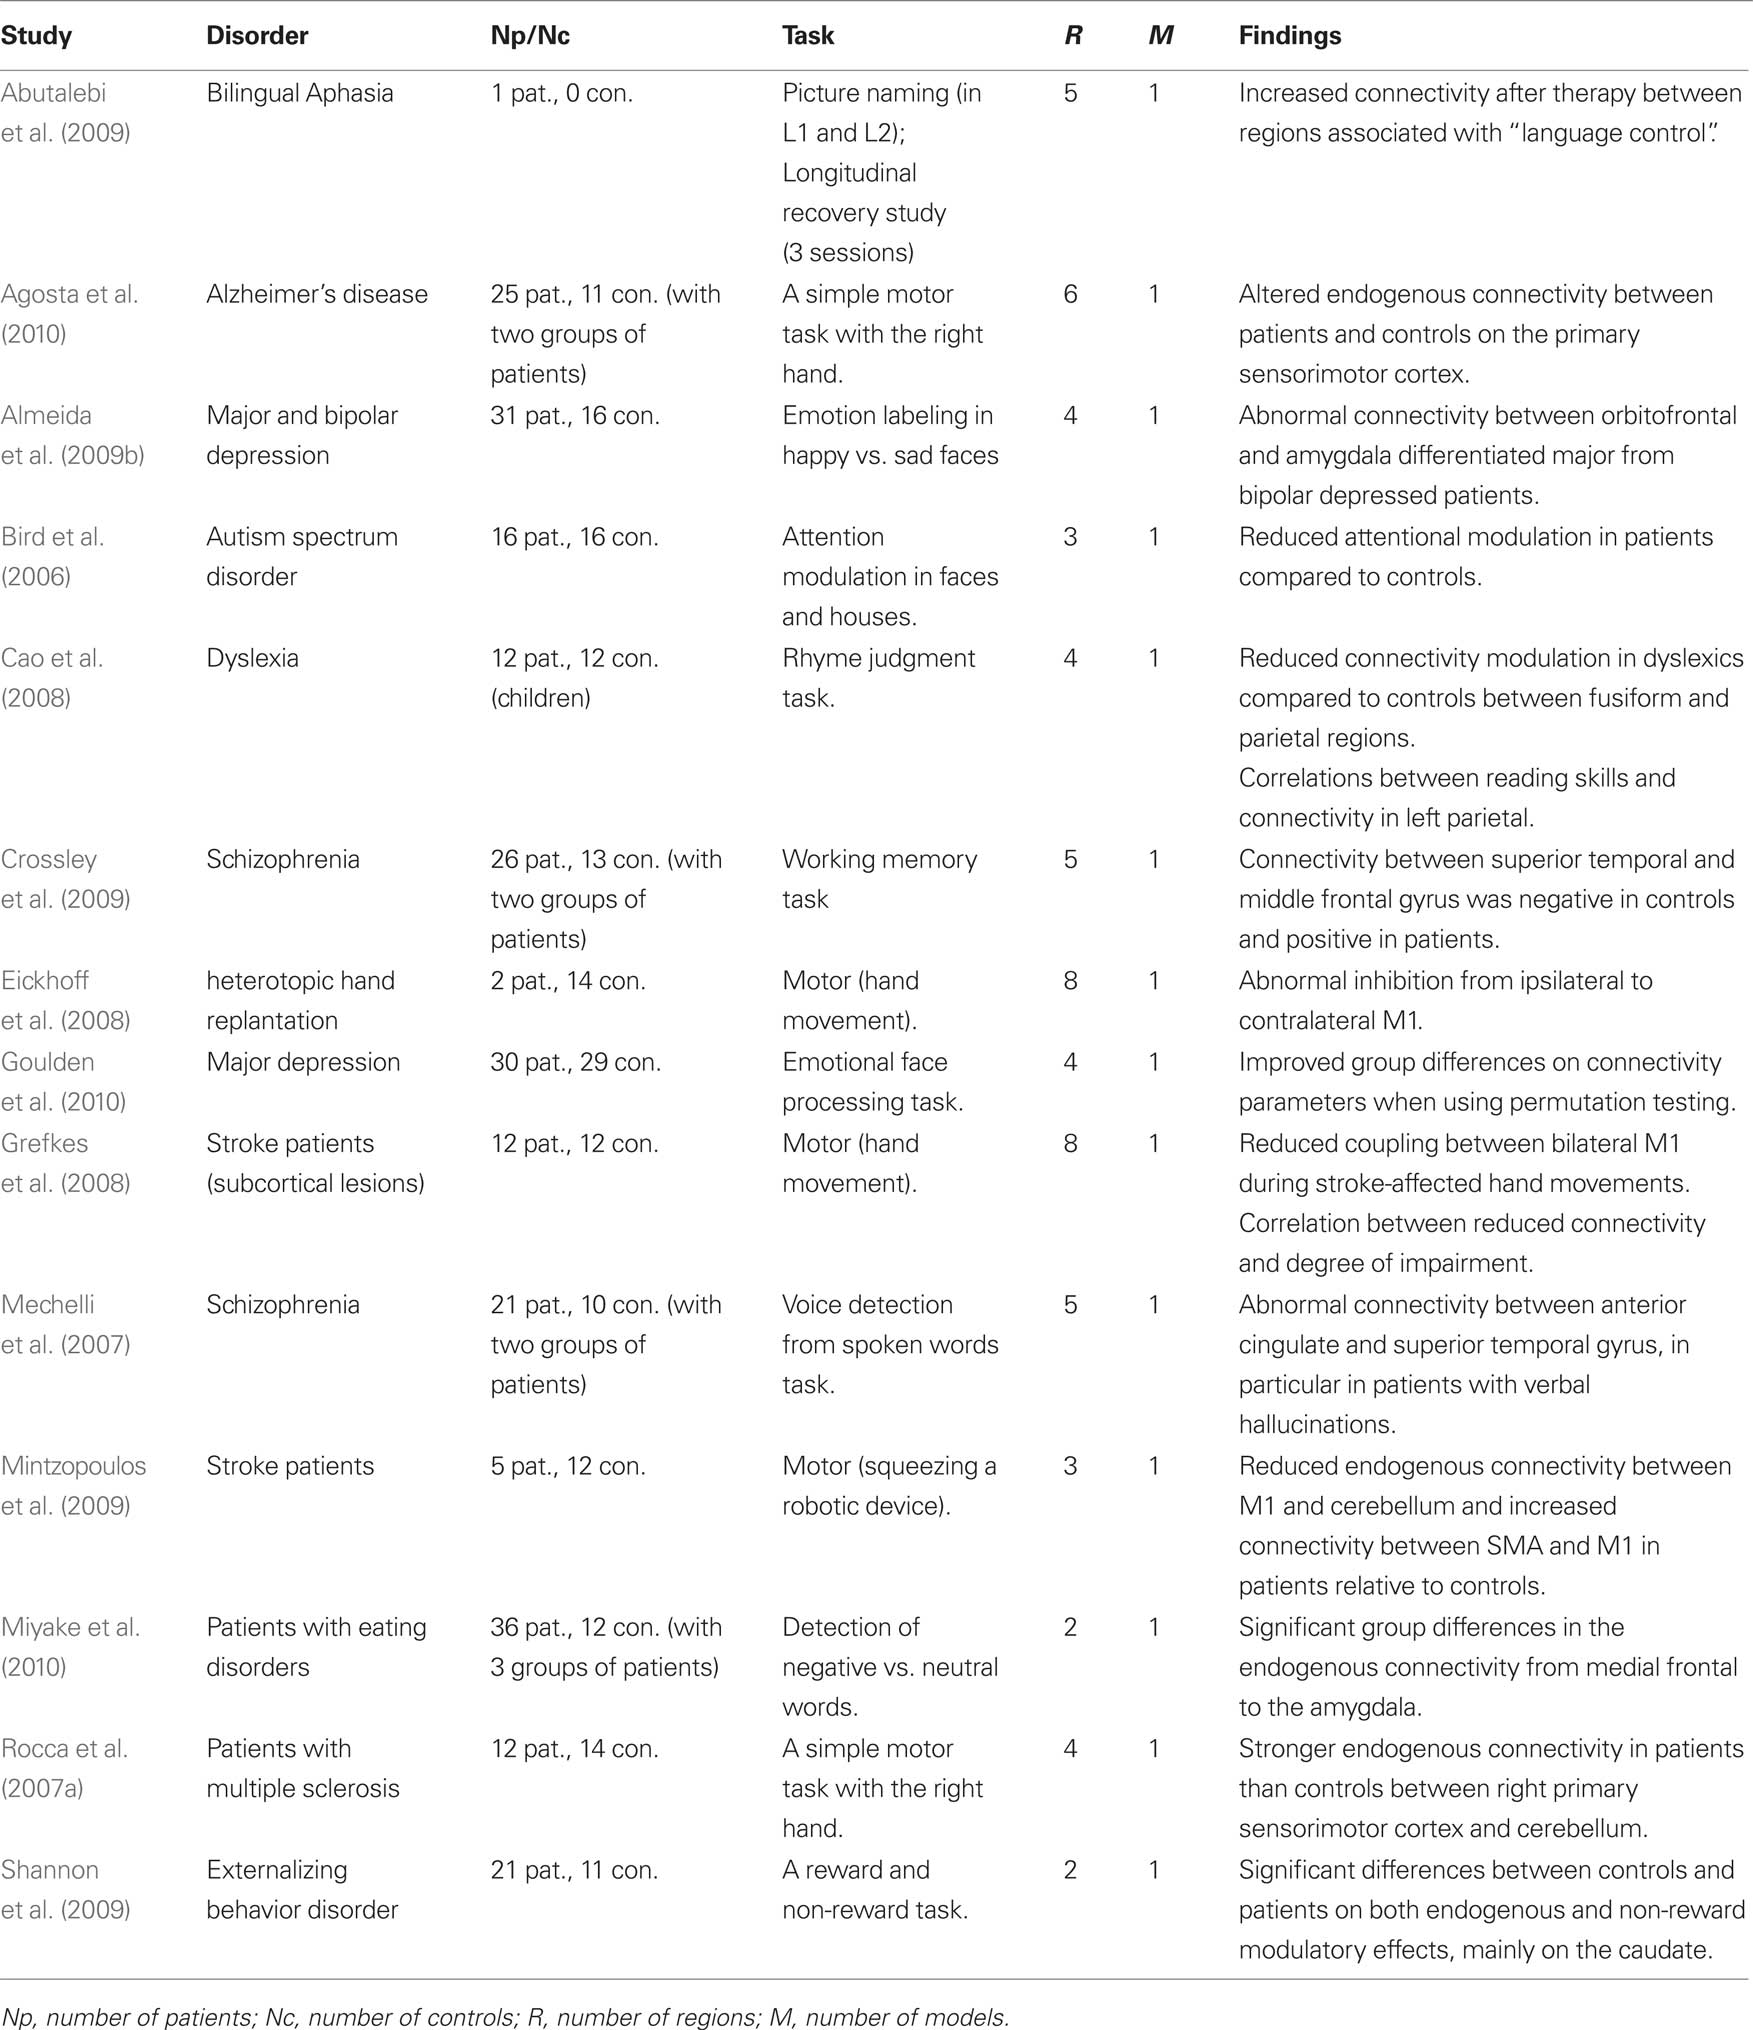
Table 1. List of previous DCM studies of patients that used one single model (i.e., DCM model space = 1 model). Studies are listed in alphabetical order.
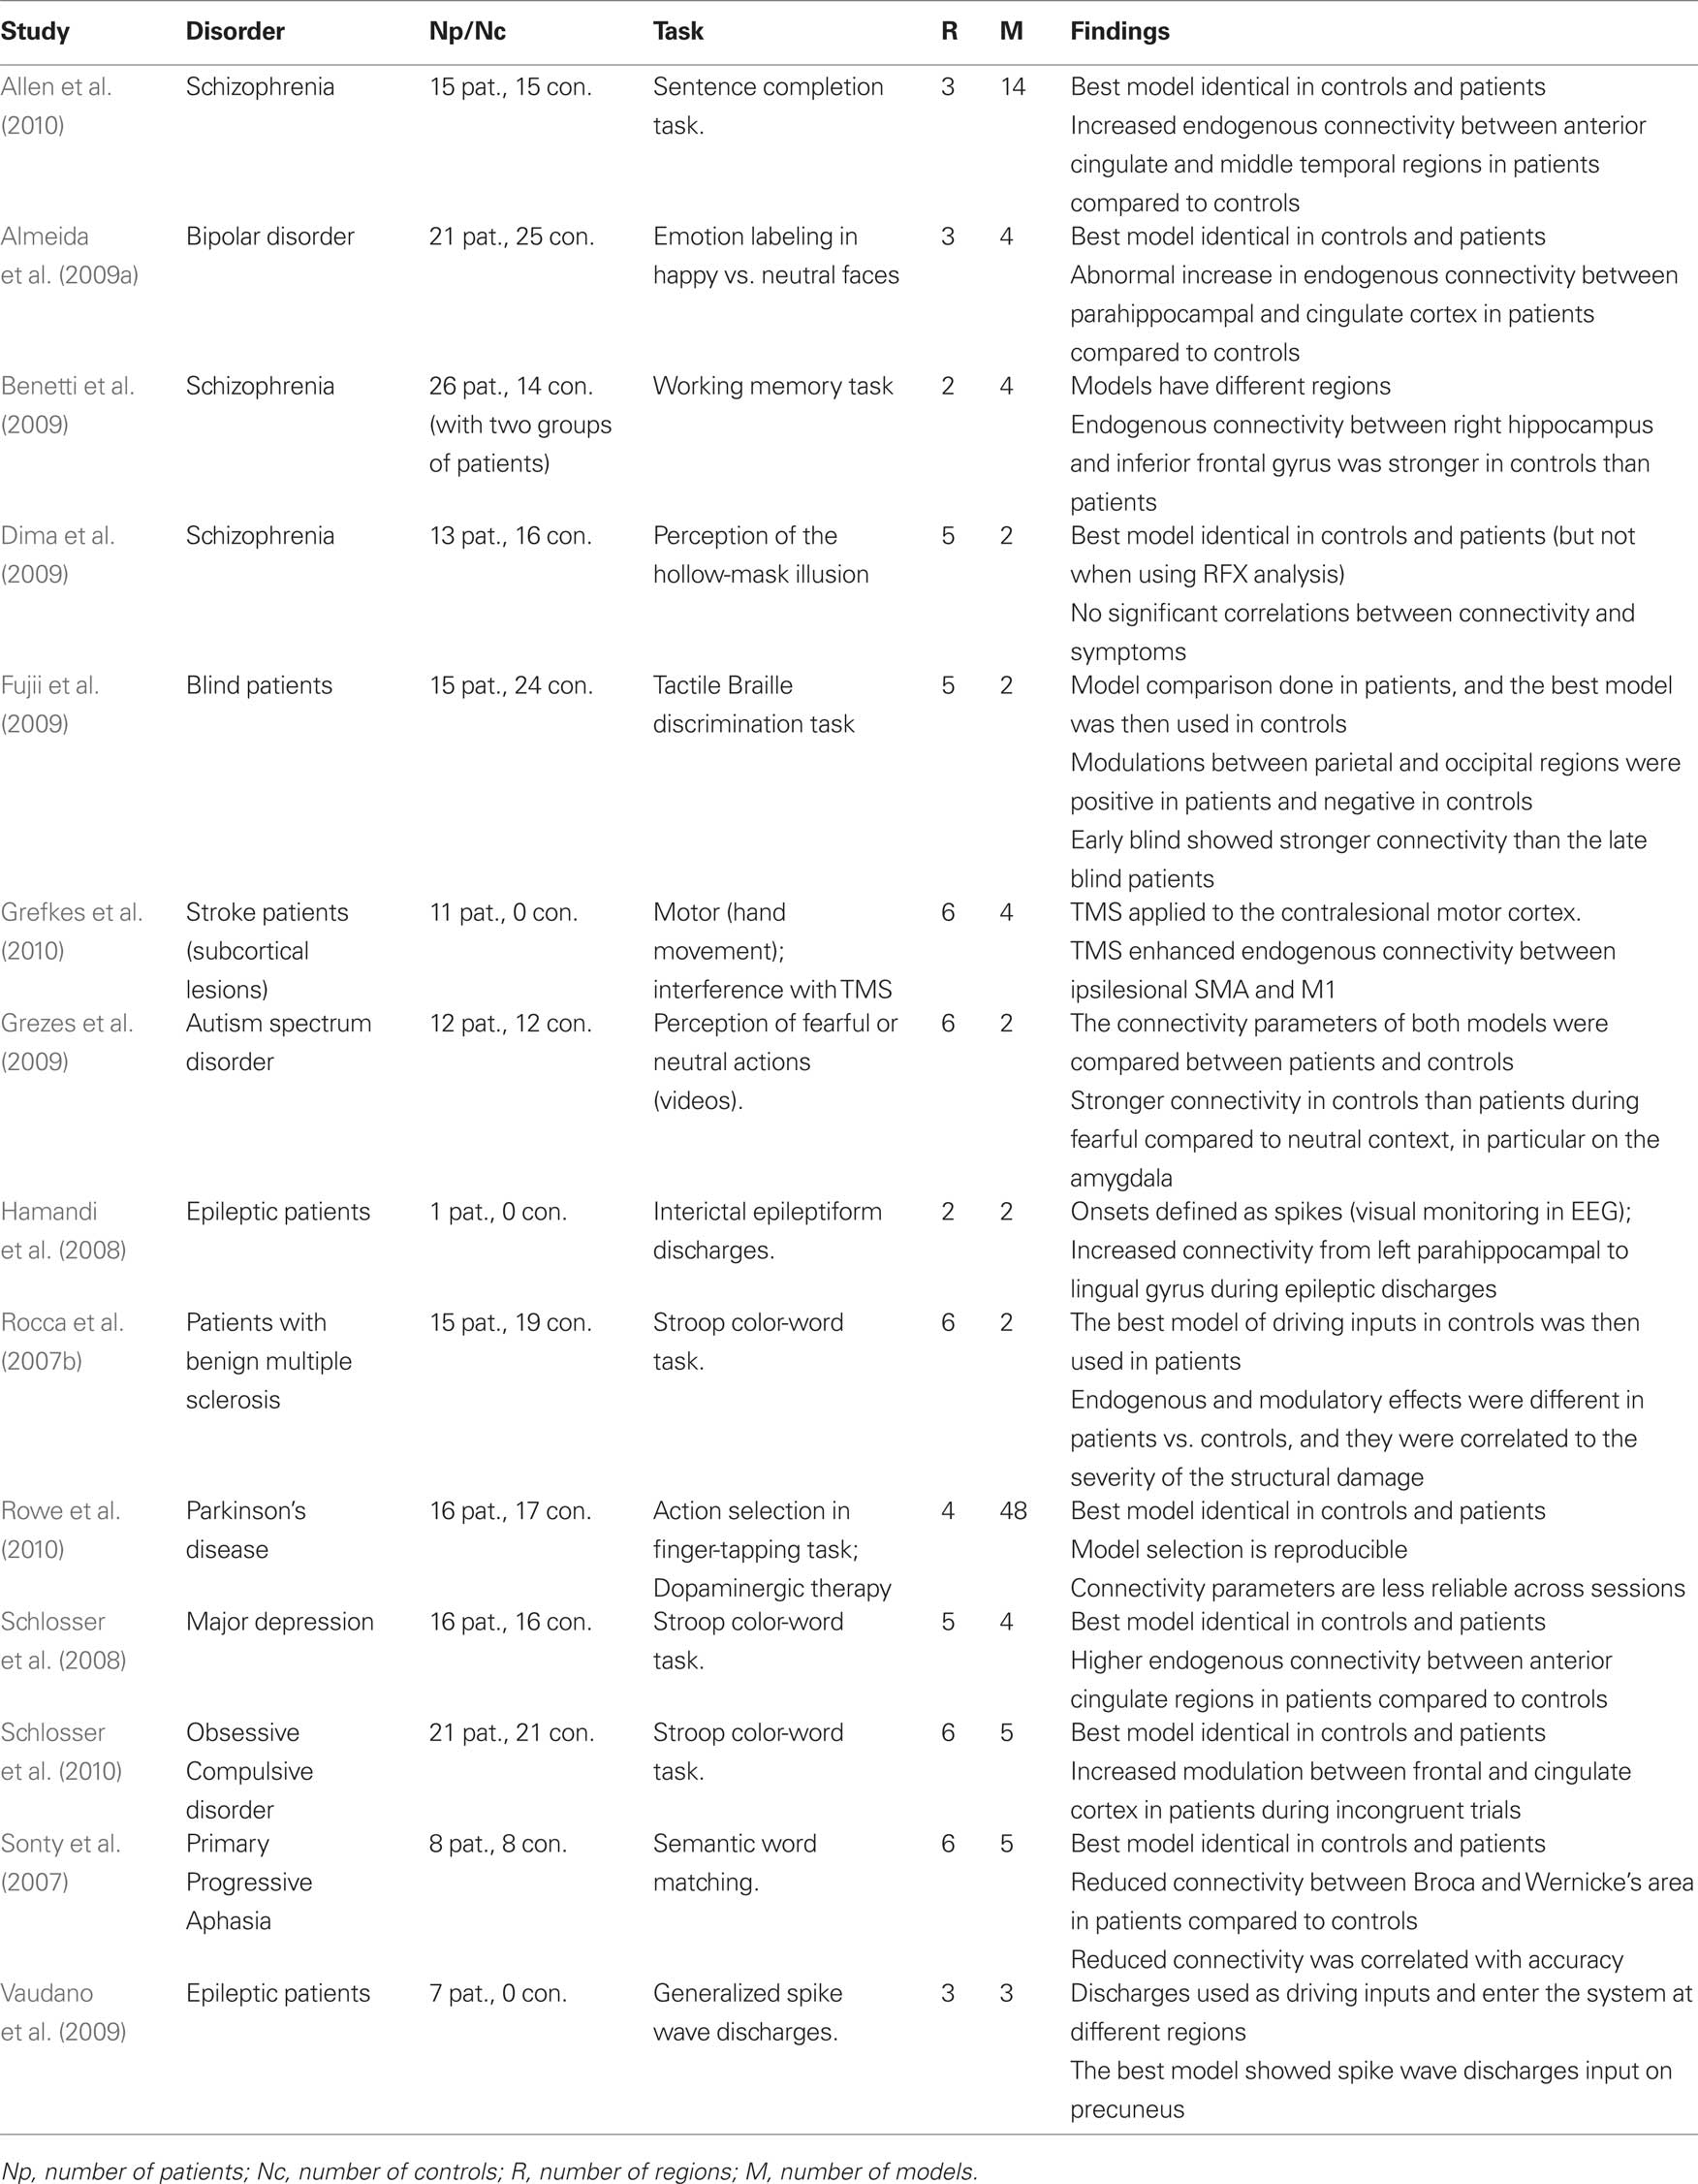
Table 2. List of previous DCM studies of patients that used and compared more than one model (DCM model space ≥ 2 models).
Consistent with the most widely used implementation of DCM, all 28 studies were deterministic and used the bilinear one-state neuronal equation without anatomical-based priors. Matched groups of controls were included in all but four studies (Hamandi et al., 2008; Abutalebi et al., 2009; Vaudano et al., 2009; Grefkes et al., 2010). The driving inputs were specified in standard block or event-related designs in all but two studies (Hamandi et al., 2008; Vaudano et al., 2009) where internally generated epileptogenic wave discharges from the epileptic patients being studied were used as the driving inputs.
The models used varied in their complexity, from simple models with two regions (e.g., Benetti et al., 2009) to complex models with eight regions (e.g., Grefkes et al., 2008). All studies involved adult subjects except one study of dyslexic children (Cao et al., 2008). The tasks and stimuli varied extensively between the studies because they were purposely designed to maximize differences between patients and controls. For instance, working memory tasks were used in patients with schizophrenia (Benetti et al., 2009; Crossley et al., 2009), Stroop word-color tasks were used in patients with depression (Schlosser et al., 2008), and semantic tasks were used in aphasic patients (Sonty et al., 2007; Abutalebi et al., 2009). One critical difference between these studies concerns the level of inference made in both patients and controls. We thus divided the 28 studies into two sets: a set of 14 studies that tested one model only (Table 1) and therefore did not require the BMS procedure and a second set of 14 studies that used BMS to compare at least 2 models in patients and controls (Table 2).
Studies with One Fixed DCM Model
The 14 studies with only one DCM model in both patients and controls were exclusively interested in how connectivity parameters differed between groups. The same model (i.e., same regions, driving inputs, and modulatory inputs) was defined in patients and controls and the connectivity parameters of that model were compared between patients and controls on a connection by connection basis. The main motivation of such strong reliance on a single model is to ensure the same model is tested on both populations so that connectivity parameters can be compared. This avoids the case when the winning model is not the same in patients and controls. Because the parameters are conditional on the selected model the definition of one unique model can be problematic. Some studies have used a fully connected model because it allows all possible combinations of inter-regional connections to be estimated and tested (e.g., Bird et al., 2006; Mechelli et al., 2007; Rocca et al., 2007b; Cao et al., 2008; Agosta et al., 2010; Miyake et al., 2010). However, we argue that a fully connected model is by definition the most complex and may lead to over-fitting of the data. Moreover, it cannot guarantee that connectivity parameters are estimated within the best model structure given the data. Other studies have used a model that is less complex than the fully connected version when a priori hypotheses concerning the architecture of the optimal model are possible on the basis of previous structural and functional connectivity findings (e.g., Grefkes et al., 2008; Abutalebi et al., 2009; Crossley et al., 2009; Goulden et al., 2010). Irrespective of which model is selected, single model studies were more concerned about the differences in connectivity parameters and thus their findings do not address differences between patients and controls at the network level.
Studies with Multiple Competing DCM Models
To avoid heavy reliance on a predefined model other studies have used BMS to identify the best model from competing alternatives (varying from 2 to 48 models, see Table 2). The comparison between connectivity parameters is then performed on the parameters of the best model. This procedure has the advantage of providing the opportunity to make inferences both at the model/system level and the parameter/connection level within the optimal structure. It is perfectly valid (and sufficient) to limit the inference to the system level, for instance by showing whether or not patients are using the same network as the controls (e.g., is the winning model identical in patients and controls?). That said, all previous studies were mainly interested in inferences at the connection level and the BMS was usually presented as an intermediate analysis step. To ensure the possibility of such inference, these studies used different methods to guarantee that the final selected model is the same between controls and patients. This conceptual limitation will be unnecessary when the new BMA tool for making comparisons across multiple models or families is implemented in SPM (see Penny et al., 2010).
Practically, three methodologies have been used to compare the best model in patients and controls. First, the majority of studies used BMS on the same set of alternative models and implemented this independently in patients and controls (e.g., Sonty et al., 2007; Schlosser et al., 2008, 2010; Almeida et al., 2009a; Allen et al., 2010; Rowe et al., 2010). All these studies showed the winning model to be identical in patients and controls. Note however that this similarity may depend on whether RFX or FFX methods are used; for instance, patient and control models were found to be identical with FFX analysis but different with RFX analysis (Dima et al., 2009). Second, an alternative approach used by Rocca et al. (2007b) in a study of patients with multiple sclerosis performing a Stroop task involved the use of BMS within controls only to find the best model in controls, followed by a comparison of the parameters of that model in patients and controls (Rocca et al., 2007b). For instance, when faced with the choice of where inputs enter the system, Rocca and colleagues defined two alternative models with two different driving regions. They then identified the best model and used the driving region of the winning model as a driving region for patients as well (Rocca et al., 2007b). The third procedure was used by Fujii et al. (2009) to study blind patients during tactile Braille discrimination tasks. It involved identification of the best model in patients and then used this model in comparison to controls (Fujii et al., 2009). Note that the last two procedures rely on the hypothesis that the best model of one group is identical to the best model in the second group.
Differences in Connectivity Parameters
After defining the best model in both patients and controls, previous studies have tested whether the parameters of that model differ between the two groups. Some studies have limited this comparison to the endogenous connectivity (e.g., Rocca et al., 2007a; Benetti et al., 2009; Miyake et al., 2010), whereas other studies have looked at how patient connectivity differed in the context of stimulus or task changes (e.g., Bird et al., 2006). Abnormal connectivity in patients has been found to correspond to either a change in the strength of connectivity (stronger or weaker parameters than controls) or a change in polarity (positive vs. negative). For instance, Schlosser et al. (2008) found patients with major depression have stronger connectivity between anterior cingulate regions when compared to controls during a Stroop color-word task (Schlosser et al., 2008). Conversely, Sonty et al. (2007) illustrated reduced connectivity by showing that, relative to controls, patients with primary progressive aphasia have weaker connectivity between Broca and Wernicke’s areas during semantic word matching tasks. An example of reversed polarity has also been shown with negative modulatory effects between parietal and occipital regions in controls compared to positive modulations in blind patients (Fujii et al., 2009).
Interestingly, a few studies have also investigated the correlations between abnormal connectivity and other behavioral or diagnostic measures in patients. For instance, Rocca et al. (2007b) showed a significant correlation between abnormal connectivity and the severity of structural damage in patients with multiple sclerosis. Cao et al. (2008) found that reduced modulations between the fusiform and parietal regions correlated with reading skills in dyslexic children (Cao et al., 2008). Another example is provided by Grefkes et al. (2008) who found a significant correlation between reduced connectivity in primary motor regions and the degree of motor impairment in stroke patients with subcortical lesions (Grefkes et al., 2008). Moreover, other studies have used connectivity parameters to distinguish between different pathological groups. For instance, Almeida et al. (2009b) found that the abnormal connectivity between the orbitofrontal cortex and the amygdala differentiated patients with major depression from patients with bipolar depression during a task of emotional labeling of happy vs. sad faces (Almeida et al., 2009b). Miyake et al. (2010) found that endogenous connectivity between the medial frontal gyrus and the amygdala during the detection of negative vs. neutral words showed variable patterns between three subgroups with different types of eating disorders (Miyake et al., 2010). Furthermore, two other studies illustrated how external interventions can be monitored with DCM in diseased populations. The first was a longitudinal study of a bilingual aphasic patient by Abutalebi et al. (2009) and assessed connectivity between five regions of interest during a picture naming task in two languages. Increased connectivity was found after therapy in regions associated with “language control,” consistent with the patients’ behavioral recovery (Abutalebi et al., 2009). The second study combined DCM and transcranial magnetic stimulation (TMS) (Grefkes et al., 2010) and focused on stroke patients with subcortical lesions during hand movement tasks. In their study, Grefkes et al. (2010) found that applying TMS to the contralesional motor cortex increased connectivity between ipsilesional motor regions (Grefkes et al., 2010).
A Systematic Procedure for DCM in Patients
The studies reviewed above have used a variety of procedures to assess effective connectivity in patients. This makes any meaningful comparison between their findings difficult. This diversity also illustrates the different procedures that have been used to address the methodological challenges that arise when DCM is used with patient data. In this section, we propose a practical procedure that can be used to compare effective connectivity in patients and controls. This involves the standard DCM procedures (see Definitions and Principles above) but with some specific modifications that are particularly relevant for patient studies. They relate to region selection, the definition of the driving regions, the definition of plausible models, identifying the best model or family of models, and the comparison of connectivity parameters in patients and controls. Note however we are not claiming this approach is the only correct way of using DCM in patients; the optimal approach should always be tailored to the specific questions, the selected effects of interest, and the definition of the model space.
Region Selection
Models should, by definition, be comparable between patients and controls. This means models must have identical nodes. Accordingly, only commonly activated regions in patients and controls can be included in DCM. Thus, DCM in patients focuses on the characterization of abnormal connectivity in a common network of regions (see schematic illustration in Figure 2). A fuller characterization of patient data would therefore benefit from a report of abnormalities at the level of regions (areas that are more or less activated in patients than controls) in addition to a report of abnormal connectivity within the set of areas commonly activated in patients and controls. Second, there should be minimal inter-subject variability in the anatomical location of a given region. This is because large variability in region locations may result in the comparison of functionally different regions across patients and controls (for a similar rationale, see Seghier and Price, 2010; Seghier et al., submitted).This is particularly critical in regions where functional specialization may vary at a high spatial scale. As a general rule, the distance between corresponding regions in different individuals should correspond to the size of the spatial smoothing kernel. Third, the distance between different regions in the same individual needs to ensure that the data included in one region is not also entered into another region. Fourth, we also advocate the definition of proper F-contrasts of interest that can be used to adjust the extracted time-series and thus minimize the contribution of other confounds (e.g., session effect, head motion, incorrect trials).
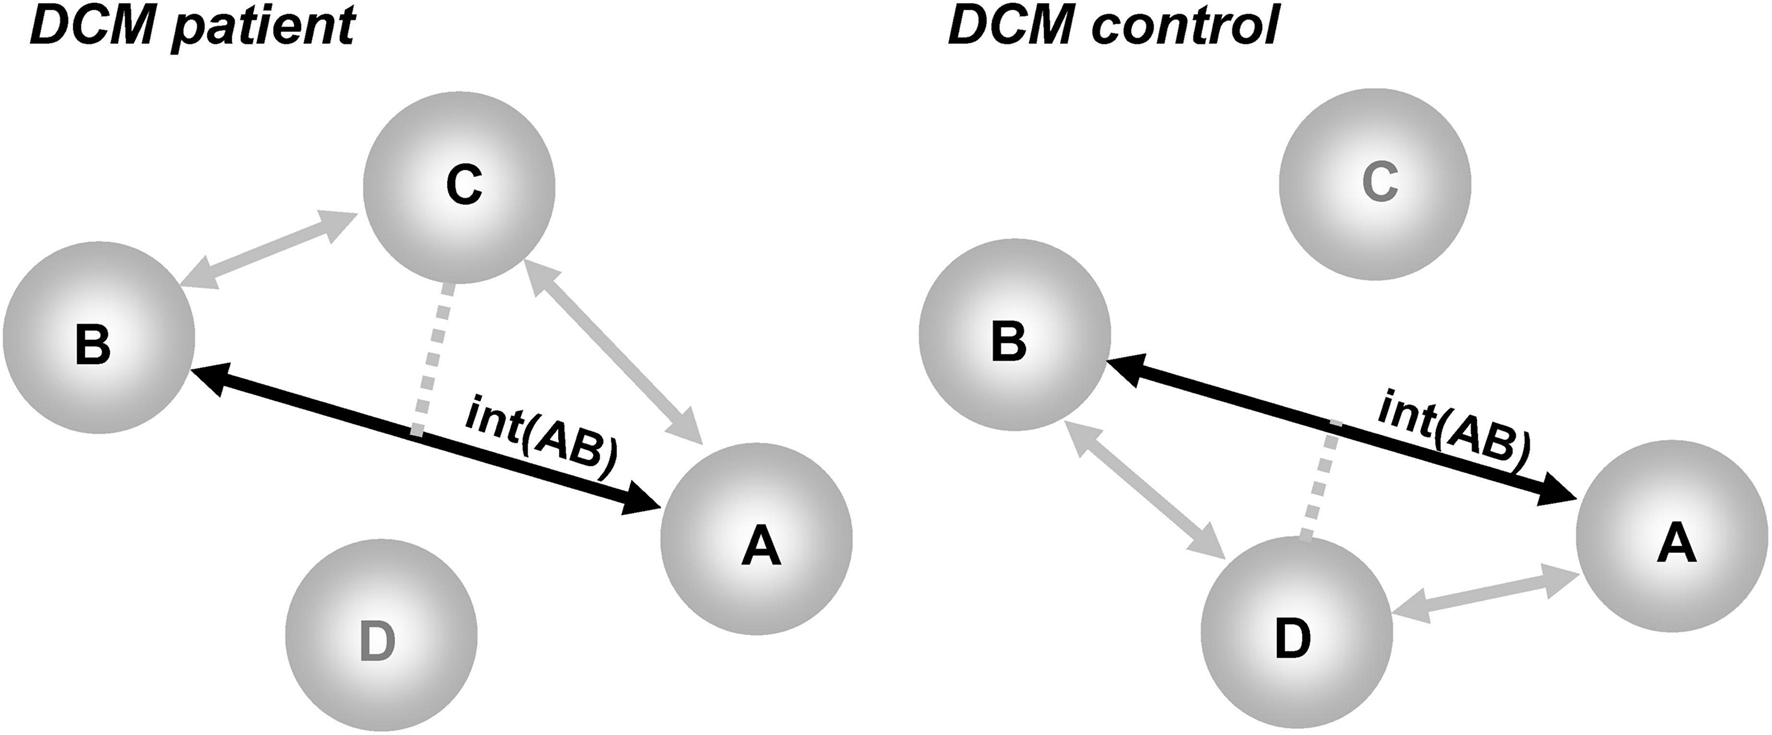
Figure 2. Illustration of the problem of the “missing nodes” in DCM when comparing patients to controls. Regions A and B are activated in both groups, region D is damaged in patients but present in controls, and region C is a compensatory region that is only activated in patients. The deterministic DCM can assess the interactions between A and B [noted int(AB) on a solid black line], but would ignore the indirect effects of regions D and C (shown with gray lines). The interactions between A and B are thus a complex mixture of these effects [e.g., in patients = int(AB) in the context of C without D; in controls = int(AB) in the context of D without C].
Driving Regions
After extracting the ROIs, an important step in the construction of plausible models is the choice of driving regions (i.e., where the inputs enter the system). It is wise to specify primary sensory regions as driving regions if they are included in a model. However, for other regions, the motivation for selecting driving regions should be carefully based on prior anatomical or functional knowledge as all connectivity parameters depend on how the information flow is assumed to propagate from driving regions. In the absence of a priori knowledge, it is useful to perform a preliminary BMS procedure that systemically varies the site of driving regions across a set of candidate regions. This can be done by specifying all plausible models (in terms of endogenous and modulatory effects) and repeating them with each combination of driving regions (for a similar procedure, see Leff et al., 2008; Penny et al., 2010; Seghier et al., submitted). Then, by using a RFX BMS across patients and controls, the winning family represent the best driving regions.
Plausible Models
This step should be systematic in the sense that it needs to explore a set of alternative plausible models for a given set of regions, particularly when prior knowledge of a network is uncertain. Even if the inference of interest is at the connection level, it is difficult to interpret and generalize differences in connectivity parameters in patients that have only been compared to controls in the context of one fixed model. Our concern is based on the fact that the connectivity parameters are conditional on the predefined model. Thus, evidence is stronger when it is known to be based on several competing models. It is also helpful (if possible) to classify models in a set of meaningful families that can then be compared with BMS. For instance, family categorization could be based on the existence of a commonality at the level of an endogenous connection, modulated connection, or driving input. Additional constraints help to limit the size of the DCM model space. This is necessary, since, for example, there are over one billion possible models in the model space of a fully connected DCM with six regions if it is searched in an unconstrained manner for the best modulated connections. Limiting the model space to the most plausible models limits the possibility of diluting evidence with the inclusion of bad or implausible models. It would also be helpful if authors detailed how they constrained the model space as this may aid in the design of future studies.
BMS for the Best Model or Family of Models
First, it should be stressed that it is better to use the most recently available negative variational Free-energy model evidence measure instead of the suboptimal AIC or BIC measures (for more details see Stephan et al., 2009a). The problem with AIC and BIC (still used in some recent work) is that they may bias model selection toward more simplistic models and do not take into account the interdependency between connectivity parameters. Using the negative variational Free-energy measures, BMS can be run separately on patients and controls to identify the best family of models in patients and controls (assuming the same model space is defined in both groups). Family inference enables the investigator to test and report the evidence for an optimal class of models in patients or controls. If patients and controls show a different winning family or model then this is an interesting result to report, particularly in the context of a commonly activated set of regions (see previous section). This would mean that data from patients and controls cannot be adequately and sufficiently fitted by the same model structure (e.g., Horwitz et al., 1995), suggesting that the patterns of fMRI activation observed in patients have emerged from other alternative models that can be tested and identified with the BMS. Moreover, differences can be investigated at the level of inter-subject variability within and between patients and controls. For example, some patients may have similar winning models to controls and other patients may have different winning models. Inter-subject variability within groups can then be related to behavioral measures acquired in or out of the scanner. This is particularly interesting when the aim of the study is to predict performance at the individual subject level.
Differences at the Connection Level
If inference is sought at the connection level it is important to only compare models that are tested within the same model space in both groups, including the same winning model or family of models. For the same winning model, two sample t-tests or ANOVAs can be used to compare connectivity parameters between patients and controls. Alternative permutation testing (Goulden et al., 2010) can be used in studies with small samples. For the same family of models, the latest BMA procedure is more suitable (see illustration in Penny et al., 2010; Seghier et al., submitted) when the two groups differ in the distribution of model evidence across the model space (e.g., the posterior probabilities of plausible models are different in the two groups). Moreover, it is sometimes interesting to look for correlations between connectivity parameters in patients and their phenotype or genotype. This helps to interpret differences between patients and controls and to determine whether any connectivity pattern can serve as a biomarker for a particular deficit or signature of a particular reorganization mechanism.
Conceptual and Methodlogical Issues
Other conceptual and methodological issues should be acknowledged when using DCM in patients (see for instance Daunizeau et al., 2010). We focus here on five issues that we believe are crucial for interpreting or generalizing DCM findings. All five warrant further systematic investigations, on both simulated and real data, in order to characterize their influences.
(1) Effective connectivity, like functional responses, varies across subjects. Although group effects are easy to report and important in showing the most consistent effects in a given population, variable connectivity patterns across patients can indicate different ways a given deficit can be expressed and the strategies that patients may be using to compensate for those deficits. It is also possible that variability may change with the level of inference, as shown recently in a group of patients with Parkinson’s disease where inferences at the model level were more reliable and reproducible than inferences at the connection level (e.g., Rowe et al., 2010).
(2) The network of areas included in a DCM are typically only part of the complete and complex neural system that supports the task. Therefore, the inter-regional interactions within the selected sub-network are only a parsimonious model of the “true” system.
(3) The problem of missing nodes is crucial for DCM (see Smith et al., 2010). As highlighted above, the deterministic DCM will only test the differences in connectivity within the commonly activated network, ignoring the regional effects that are absent or novel in patients compared to controls. For this reason we have suggested that the abnormalities should be reported at the level of regions in addition to the level of connectivity.
(4) The remote effect of abnormal connectivity in another network. This problem concerns the influence of abnormal parts in a subsystem that may propagate to other networks causing “indirect” abnormal connectivity in the subsystem of interest. For instance, it is possible that damaged parts within one functional system manifest as abnormal connectivity that is not necessarily related to the main task/process of interest. This effect is linked to the more global problem of the missing nodes that can sometimes be sufficiently strong to invalidate DCM results of a given subsystem (see discussion in Daunizeau et al., 2010).
(5) How generalizable are conclusions concerning abnormal connectivity? This issue is particularly critical for studies that aim to define a biomarker for a given pathology. First, the results identified in a particular group of subjects can only be translated to other subjects that show significant effects in all the regions of interest. What then happens when patients have one or two missing nodes? Second, generalizability also depends on abnormalities that manifest outside the network of interest, because the effects could have indirect influences on the sub-network of interest. This problem concerns all levels of inference in the implementation of deterministic DCM and should be carefully considered when generalizations are made about abnormal connectivity. It is even more critical if one is interested in making inferences at the individual level (e.g., if abnormal connectivity is being used as a biomarker for distinguishing between patients and controls or for classifying new patients). Nevertheless, it should be noted that patient and control connectivity parameters represent the same thing and are directly comparable when the analysis of patient and control data is based on the identical model space with identical priors for the model parameters (including those for the forward hemodynamic model and those for neuronal coupling).
Future Developments
In addition to the methodological issues highlighted above that warrant further investigations, other developments can potentially add more flexibility to the use of DCM in patient studies. We focus here on four future developments: (1) quantify the vulnerability of a given network after damage, (2) sample the model space in an unconstrained manner, (3) include new computational models in DCM, and (4) combine DCM with other approaches.
(1) Quantifying the vulnerability of the network to damage. Parallels can be made with the increased interest in graph theory for complex brain network analysis (for review see Bassett and Bullmore, 2009; Bullmore and Sporns, 2009; Bressler and Menon, 2010; Guye et al., 2010). Using graph theory, previous studies have investigated connectivity changes that result from an insult to a given part of the network (e.g., Kaiser et al., 2007; Honey and Sporns, 2008; Alstott et al., 2009), for instance by using structural network properties of the lesion site to predict the functional (i.e., dynamic) consequences of the focal damage. This literature has yielded the development of different measures to quantify the “resilience” or the “vulnerability” of a given network after insult (see different coefficients in Rubinov and Sporns, 2010) and also proposed new statistical approaches for identifying differences in networks between patients and controls (see Zalesky et al., 2010). The translation of these sorts of measures to the DCM framework would be a valuable contribution for future studies of patients.
(2) Sampling model space in an unconstrained manner. Defining the model space in a comprehensive way is a challenging step (e.g., see critique in Tauchmanova and Hromcik, 2008), in particular when the number of nodes or inputs is relatively high. One exciting possibility is the ability to sparsely sample the model space in order to produce an approximation of the best model structure. For instance, using Gaussian Processes, it has been shown that it is possible to identify the optimal model structure based on the selected subsample of models (for more details see Anderson and Lane, 2009). We believe this kind of future development will increase the robustness of DCM when exploring large model spaces and will allow the structure of complex models to be identified.
(3) Including new computational models. There is also an exciting opportunity to combine previous computational models with DCM (for detailed discussion see Friston and Dolan, 2010). For instance, previous models from computational neuroscience and theoretical neurobiology can be linked to a particular behavior or pathology (e.g., in patients with schizophrenia, Friston, 1996, or Alzheimer’s disease, Hasselmo, 1997) that can then be tested with DCM. Previous theoretical models constitute an interesting source of hypotheses that can inform the formation of the model space in DCM.
(4) Combining DCM with other approaches. One crucial step in DCM is the identification of a subset of regions of interest that is usually based on an a priori knowledge. This hypothesis-driven step may leave several other activated regions unexplored. In this context, data-driven approaches can be used to explore the whole pattern and reduce it to a set of representative nodes that can then be incorporated into DCM (see de Marco et al., 2009). For instance, during a go/no-go task, a previous study has used independent component analysis to identify three response inhibition components and then DCM was used to assess the interactions between these components (Stevens et al., 2007). Recently, a new method called the switching linear dynamic systems was developed to identify important regions that might be left out during the specification of models (Smith et al., 2010). This method explicitly models the task factor as a Markov random variable and it aims to objectively measure the overall quality and sufficiency of an identified model (see illustration with a motor task in Smith et al., 2010).
Conclusion
We have succinctly reviewed the available DCM frameworks for fMRI responses that can be applied to characterize brain disorders at the level of networks and their dynamics. The previous literature has demonstrated the feasibility of DCM in diverse populations of patients and has provided valuable insights that characterize the dynamic signatures of focal and non-focal pathologies. We believe the growing use of DCM will shape the field of brain network dynamics and will have an important impact on the future development of theoretical neurobiology and clinical biomarkers.
Conflict of Interest Statement
The authors declare that the research was conducted in the absence of any commercial or financial relationships that could be construed as a potential conflict of interest.
Acknowledgments
This work was funded by the Wellcome Trust and the James S. MacDonnell Foundation (conducted as part of the Brain Network Recovery Group initiative).
References
Abutalebi, J., Rosa, P. A., Tettamanti, M., Green, D. W., and Cappa, S. F. (2009). Bilingual aphasia and language control: a follow-up fMRI and intrinsic connectivity study. Brain Lang. 109, 141–156.
Acs, F., and Greenlee, M. W. (2008). Connectivity modulation of early visual processing areas during covert and overt tracking tasks. Neuroimage 41, 380–388.
Agosta, F., Rocca, M. A., Pagani, E., Absinta, M., Magnani, G., Marcone, A., Falautano, M., Comi, G., Gorno-Tempini, M. L., and Filippi, M. (2010). Sensorimotor network rewiring in mild cognitive impairment and Alzheimer’s disease. Hum. Brain Mapp. 31, 515–525.
Alexander, W. H., and Brown, J. W. (2010). Competition between learned reward and error outcome predictions in anterior cingulate cortex. Neuroimage 49, 3210–3218.
Allen, P., Stephan, K. E., Mechelli, A., Day, F., Ward, N., Dalton, J., Williams, S. C., and McGuire, P. (2010). Cingulate activity and fronto-temporal connectivity in people with prodromal signs of psychosis. Neuroimage 49, 947–955.
Almeida, J. R., Mechelli, A., Hassel, S., Versace, A., Kupfer, D. J., and Phillips, M. L. (2009a). Abnormally increased effective connectivity between parahippocampal gyrus and ventromedial prefrontal regions during emotion labeling in bipolar disorder. Psychiatry Res 174, 195–201.
Almeida, J. R., Versace, A., Mechelli, A., Hassel, S., Quevedo, K., Kupfer, D. J., and Phillips, M. L. (2009b). Abnormal amygdala-prefrontal effective connectivity to happy faces differentiates bipolar from major depression. Biol. Psychiatry 66, 451–459.
Alstott, J., Breakspear, M., Hagmann, P., Cammoun, L., and Sporns, O. (2009). Modeling the impact of lesions in the human brain. PLoS Comput. Biol. 5, e1000408. doi: 10.1371/journal.pcbi.1000408.
Anderson, B., and Lane, T., (2009). Fast Bayesian network structure search using Gaussian processes. Available at http://www.cs.unm.edu/~treport/tr/09-06/paper.pdf, 1–15.
Bassett, D. S., and Bullmore, E. T. (2009). Human brain networks in health and disease. Curr. Opin. Neurol. 22, 340–347.
Benetti, S., Mechelli, A., Picchioni, M., Broome, M., Williams, S., and McGuire, P. (2009). Functional integration between the posterior hippocampus and prefrontal cortex is impaired in both first episode schizophrenia and the at risk mental state. Brain 132, 2426–2436.
Bird, G., Catmur, C., Silani, G., Frith, C., and Frith, U. (2006). Attention does not modulate neural responses to social stimuli in autism spectrum disorders. Neuroimage 31, 1614–1624.
Bressler, S. L., and Menon, V. (2010). Large-scale brain networks in cognition: emerging methods and principles. Trends Cogn. Sci. (Regul. Ed.) 14, 277–290.
Bullmore, E., and Sporns, O. (2009). Complex brain networks: graph theoretical analysis of structural and functional systems. Nat. Rev. Neurosci. 10, 186–198.
Cao, F., Bitan, T., and Booth, J. R. (2008). Effective brain connectivity in children with reading difficulties during phonological processing. Brain Lang. 107, 91–101.
Carreiras, M., Seghier, M. L., Baquero, S., Estevez, A., Lozano, A., Devlin, J. T., and Price, C. J. (2009). An anatomical signature for literacy. Nature 461, 983–986.
Catani, M., and Thiebaut de Schotten, M. (2008). A diffusion tensor imaging tractography atlas for virtual in vivo dissections. Cortex 44, 1105–1132.
Chow, H. M., Kaup, P., Raabe, M., and Greenlee, M. W. (2008). Evidence of fronto-temporal interactions for strategic inference processes during language comprehension. Neuroimage 40, 940–954.
Crossley, N. A., Mechelli, A., Fusar-Poli, P., Broome, M. R., Matthiasson, P., Johns, L. C., Bramon, E., Valmaggia, L., Williams, S. C., and McGuire, P. K. (2009). Superior temporal lobe dysfunction and frontotemporal dysconnectivity in subjects at risk of psychosis and in first-episode psychosis. Hum. Brain Mapp. 30, 4129–4137.
Daunizeau, J., David, O., and Stephan, K. E. (2010). Dynamic causal modelling: a critical review of the biophysical and statistical foundations. Neuroimage doi: 10.1016/j.neuroimage.2009.11.062. (in press).
Daunizeau, J., Friston, K. J., and Kiebel, S. J. (2009). Variational Bayesian identification and prediction of stochastic nonlinear dynamic causal models. Physica D 238, 2089–2118.
de Marco, G., Devauchelle, B., and Berquin, P. (2009). Brain functional modeling, what do we measure with fMRI data? Neurosci. Res. 64, 12–19.
Dempster, A. P., Laird, N. M., and Rubin, D. B. (1977). Maximum Likelihood from Incomplete Data via the EM Algorithm. J. R. Stat. Soc. Series B 39, 1–38.
den Ouden, H. E., Daunizeau, J., Roiser, J., Friston, K. J., and Stephan, K. E. (2010). Striatal prediction error modulates cortical coupling. J. Neurosci. 30, 3210–3219.
Dima, D., Roiser, J. P., Dietrich, D. E., Bonnemann, C., Lanfermann, H., Emrich, H. M., and Dillo, W. (2009). Understanding why patients with schizophrenia do not perceive the hollow-mask illusion using dynamic causal modelling. Neuroimage 46, 1180–1186.
Doeller, C. F., King, J. A., and Burgess, N. (2008). Parallel striatal and hippocampal systems for landmarks and boundaries in spatial memory. Proc. Natl. Acad. Sci. U.S.A. 105, 5915–5120.
Eickhoff, S. B., Dafotakis, M., Grefkes, C., Shah, N. J., Zilles, K., and Piza-Katzer, H. (2008). Central adaptation following heterotopic hand replantation probed by fMRI and effective connectivity analysis. Exp. Neurol. 212, 132–144.
Eickhoff, S. B., Heim, S., Zilles, K., and Amunts, K. (2009). A systems perspective on the effective connectivity of overt speech production. Philos Transact A Math Phys Eng Sci 367, 2399–2421.
Ethofer, T., Anders, S., Erb, M., Herbert, C., Wiethoff, S., Kissler, J., Grodd, W., and Wildgruber, D. (2006). Cerebral pathways in processing of affective prosody: a dynamic causal modeling study. Neuroimage 30, 580–587.
Fairhall, S. L., and Ishai, A. (2007). Effective connectivity within the distributed cortical network for face perception. Cereb. Cortex 17, 2400–2406.
Fan, J., Hof, P. R., Guise, K. G., Fossella, J. A., and Posner, M. I. (2008). The functional integration of the anterior cingulate cortex during conflict processing. Cereb. Cortex 18, 796–805.
Fan, L. Y., Lee, S. H., and Chou, T. L. (2010). Interaction between brain regions during semantic processing in Chinese adults. Lang. Linguist. 11, 159–182.
Friston, K. J. (1994). Functional and effective connectivity in neuroimaging: a synthesis. Hum. Brain Mapp. 2, 56–78.
Friston, K. J. (2002a). Bayesian estimation of dynamical systems: an application to fMRI. Neuroimage 16, 513–530.
Friston, K. J. (2002b). Functional integration and inference in the brain. Prog. Neurobiol. 68, 113–143.
Friston, K. J. (2007). “Functional integration,” in Statistical Parametric Mapping: The Analysis of Functional Brain Images, eds K. J. Friston, J. T. Ashburner, S. J. Kiebel, T. E. Nichols, and W. D. Penny (London: Elsevier), 471–491.
Friston, K. J. (2009a). Causal modelling and brain connectivity in functional magnetic resonance imaging. PLoS Biol. 7, e1000033. doi: 10.1371/journal.pbio.1000033.
Friston, K. J. (2009b). Modalities, modes, and models in functional neuroimaging. Science 326, 399–403.
Friston, K. J., Buechel, C., Fink, G. R., Morris, J., Rolls, E., and Dolan, R. J. (1997). Psychophysiological and modulatory interactions in neuroimaging. Neuroimage 6, 218–229.
Friston, K. J., and Dolan, R. J. (2010). Computational and dynamic models in neuroimaging. Neuroimage 52, 752–765.
Friston, K. J., Harrison, L., and Penny, W. (2003). Dynamic causal modelling. Neuroimage 19, 1273–1302.
Friston, K. J., Mattout, J., Trujillo-Barreto, N., Ashburner, J., and Penny, W.D. (2007). “Variational Bayes under the Laplace approximation,” in Statistical Parametric Mapping: The Analysis of Functional Brain Images, eds K. J. Friston, J. T. Ashburner, S. J. Kiebel, T. E. Nichols, and W. D. Penny. (London: Elsevier), 606–618.
Fujii, T., Tanabe, H. C., Kochiyama, T., and Sadato, N. (2009). An investigation of cross-modal plasticity of effective connectivity in the blind by dynamic causal modeling of functional MRI data. Neurosci. Res. 65, 175–186.
Goulden, N., McKie, S., Suckling, J., Williams, S. R., Anderson, I. M., Deakin, J. F., and Elliott, R. (2010). A comparison of permutation and parametric testing for between group effective connectivity differences using DCM. Neuroimage 50, 509–515.
Grefkes, C., Nowak, D. A., Eickhoff, S. B., Dafotakis, M., Küst, J., Karbe, H., and Fink, G. R. (2008). Cortical connectivity after subcortical stroke assessed with functional magnetic resonance imaging. Ann. Neurol. 63, 236–246.
Grefkes, C., Nowak, D. A., Wang, L. E., Dafotakis, M., Eickhoff, S. B., and Fink, G. R. (2010). Modulating cortical connectivity in stroke patients by rTMS assessed with fMRI and dynamic causal modeling. Neuroimage 50, 233–242.
Grezes, J., WIcker, B., Berthoz, S., and de Gelder, B. (2009). A failure to grasp the affective meaning of actions in autism spectrum disorder subjects. Neuropsychologia 47, 1816–1825.
Grol, M. J., Majdandzić, J., Stephan, K. E., Verhagen, L., Dijkerman, H. C., Bekkering, H., Verstraten, F. A., and Toni, I. (2007). Parieto-frontal connectivity during visually guided grasping. J. Neurosci. 27, 11877–11887.
Guye, M., Bettus, G., Bartolomei, F., and Cozzone, P. J. (2010). Graph theoretical analysis of structural and functional connectivity MRI in normal and pathological brain networks. MAGMA doi: 10.1007/s10334-010-0205-z (in press).
Hamandi, K., Powell, H. W., Laufs, H., Symms, M. R., Barker, G. J., Parker, G. J., Lemieux, L., and Duncan, J. S. (2008). Combined EEG-fMRI and tractography to visualise propagation of epileptic activity. J. Neurol. Neurosurg. Psychiatr. 79, 594–597.
Harrison, L., Penny, W., and Friston, K. J. (2003). Multivariate autoregressive modeling of fMRI time series. Neuroimage 19, 1477–1491.
Harrison, L. M., Stephan, K. E., and Friston, K. J. (2007). “Effective connectivity,” in Statistical Parametric Mapping: The Analysis of Functional Brain Images, eds K. J. Friston, J. T. Ashburner, S. J. Kiebel, T. E. Nichols, and W. D. Penny (London: Elsevier), 508–521.
Hasselmo, M. E. (1997). A computational model of the progression of Alzheimer’s disease. MD Comput. 14, 181–191.
He, B. J., Shulman, G. L., Snyder, A. Z., and Corbetta, M. (2007). The role of impaired neuronal communication in neurological disorders. Curr. Opin. Neurol. 20, 655–660.
Heim, S., Eickhoff, S. B., Ischebeck, A. K., Friederici, A. D., Stephan, K. E., and Amunts, K. (2009). Effective connectivity of the left BA 44, BA 45, and inferior temporal gyrus during lexical and phonological decisions identified with DCM. Hum. Brain Mapp. 30, 392–402.
Honey, C. J., and Sporns, O. (2008). Dynamical consequences of lesions in cortical networks. Hum. Brain Mapp. 29, 802–809.
Horwitz, B., McIntosh, A. R., Haxby, J. V., Furey, M., Salerno, J. A., Schapiro, M. B., Rapoport, S. I., and Grady, C. L. (1995). Network analysis of PET-mapped visual pathways in Alzheimer type dementia. Neuroreport 6, 2287–2292.
Kaiser, M., Martin, R., Andras, P., and Young, M. P. (2007). Simulation of robustness against lesions of cortical networks. Eur. J. Neurosci. 25, 3185–3192.
Kasess, C. H., Windischberger, C., Cunnington, R., Lanzenberger, R., Pezawas, L., and Moser, E. (2008). The suppressive influence of SMA on M1 in motor imagery revealed by fMRI and dynamic causal modeling. Neuroimage 40, 828–837.
Kim, J., and Horwitz, B. (2009). How well does structural equation modeling reveal abnormal brain anatomical connections? An fMRI simulation study. Neuroimage 45, 1190–1198.
Leff, A. P., Schofield, T. M., Stephan, K. E., Crinion, J. T., Friston, K. J., and Price, C. J. (2008). The cortical dynamics of intelligible speech. J. Neurosci. 28, 13209–13215.
Li, J., Liu, J., Liang, J., Zhang, H., Zhao, J., Rieth, C. A., Huber, D. E., Li, W., Shi, G., Ai, L., Tian, J., and Lee, K. (2010a). Effective connectivities of cortical regions for top-down face processing: a dynamic causal modeling study. Brain Res. 1340, 40–51.
Li, X., Marrelec, G., Hess, R. F., and Benali, H. (2010b). A nonlinear identification method to study effective connectivity in functional MRI. Med. Image Anal. 14, 30–38.
Li, K., Guo, L., Nie, J., Li, G., and Liu, T. (2009). Review of methods for functional brain connectivity detection using fMRI. Comput. Med. Imaging. Graph. 33, 131–139.
Marreiros, A. C., Kiebel, S. J., and Friston, K. J. (2008). Dynamic causal modelling for fMRI: a two-state model. Neuroimage 39, 269–278.
Marrelec, G., Kim, J., Doyon, J., and Horwitz, B. (2009). Large-scale neural model validation of partial correlation analysis for effective connectivity investigation in functional MRI. Hum. Brain Mapp. 30, 941–950.
McIntosh, A. R., and Gonzalez-Lima, F. (1994). Structural equation modeling and its application to network analysis in functional brain imaging. Hum. Brain Mapp. 2, 2–22.
Mechelli, A., Allen, P., Amaro, E. J., Fu, C. H., Williams, S. C., Brammer, M. J., Johns, L. C., and McGuire, P. K. (2007). Misattribution of speech and impaired connectivity in patients with auditory verbal hallucinations. Hum. Brain Mapp. 28, 1213–1222.
Meyer-Lindenberg, A., Poline, J. B., Kohn, P. D., Holt, J. L., Egan, M. F., Weinberger, D. R., and Berman, K. F. (2001). Evidence for abnormal cortical functional connectivity during working memory in schizophrenia. Am. J. Psychiatry 158, 1809–1817.
Mintzopoulos, D., Astrakas, L. G., Khanicheh, A., Konstas, A. A., Singhal, A., Moskowitz, M. A., Rosen, B. R., and Tzika, A. A. (2009). Connectivity alterations assessed by combining fMRI and MR-compatible hand robots in chronic stroke. Neuroimage 47, T90-T97.
Miyake, Y., Okamoto, Y., Onoda, K., Shirao, N., Okamoto, Y., Otagaki, Y., and Yamawaki, S. (2010). Neural processing of negative word stimuli concerning body image in patients with eating disorders: an fMRI study. Neuroimage 50, 1333–1339.
Mori, S., Oishi, K., Jiang, H., Jiang, L., Li, X., Akhter, K., Hua, K., Faria, A. V., Mahmood, A., Woods, R., Toga, A. W., Pike, G. B., Neto, P. R., Evans, A., Zhang, J., Huang, H., Miller, M. I., van Zijl, P., and Mazziotta, J. (2008). Stereotaxic white matter atlas based on diffusion tensor imaging in an ICBM template. Neuroimage 40, 570–582.
Mori, S., Wakana, S., van Zijl, P. C. M., and Nagae-Poetscher, L. M. (2005). MRI Atlas of Human White Matter. Amsterdam Elsevier.
Penny, W. D., Stephan, K. E., Daunizeau, J., Rosa, M. J., Friston, K. J., Schofield, T. M., and Leff, A. P. (2010). Comparing families of dynamic causal models. PLoS Comput. Biol. 6, e1000709. doi: 10.1371/journal.pcbi.1000709.
Penny, W. D., Stephan, K. E., Mechelli, A., and Friston, K. J. (2004). Modelling functional integration: a comparison of structural equation and dynamic causal models. Neuroimage 23, S264–S274.
Plailly, J., Howard, J. D., Gitelman, D. R., and Gottfried, J. A. (2008). Attention to odor modulates thalamocortical connectivity in the human brain. J. Neurosci. 28, 5257–5267.
Price, C. J., Crinion, J., and Friston, K. J. (2006). Design and analysis of fMRI studies with neurologically impaired patients. J. Magn. Reson. Imaging 23, 816–826.
Rajapakse, J. C., and Zhou, J. (2007). Learning effective brain connectivity with dynamic Bayesian networks. Neuroimage 37, 749–760.
Ramnani, N., Behrens, T. E., Penny, W. D., and Matthews, P. M. (2004). New approaches for exploring anatomical and functional connectivity in the human brain. Biol. Psychiatry 56, 613–619.
Rocca, M. A., Pagani, E., Absinta, M., Valsasina, P., Falini, A., Scotti, G., Comi, G., and Filippi, M. (2007a). Altered functional and structural connectivities in patients with MS. Neurology 69, 2136–2145.
Rocca, M. A., Valsasina, P., Ceccarelli, A., Absinta, M., Ghezzi, A., Riccitelli, G., Pagani, E., Falini, A., Comi, G., Scotti, G., and Filippi, M. (2007b). Structural and functional MRI correlates of Stroop control in benign MS. Hum. Brain Mapp. 30, 276–290.
Roebroeck, A., Formisano, E., and Goebel, R. (2005). Mapping directed influence over the brain using Granger causality and fMRI. Neuroimage 25, 230–242.
Rogers, B. P., Morgan, V. L., Newton, A. T., and Gore, J. C. (2007). Assessing functional connectivity in the human brain by fMRI. Magn. Reson. Imaging 25, 1347–1357.
Rowe, J. B., Hughes, L. E., Barker, R. A., and Owen, A. M. (2010). Dynamic causal modelling of effective connectivity from fMRI: are results reproducible and sensitive to Parkinson’s disease and its treatment? Neuroimage 52, 1015–1026.
Rubinov, M., and Sporns, O. (2010). Complex network measures of brain connectivity: uses and interpretations. Neuroimage 52, 1059–1069.
Schlosser, R. G., Wagner, G., Koch, K., Dahnke, R., Reichenbach, J. R., and Sauer, H. (2008). Fronto-cingulate effective connectivity in major depression: a study with fMRI and dynamic causal modeling. Neuroimage 43, 645–655.
Schlosser, R. G., Wagner, G., Schachtzabel, C., Peikert, G., Koch, K., Reichenbach, J. R., and Sauer, H. (2010). Fronto-cingulate effective connectivity in obsessive compulsive disorder: a study with fMRI and dynamic causal modeling. Hum. Brain Mapp. doi: 10.1002/hbm.20980 (in press).
Seghier, M. L., and Price, C. J. (2010). Reading aloud boosts connectivity through the putamen. Cereb. Cortex 20, 570–582.
Shannon, K. E., Sauder, C., Beachaine, T. P., and Gatzke-Kopp, L. M. (2009). Disrupted effective connectivity between the medial frontal cortex and the caudate in adolescent boys with externalizing behavior disorders. Crim. Justice Behav. 36, 1141–1157.
Smith, A. P., Stephan, K. E., Rugg, M. D., and Dolan, R. J. (2006). Task and content modulate amygdala-hippocampal connectivity in emotional retrieval. Neuron 49, 631–638.
Smith, J. F., Pillai, A., Chen, K., and Horwitz, B. (2010). Identification and validation of effective connectivity networks in functional magnetic resonance imaging using switching linear dynamic systems. Neuroimage 52, 1027–1040.
Sonty, S. P., Mesulam, M. M., Weintraub, S., Johnson, N. A., Parrish, T. B., and Gitelman, D. R. (2007). Altered effective connectivity within the language network in primary progressive aphasia. J. Neurosci. 27, 1334–1345.
Stephan, K. E., Harrison, L. M., Kiebel, S. J., David, O., Penny, W. D., and Friston, K. J. (2007). Dynamic causal models of neural system dynamics: current state and future extensions. J. Biosci. 32, 129–144.
Stephan, K. E., Kasper, L., Harrison, L. M., Daunizeau, J., den Ouden, H. E., Breakspear, M., and Friston, K. J. (2008). Nonlinear dynamic causal models for fMRI. Neuroimage 42, 649–662.
Stephan, K. E., Penny, W. D., Daunizeau, J., Moran, R. J., and Friston, K. J. (2009a). Bayesian model selection for group studies. Neuroimage 46, 1004–1017.
Stephan, K. E., Tittgemeyer, M., Knosche, T. R., Moran, R. J., and Friston, K. J. (2009b). Tractography-based priors for dynamic causal models. Neuroimage 47, 1628–1638.
Stephan, K. E., Penny, W. D., Moran, R. J., den Ouden, H. E., Daunizeau, J., and Friston, K. J. (2010). Ten simple rules for dynamic causal modeling. Neuroimage 49, 3099–3109.
Stevens, M. C., Kiehl, K. A., Pearlson, G. D., and Calhoun, V. D. (2007). Functional neural networks underlying response inhibition in adolescents and adults. Behav. Brain Sci. 181, 12–22.
Tauchmanova, J., and Hromcik, M. (2008). Subspace Identification Methods and fMRI Analysis. 30th Annual International IEEE EMBS Conference, Vancouver, 4427-4430.
Vaudano, A. E., Laufs, H., Kiebel, S. J., Carmichael, D. W., Hamandi, K., Guye, M., Thornton, R., Rodionov, R., Friston, K. J., Duncan, J. S., and Lemieux, L. (2009). Causal hierarchy within the thalamo-cortical network in spike and wave discharges. PLoS ONE 4, e6475. doi: 10.1371/journal.pone.0006475.
Wang, L., Liu, X., Guise, K. G., Knight, R. T., Ghajar, J., and Fan, J. (2010). Effective connectivity of the fronto-parietal network during attentional control. J. Cogn. Neurosci. 22, 543–553.
Ween, J. E. (2008). Functional imaging of stroke recovery: an ecological review from a neural network perspective with an emphasis on motor systems. J. Neuroimaging 18, 227–236.
Witt, S. T., and Meyerand, M. E. (2009). The effects of computational method, data modeling, and TR on effective connectivity results. Brain Imaging Behav. 3, 220–231.
Keywords: dynamic causal modeling, effective connectivity, functional MRI, patients, abnormal connectivity, abnormal networks
Citation: Seghier ML, Zeidman P, Neufeld NH, Leff AP and Price CJ (2010) Identifying abnormal connectivity in patients using dynamic causal modeling of fMRI responses. Front. Syst. Neurosci. 4:142. doi: 10.3389/fnsys.2010.00142
Received: 21 June 2010;
Paper pending published: 27 July 2010;
Accepted: 12 August 2010;
Published online: 26 August 2010
Edited by:
Barry Horwitz, National Institutes of Health, USAReviewed by:
Alumit Ishai, University of Zurich, SwitzerlandBarry Horwitz, National Institutes of Health, USA
Copyright: © 2010 Seghier, Zeidman, Neufeld, Leff and Price. This is an open-access article subject to an exclusive license agreement between the authors and the Frontiers Research Foundation, which permits unrestricted use, distribution, and reproduction in any medium, provided the original authors and source are credited.
*Correspondence: Mohamed L. Seghier, Wellcome Trust Centre for Neuroimaging, Institute of Neurology, University College London, 12 Queen Square, London WC1N 3BG, UK. e-mail: m.seghier@fil.ion.ucl.ac.uk