Modular organization of functional network connectivity in healthy controls and patients with schizophrenia during the resting state
- 1 The Mind Research Network, Albuquerque, NM, USA
- 2 Department of Psychology, University of New Mexico, Albuquerque, NM, USA
- 3 Olin Neuropsychiatry Research Center, Hartford, CT, USA
- 4 Departments of Psychiatry and Neurobiology, Yale University, New Haven, CT, USA
- 5 Department of ECE, University of New Mexico, Albuquerque, NM, USA
Neuroimaging studies have shown that functional brain networks composed from select regions of interest have a modular community structure. However, the organization of functional network connectivity (FNC), comprising a purely data-driven network built from spatially independent brain components, is not yet clear. The aim of this study is to explore the modular organization of FNC in both healthy controls (HCs) and patients with schizophrenia (SZs). Resting state functional magnetic resonance imaging data of HCs and SZs were decomposed into independent components (ICs) by group independent component analysis (ICA). Then weighted brain networks (in which nodes are brain components) were built based on correlations between ICA time courses. Clustering coefficients and connectivity strength of the networks were computed. A dynamic branch cutting algorithm was used to identify modules of the FNC in HCs and SZs. Results show stronger connectivity strength and higher clustering coefficient in HCs with more and smaller modules in SZs. In addition, HCs and SZs had some different hubs. Our findings demonstrate altered modular architecture of the FNC in schizophrenia and provide insights into abnormal topological organization of intrinsic brain networks in this mental illness.
Introduction
Modular community structure is one of the most ubiquitous properties of complex networks (Newman, 2006; Bullmore and Sporns, 2009) and is repeatedly demonstrated in resting state functional brain connectivity networks (Salvador et al., 2005; Ferrarini et al., 2009; He et al., 2009; Meunier et al., 2009b; Smith et al., 2009; Shen et al., 2010). Each module consists of brain regions which may be functionally associated and subserve similar roles (Ravasz et al., 2002; He et al., 2009). Modular structure is crucial for robustness of network stability (Variano et al., 2004) and optimal network functions (Pan and Sinha, 2007), and is related to the balance of functional segregation and integration and high resilience to network node or edge damages (He et al., 2009; Rubinov and Sporns, 2010). Modularity of brain networks may play a critical role in its evolution and neurodevelopment (Kashtan and Alon, 2005; Meunier et al., 2010; Bassett et al., 2011). Some studies have identified different modular communities of brain networks in different groups. For example, Meunier et al. (2009a) showed age-related changes of modules in brain networks; Balenzuela et al. (2010) found differences in the membership of key communities of frontal and temporal regions; Alexander-Bloch et al. (2010) detected disrupted modularity of functional brain networks in childhood-onset schizophrenia. However, these studies typically work with networks whose nodes are selected regions of interest (ROIs) which do not necessarily respect the functional boundaries of the human brain. Several studies have demonstrated detriment to network estimation using atlas-based ROIs, both with simulated and real data (Smith et al., 2011; Craddock et al., 2011; Shirer et al., 2012). In contrast, independent component analysis (ICA), which has been widely used to analyze fMRI data after the initial work of McKeown et al. (1998), provides a natural approach to construct networks by defining brain components as functionally homogeneous nodes (Ding et al., 2011; Yu et al., 2011). In this study, weighted networks were built based on ICA-derived components.
It has been hypothesized that brain disorders such as schizophrenia are associated with developmental factors (van Os et al., 2010), thus it is sensible to examine modular organization in schizophrenia in the hope that it may provide biomarkers of altered brain development in this psychosis (Alexander-Bloch et al., 2010). Although Jafri et al. (2008) evaluated functional connectivity among brain components (which was called functional network connectivity, FNC) by computing pairwise correlations between ICA time courses and identified differences in FNC of resting state brain networks in patients with schizophrenia (SZs) as compared to healthy controls (HCs), and Yu et al. (2011) found altered small-world topological metrics of FNC in SZs, the modular organization of FNC in both HCs and SZs has not been studied.
The present study is aimed to explore the community structure of resting state brain networks consisting of intrinsic temporally coherent brain components in both HCs and SZs. Resting state functional magnetic resonance imaging (R-fMRI) data acquired from HCs and SZs were decomposed into independent components (ICs) by group ICA. To avoid hard thresholding, weighted networks were built from Pearson correlation of ICA time courses. Then, a dynamic branch cutting algorithm (Langfelder et al., 2008; Mumford et al., 2010) was employed to detect modules of the FNC. Based on previous studies (He et al., 2009; Alexander-Bloch et al., 2010; Mumford et al., 2010) which found modular organization of brain networks and dysconnectivity in schizophrenia, we predicted that the brain components of the FNC could be grouped into modules in both groups and the modular organization would be altered in SZs compared with HCs. We believe the results will increase our understanding of the organization of data-driven functional brain networks in schizophrenia.
Materials and Methods
Participants
Subjects consisted of 24 (eight females) HCs (mean age: 31.7 ± 9.2; range: 23–50) and 24 (five females) SZs (mean age: 35.9 ± 12.1; range: 21–52). Age showed no significant group difference (two-sample t-test, P = 0.18). All subjects provided written, informed, IRB-approved consent from Hartford Hospital and Yale University and were compensated for their participation. Schizophrenia was diagnosed according to DSM-IV TR criteria on the basis of a structured clinical interview (First et al., 1995) administered by a research nurse and by review of the medical records. All patients had chronic schizophrenia (positive and negative syndrome scale, PANSS; Kay et al., 1987: positive score 16 ± 6, range 7–28; negative score 15 ± 6, range 7–27) and all were taking medication (including the atypical antipsychotic medications aripiprazole, clozapine, risperidone, quetiapine, and olanzapine, first-generation antipsychotics including fluphenazine, and miscellaneous mood-stabilizing, hypnotic, and anti-cholinergic medications including zolpidem, zaleplon, lorazepam, benztropine, divalproex, trazodone, clonazepam). All participants except one HC and three patients were right-handed. Exclusion criteria included auditory or visual impairment, mental retardation (full scale IQ < 70), traumatic brain injury with loss of consciousness greater than 15 min, and presence or history of any central nervous system (CNS) neurological illness. Participants were also excluded if they met criteria for alcohol or drug dependence within the past 6 months or showed a positive urine toxicology screen (screening was for cocaine, opioids including methadone, cannabis, amphetamine, barbiturates, PCP, propoxyphene, and benzodiazepines) on the day of scanning. Healthy participants were free of any DSM-IV TR Axis I disorder or psychotropic medication and had no family history of Axis I disorders. A subset of the data has been reported in Yu et al. (2011).
Image Acquisition
One 5-min resting state run for each subject was acquired at the Olin Neuropsychiatry Research Center at the Institute of Living/Hartford Hospital on a Siemens Allegra 3T dedicated head scanner equipped with 40 mT/m gradients and a standard quadrature head coil. Functional scans were acquired transaxially using gradient-echo echo-planar-imaging with the following parameters: repeat time (TR) 1.50 s, echo time (TE) 27 ms, field of view 24 cm, acquisition matrix 64 × 64, flip angle 70°, voxel size 3.75 mm × 3.75 mm × 4 mm, slice thickness 4 mm, gap 1 mm, 29 slices, ascending acquisition. Six “dummy” scans were acquired at the beginning to allow for longitudinal equilibrium, after which the paradigm was automatically triggered to start by the scanner.
Preprocessing
Functional magnetic resonance imaging Data were preprocessed using the SPM51 software package. Data were motion corrected using INRIalign, a motion correction algorithm unbiased by local signal changes (Freire et al., 2002), spatially normalized into the standard Montreal Neurological Institute (MNI) space, and spatially smoothed with a 10 mm × 10 mm × 10 mm full width at half-maximum Gaussian kernel. Following spatial normalization, the data (originally acquired at 3.75 mm × 3.75 mm × 4 mm) were resliced to 3 mm × 3 mm × 3 mm, resulting in 53 × 63 × 46 voxels.
Group ICA
Group spatial ICA (Calhoun et al., 2001, 2009) was performed using the GIFT software2. Subject-specific data reduction by principal components analysis (PCA) retained 100 principal components (PCs) using a standard economy-size decomposition. Group data reduction retained 75 PCs using the expectation-maximization (EM) algorithm, included in GIFT. Reduced data for all 48 participants were then decomposed into 75 aggregate components (this model order was manually set). We chose the relatively high model order ICA as previous studies demonstrated that such models yield refined components which correspond to known anatomical and functional segmentations (Kiviniemi et al., 2009; Smith et al., 2009; Abou-Elseoud et al., 2010; Allen et al., 2011). The Infomax ICA algorithm (Bell and Sejnowski, 1995) was repeated 10 times in ICASSO3 and resulting components were clustered to estimate the reliability of the decomposition. Following the group decomposition, single subject time courses and spatial maps were back-reconstructed (Calhoun et al., 2001; Erhardt et al., 2011). Fifty-seven components that did not contain large edge effects or ventricles by visual inspection were selected for further analysis. Temporal band-pass filtering (0.01 < f < 0.10 Hz; Cordes et al., 2001; Auer, 2008) was performed on all the component time courses before computing the correlations.
Weighted Network Building
Following Mumford et al. (2010), N × N (N = 57 in this study) weighted networks (in which nodes are ICs) were built for each subject. The weighted network approach allows the connection between two components to be a continuous measure ranging between 0 and 1. The first step was to calculate the Pearson correlation of ICA time courses between all pairs of brain components, rij. To distinguish between positive and negative correlations, we then computed a signed similarity measure (Mason et al., 2009) defined as
Note that a correlation of −1 has a similarity of 0.
Since altered network metrics have been found in SZs (Lynall et al., 2010). It is natural to examine properties such as connectivity strength and clustering coefficient of the weighted FNC in the present study. Connectivity strength is a global measure of connectivity (Lynall et al., 2010). The strength of the ith component is likewise defined as the average of the correlations between it and all other brain components,
Then the connectivity strength of whole network is
The clustering coefficient can characterize the local structure of graphs (Onnela et al., 2005; Rubinov and Sporns, 2010). In a weighted network, the clustering coefficient can be computed as
where
Identifying Modules
Modules of the weighted FNC were indentified in two steps. First, a dendrogram was created using average linkage hierarchical clustering with the dissimilarity measure, 1 − Sij. Then, the clusters in the resulting dendrogram were indentified using dynamic branch cutting algorithm (Mumford et al., 2010). This approach detects clusters in a hierarchical tree based on the tree shape, as opposed to defining each contiguous branch below a fixed height cutoff as a separate cluster. For details of the algorithm, see Langfelder et al. (2008).
When performing the dynamic tree cut algorithm, the minimum module size is a free parameter and must be chosen by the user. By inspection of the dendrogram of controls (see Figure 2), a branch (i.e., Module I) composed of six nodes is visually distinct, therefore, a minimum module size of six components was specified in this study.
Highly connected components within a module could be identified by the measure of intramodule connectivity which is given by

Where nq is the number of components in module q (Mumford et al., 2010). Its z-score can be computed as
Where  is the average intramodule connectivity over all nodes in module q (Guimera and Amaral, 2005; Meunier et al., 2009a; Balenzuela et al., 2010) and σq is the corresponding SD of the intramodule connectivity in module q. Thus, zi will be higher for nodes that are more strongly connected to the other nodes in the same module. In this study, we define a node with zi > 1.0 as a hub.
Statistical Analysis and Group Level Analysis
Since a weighted network (similarity matrix) was built for each subject, network metrics and modular organization were determined for each individual. Statistical differences between HCs and SZs of connectivity strength (knet) and clustering coefficient  for the whole network and individual nodes were assessed with two-tailed two-sample t-tests. A statistical comparison of the number of modules between the two groups was performed using a non-parametric permutation test (100,000 iterations).
For modular analysis at the group level, a mean similarity matrix was first computed for each group (by averaging across 24 subjects), then modules and hub nodes of each group mean similarity matrix were determined.
For all statistical analyses, false discovery rate (FDR) was used to correct for multiple comparisons accordingly.
Results
Group ICA and Weighted Network
Brain components indentified by ICA are similar to those observed in previous studies (Abou-Elseoud et al., 2010; Allen et al., 2011). Spatial maps for each of the selected 57 ICs are shown in Figures A1–A6 (images are displayed using neurological convention). ICs are indexed based on the sequence of output from GIFT. Figure 1 shows the mean connectivity matrix (after ordering by modules) calculated by averaging the N × N (N = 57 in this study) signed similarity matrix across all 24 subjects within each group.
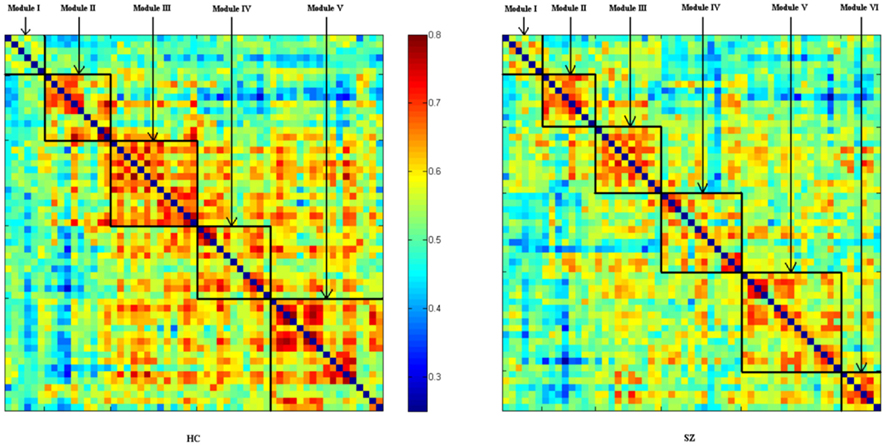
Figure 1. Structure of mean signed similarity for each group after organized by modules. ICs’ index (from top to down; from left to right) is: HC, Module I (22 30 31 36 52 57), Module II (8 13 20 34 50 51 9 37 45 54), Module III (4 21 25 27 39 40 43 53 6 12 15 17 48), Module IV (3 32 42 2 5 7 18 23 26 38 44), Module V (19 24 28 33 35 47 49 55 10 16 29 46 56 1 11 14 41); SZ, Module I (22 30 31 36 52 57), Module II (8 13 20 34 50 51 1 11), Module III (4 21 25 27 39 40 43 53 5 18), Module IV (3 32 42 9 12 14 17 37 41 45 48 54), Module V (19 24 28 33 35 47 49 55 2 6 15 23 26 38 44), Module VI (10 16 29 46 56 7).
Connectivity strength of the whole network is slightly higher (as is evident in Figure 1) in HCs (HCs: 0.558 ± 0.035; SZs: 0.541 ± 0.025; P = 0.057, marginally significant). The clustering coefficient of the whole network is also higher in HCs (HCs: 0.548 ± 0.033; SZs: 0.530 ± 0.026; P = 0.043). Connectivity strengths and clustering coefficients of some individual nodes are also higher in HCs (see Table A1 in Appendix), though none of the tests pass significance (P < 0.05) after FDR correcting for multiple comparisons over 57 nodes.
Modular Organizations
Compared with controls, more numerous and smaller communities were identified in SZs. Module counts, listed as the number of modules (number of subjects with that number of modules) were for HCs, 3(3) 4(9) 5(8) 6(4) 7(0), mean 4.54, and for SZs, 3(0) 4(5) 5(9) 6(9) 7(1), mean 5.25 (permutation test for a difference in means, P = 0.005).
For group level networks, five and six communities were indentified in HCs and SZs, respectively. Figure 1 shows the structure of mean connectivity in each group after organizing ICs by modules. Figure 2 shows group results of dendrogram and modules indentified by the dynamic tree cut algorithm in HCs and SZs. After inspecting and counting the number of common ICs in each community between the groups, the modules were indexed and labeled as Module I (green), Module II (yellow), Module III (blue), Module IV (brown), Module V (turquoise), and Module VI (red). Figure 3 shows the community structure of the FNC for each group. Table 1 depicts the summary of the community organization in each group. Spatial maps of the components in each module for the two groups are shown in Figures A1–A6 in Appendix.
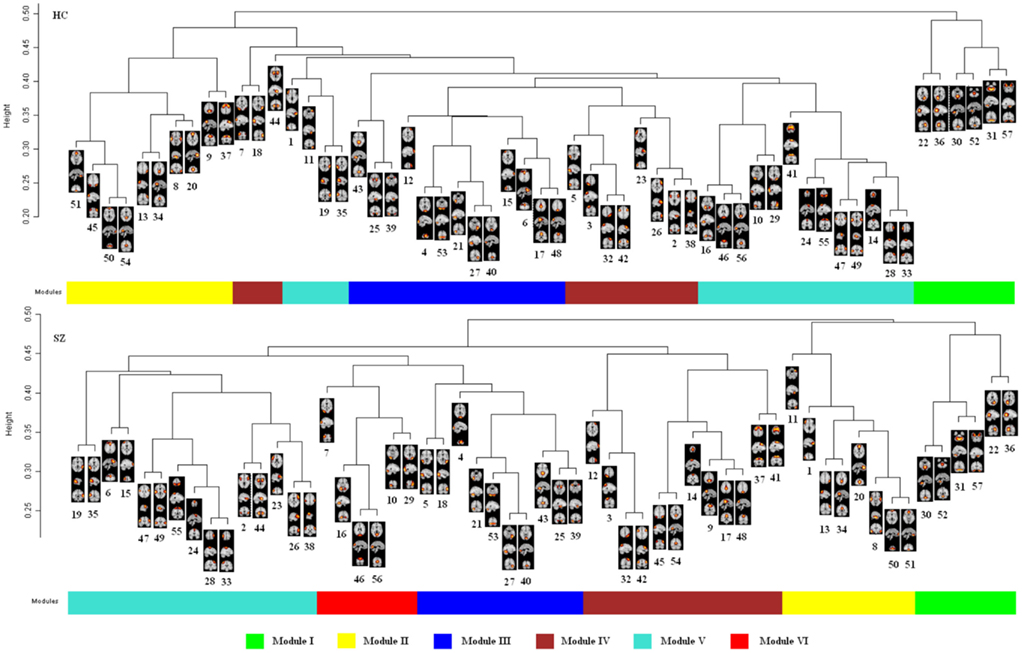
Figure 2. Dendrogram and modules found using the dynamic tree cutting algorithm in each group. Each figure shows the hierarchical structure of the FNC based on the mean signed similarity across 24 HCs or 24 SZs. Modules are labeled by colors. Numbers under maps of brain components are IC indexes as determined by the sequence of output from GIFT. Not all nodes in a same module are close to each other in the dendrogram (see Module IV and Module V of HCs for example). That is because “Dynamic Hybrid” variant which improves the detection of outlying members of each cluster was selected when performing the dynamic branch cut algorithm. In addition to information from the dendrogram, it utilizes dissimilarity information among the objects. For details of the algorithm see Langfelder et al. (2008).
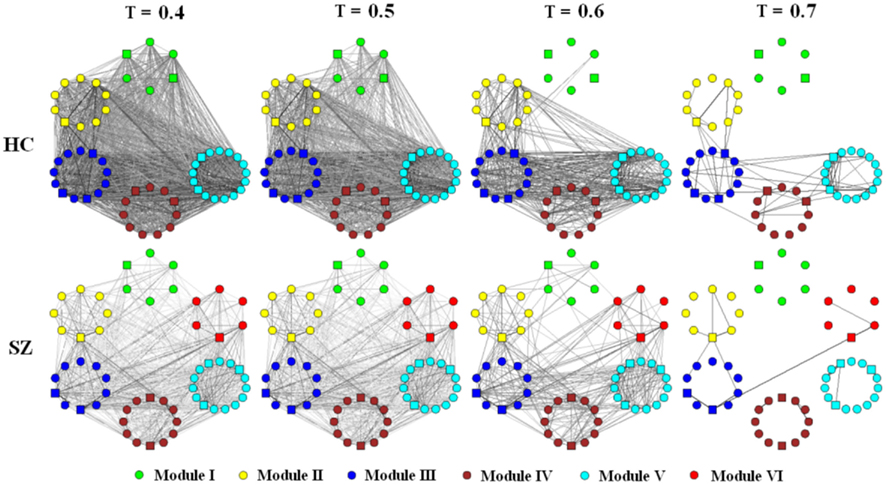
Figure 3. Schematic modular architecture of FNC for each group. Nodes in a given module are placed in a small circle. To show how edges disappear with threshold (T) change, graphs (each consisted of 57 ICs) built by T at 0.4, 0.5, 0.6, and 0.7 are shown respectively. An edge (either inter- or intra-module edge) is shown in the graph if its weight bigger then T. The thicker and the darker an edge, the higher its weight. Hubs are indicated by square nodes.
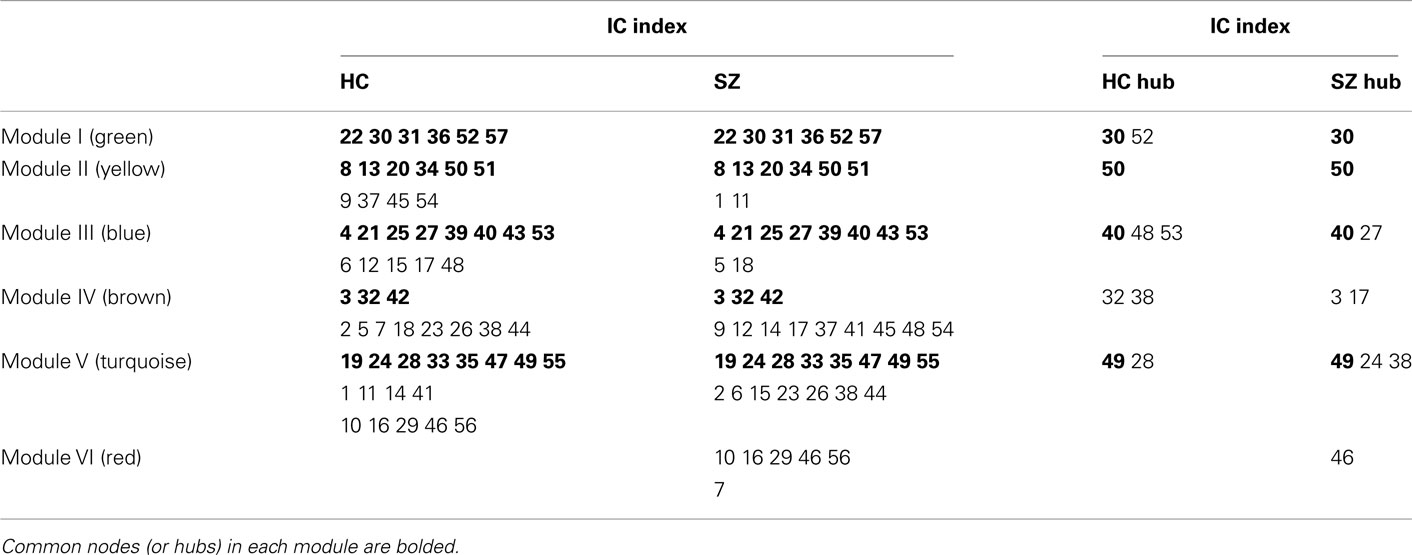
Table 1. Summary of the modular organization of the group results in HCs and SZs.
A descriptive analysis of these findings can be summarized as follows. Module I is composed of six ICs, most of which are cerebellar and occipital components. All of the six ICs are common in the two groups. We designated this module as the “cerebellar–occipital module” (C–O Module). In Module II, the two groups have six common ICs most of which can be considered to represent default mode network (DMN) regions (Buckner et al., 2008). HCs have another four nodes which are also loosely characterized as DMN components, whereas SZs have an additional frontal component and temporal component. This module was designated as the “DMN Module.” In Module III, there are eight common components for HCs and SZs. HCs have an additional five ICs and SZs have two unique ICs. As the components of this module in HCs span almost the whole brain, we designated this module as the “Global Module” (G1 Module). Module IV consists of eleven brain components in HCs and twelve components in SZs with only three ICs common between groups. Since most of the brain components of this module in HCs spatially coincide with elements of the attention network (Corbetta and Shulman, 2002; Vincent et al., 2008), we designated this module as the “Attention Module” (A Module). Module V is composed of seventeen ICs in HCs and fifteen ICs in SZs with eight common brain components between groups. Because HCs components represent regions across almost the whole brain, we designated this module a “Global Module” (G2 Module) as well. Module VI, which is only present in SZs, is composed of six occipital components, thus we designated it the “occipital module” (O Module). Note that the occipital components are distributed over other modules for the HCs.
Hubs
Hubs of each module in each group were identified by computing intra-module connectivity. In Module I (C–O Module), HCs have two cerebellar hubs while SZs have one cerebellar hub. One hub is common in the two groups. In Module II (DMN Module), a frontal hub is common in both groups. In Module III (G1 Module), there are three hubs including one occipital component one cerebellar component and one precuneus component in HCs; two hubs including one occipital and one cerebellar component in SZs. One occipital hub is common. In Module IV (A Module), there are two parietal hubs in HCs and two hubs including one parietal and one cingulum components in SZs. No hub is common in this module. In Module V (G2 Module), two hubs including one parietal and one temporal component were identified in HCs, whereas three hubs including one motor, one temporal, and one parietal component were identified in SZs. The temporal hub is common in both groups. See Table 1 for a summary of hubs in each community. For the spatial maps of hub component see Figures A1–A6 in Appendix.
Discussion
The main aim of this study was to evaluate the modular organization of FNC in HCs and SZs. Weighted networks were built based on Pearson correlation coefficients between time courses for 57 brain ICs (selected as physiologically relevant from all 75 ICs obtained) decomposed from R-fMRI data. HCs had slightly higher connectivity strength and higher clustering coefficient. Communities of the FNC in both groups were identified by using a dynamic tree cut algorithm. Compared to HCs, SZs showed more numerous and smaller modules. In addition, some hubs differed in the FNC of SZs. Our results suggest that brain networks in schizophrenia are dysfunctional due to dysmodular organization of FNC. This kind of aberrant functional brain organization may contribute to abnormal mind of schizophrenia or vice versa.
Rather than using topological nodes defined by anatomical templates such as automated anatomical labeling (AAL; Tzourio-Mazoyer et al., 2002) as in most previous studies (Bullmore and Sporns, 2009), the nodes of our weighted brain graphs are ICs. Our nodal definition is purely data-driven. Each IC presents a temporally coherent set of regions which we believe will provide a more accurate representation of intrinsic functional brain organization. Although some components overlap, the degree of spatial overlap is small because the components are maximally spatially independent.
The finding that connectivity strength of the FNC is higher in HCs provides supporting evidence for the schizophrenia functional dysconnectivity hypothesis (Friston and Frith, 1995) consistent with previous studies (Liang et al., 2006; Bluhm et al., 2007; Pettersson-Yeo et al., 2011). Meanwhile, higher clustering coefficient in HCs is in line with prior studies employing a graph theoretic analysis of brain networks (Liu et al., 2008; Lynall et al., 2010). Our results present novel evidence for altered topological properties in schizophrenia.
The grouping of ICs into several communities by the dynamic branch cut algorithm in both groups is consistent with previous studies which identified modular organization in human brain networks during the resting state (He et al., 2009; Meunier et al., 2009a). Interestingly, we found five corresponding communities in controls and patients which were designated as “C–O Module,” “DMN Module,” “Global Module” (G1 Module), “A Module,” and “Global Module” (G2 Module) respectively. At the same time, our analysis suggests a unique module (O Module) that is more distinct in SZs. Some of these communities are consistent with previous studies (He et al., 2009; Balenzuela et al., 2010). For example, He et al. (2009) identified similar “attention” and “default” modules. However, it is notable that only the brain components in the C–O Module are identical between HCs and SZs. Some ICs in the DMN Module, G1 Module, A Module, and G2 Module differ in patients. This alteration in modular level of brain networks is in agreement with other reports of functional dysconnectivity in schizophrenia (Stephan et al., 2006; Cole et al., 2011). In addition, we identified more and smaller communities in SZs. The O Module in SZs is segregated from G2 Module of HCs. The findings may suggest that communication is disrupted in the schizophrenic brain.
Hubs interact with other brain components, facilitate functional integration, and play a key role in each module organization (Rubinov and Sporns, 2010), thus it is important to examine the changes in role of these nodes between groups (Balenzuela et al., 2010). Here we found some hub differences between HCs and SZs. For example, there are five ICs including two cerebellar components, one precuneus component, one parietal component, and one central component that are hubs only in controls. Another five ICs including one cerebellar component, one cuneus component, one parietal component, one cingulum component, and one motor component are hubs only in SZs. This finding is consistent with previous studies which found abnormal activation (Gillig and Sanders, 2010; White et al., 2011) or dysconnectivity of these brain regions (Danckert et al., 2004; Cheung et al., 2008; Sui et al., 2010; Zalesky et al., 2010) and support our hypothesis that modular organization of FNC is altered in schizophrenia.
Several methodological issues should be considered. First, the sample size is modest (24 HCs and 24 SZs), thus the robustness of our results must be evaluated by replicating the work in larger samples. We further note that although the group difference in number of modules is statistically significant, some subjects from different groups have the same number of modules based on the individual results (nine HCs and five SZs showing four modules; eight HCs and nine SZs showing five modules; four HCs and nine SZs showing six modules). Thus, although we have focused mainly on the differences in modular organization at the group level, there is considerable variation at the individual level. Currently, it is not clear how well modular organization may be estimated at the subject level, and this will be critical to address in future studies before the modularity of FNC may be used in a clinical setting.
Another limitation is that all patients were taking psychotropic medications, therefore drug effects can not be distinguished from those related purely to the disorder. Future research should examine whether these results are similar in neuroleptic naive patients or animal research examining changes in network connectivity with administration of medication. Previous studies found functional connectivity of R-fMRI was sensitive to the influence of head motion (Van Dijk et al., 2012). However, in this study, estimated movement parameters between groups were not significantly different (for maximum translation, two-sample t-test P = 0.434; for maximum rotation, two-sample t-test P = 0.234), suggesting that head motion may have little impact on the group differences observed in our sample.
Finally, we comment on the impact of the minimum module size, a free parameter which must be selected in the dynamic branch cutting algorithm. For our primary analysis, we used a minimum module size of six based on the distinctness and consistency of Module I, however there is currently no mathematical method to determine the appropriate parameter and it’s possible that other values may lead to different results. Thus, we repeated the analysis for values of the minimum module size ranging from 4 to 8 and found the same trend (SZs showing more modules. For details of the results, see Table A2 in Appendix). We conclude that although the ability to detect group differences is affected by the choice of the minimum module size, the directionality of the effect and resulting inference is unchanged.
Conclusion
To our knowledge, this is the first fMRI study using ICA and a graph theoretic approach to explore modular organization in HCs and SZs during the resting state. SZs showed decreased connectivity strength and clustering coefficient. Community structures of the weighted FNC were detected in both groups using a dynamic tree cut algorithm. Patients showed more and smaller modules compared with controls. Different hubs between the two groups were also identified. These findings suggest that intrinsic communication among temporally coherent brain networks is disrupted in schizophrenia, which may help to understand this brain disorder at the level of connectivity among independent brain components.
Conflict of Interest Statement
The authors declare that the research was conducted in the absence of any commercial or financial relationships that could be construed as a potential conflict of interest.
Acknowledgments
This work was supported by the National Institutes of Health (NIH) grants (R01 EB000840 and 5P20RR021938 PI: Calhoun; R37 MH43775 PI: Pearlson; and R01 MH072681-01 PI: Kiehl).
Footnotes
References
Abou-Elseoud, A., Starck, T., Remes, J., Nikkinen, J., Tervonen, O., and Kiviniemi, V. (2010). The effect of model order selection in group PICA. Hum. Brain Mapp. 31, 1207–1216.
Alexander-Bloch, A. F., Gogtay, N., Meunier, D., Birn, R., Clasen, L., Lalonde, F., Lenroot, R., Giedd, J., and Bullmore, E. T. (2010). Disrupted modularity and local connectivity of brain functional networks in childhood-onset schizophrenia. Front. Syst. Neurosci. 4:147. doi:10.3389/fnsys.2010.00147
Allen, E. A., Erhardt, E. B., Damaraju, E., Gruner, W., Segall, J. M., Silva, R. F., Havlicek, M., Rachakonda, S., Fries, J., Kalyanam, R., Michael, A. M., Caprihan, A., Turner, J. A., Eichele, T., Adelsheim, S., Bryan, A. D., Bustillo, J., Clark, V. P., Feldstein Ewing, S. W., Filbey, F., Ford, C. C., Hutchison, K., Jung, R. E., Kiehl, K. A., Kodituwakku, P., Komesu, Y. M., Mayer, A. R., Pearlson, G. D., Phillips, J. P., Sadek, J. R., Steven, M., Teuscher, U., Thoma, R. J., and Calhoun, V. D. (2011). A baseline for the multivariate comparison of resting-state networks. Front. Syst. Neurosci. 5:2. doi:10.3389/fnsys.2011.00002
Auer, D. P. (2008). Spontaneous low-frequency blood oxygenation level-dependent fluctuations and functional connectivity analysis of the “resting” brain. Magn. Reson. Imaging 26, 1055–1064.
Balenzuela, P., Chernomoretz, A., Fraiman, D., Cifre, I., Sitges, C., Montoya, P., and Chialvo, D. R. (2010). Modular organization of brain resting state networks in chronic back pain patients. Front. Neuroinform. 4:116. doi:10.3389/fninf.2010.00116
Bassett, D. S., Wymbs, N. F., Porter, M. A., Mucha, P. J., Carlson, J. M., and Grafton, S. T. (2011). Dynamic reconfiguration of human brain networks during learning. Proc. Natl. Acad. Sci. U.S.A. 108, 7641–7646.
Bell, A. J., and Sejnowski, T. J. (1995). An information-maximization approach to blind separation and blind deconvolution. Neural Comput. 7, 1129–1159.
Bluhm, R. L., Miller, J., Lanius, R. A., Osuch, E. A., Boksman, K., Neufeld, R. W., Théberge, J., Schaefer, B., and Williamson, P. (2007). Spontaneous low-frequency fluctuations in the BOLD signal in schizophrenic patients: anomalies in the default network. Schizophr. Bull. 33, 1004–1012.
Buckner, R. L., Andrews-Hanna, J. R., and Schacter, D. L. (2008). The brain’s default network: anatomy, function, and relevance to disease. Ann. N. Y. Acad. Sci. 1124, 1–38.
Bullmore, E., and Sporns, O. (2009). Complex brain networks: graph theoretical analysis of structural and functional systems. Nat. Rev. Neurosci. 10, 186–198.
Calhoun, V. D., Adali, T., Pearlson, G. D., and Pekar, J. J. (2001). A method for making group inferences from functional MRI data using independent component analysis. Hum. Brain Mapp. 14, 140–151.
Calhoun, V. D., Liu, J., and Adali, T. (2009). A review of group ICA for fMRI data and ICA for joint inference of imaging, genetic, and ERP data. Neuroimage 45(Suppl. 1), S163–S172.
Cheung, V., Cheung, C., McAlonan, G. M., Deng, Y., Wong, J. G., Yip, L., Tai, K. S., Khong, P. L., Sham, P., and Chua, S. E. (2008). A diffusion tensor imaging study of structural dysconnectivity in never-medicated, first-episode schizophrenia. Psychol. Med. 38, 877–885.
Cole, M. W., Anticevic, A., Repovs, G., and Barch, D. (2011). Variable global dysconnectivity and individual differences in schizophrenia. Biol. Psychiatry 70, 43–50.
Corbetta, M., and Shulman, G. L. (2002). Control of goal-directed and stimulus-driven attention in the brain. Nat. Rev. Neurosci. 3, 201–215.
Cordes, D., Haughton, V. M., Arfanakis, K., Carew, J. D., Turski, P. A., Moritz, C. H., Quigley, M. A., and Meyerand, M. E. (2001). Frequencies contributing to functional connectivity in the cerebral cortex in “resting-state” data. AJNR Am. J. Neuroradiol. 22, 1326–1333.
Craddock, R. C., James, G. A., Holtzheimer, P. E. III., Hu, X. P., and Mayberg, H. S. (2011). A whole brain fMRI atlas generated via spatially constrained spectral clustering. Hum. Brain Mapp. doi:10.1002/hbm.21333. [Epub ahead of print].
Danckert, J., Saoud, M., and Maruff, P. (2004). Attention, motor control and motor imagery in schizophrenia: implications for the role of the parietal cortex. Schizophr. Res. 70, 241–261.
Ding, J. R., Liao, W., Zhang, Z., Mantini, D., Xu, Q., Wu, G. R., Lu, G., and Chen, H. (2011). Topological fractionation of resting-state networks. PLoS ONE 6, e26596. doi:10.1371/journal.pone.0026596
Erhardt, E. B., Rachakonda, S., Bedrick, E. J., Allen, E. A., Adali, T., and Calhoun, V. D. (2011). Comparison of multi-subject ICA methods for analysis of fMRI data. Hum. Brain Mapp. 32, 2075–2095.
Ferrarini, L., Veer, I. M., Baerends, E., van Tol, M. J., Renken, R. J., van der Wee, N. J., Veltman, D. J., Aleman, A., Zitman, F. G., Penninx, B. W., van Buchem, M. A., Reiber, J. H., Rombouts, S. A., and Milles, J. (2009). Hierarchical functional modularity in the resting-state human brain. Hum. Brain Mapp. 30, 2220–2231.
First, M. B., Spitzer, R. L., Gibbon, M., and Williams, J. B. W. (1995). Structured Clinical Interview for DSM-IV Axis I Disorders-Patient Edition (SCID-I/P, Version 2.0). New York: New York State Psychiatry Institute.
Freire, L., Roche, A., and Mangin, J. F. (2002). What is the best similarity measure for motion correction in fMRI time series? IEEE Trans. Med. Imaging 21, 470–484.
Friston, K. J., and Frith, C. D. (1995). Schizophrenia: a disconnection syndrome? Clin. Neurosci. 3, 89–97.
Gillig, P. M., and Sanders, R. D. (2010). Psychiatry, neurology, and the role of the cerebellum. Psychiatry (Edgmont) 7, 38–43.
Guimera, R., and Amaral, L. A. (2005). Cartography of complex networks: modules and universal roles. J. Stat. Mech. 2005, nihpa35573.
He, Y., Wang, J., Wang, L., Chen, Z. J., Yan, C., Yang, H., Tang, H., Zhu, C., Gong, Q., Zang, Y., and Evans, A. C. (2009). Uncovering intrinsic modular organization of spontaneous brain activity in humans. PLoS ONE 4, e5226. doi:10.1371/journal.pone.0005226
Jafri, M. J., Pearlson, G. D., Stevens, M., and Calhoun, V. D. (2008). A method for functional network connectivity among spatially independent resting-state components in schizophrenia. Neuroimage 39, 1666–1681.
Kashtan, N., and Alon, U. (2005). Spontaneous evolution of modularity and network motifs. Proc. Natl. Acad. Sci. U.S.A. 102, 13773–13778.
Kay, S. R., Fiszbein, A., and Opler, L. A. (1987). The positive and negative syndrome scale (PANSS) for schizophrenia. Schizophr. Bull. 13, 261–276.
Kiviniemi, V., Starck, T., Remes, J., Long, X., Nikkinen, J., Haapea, M., Veijola, J., Moilanen, I., Isohanni, M., Zang, Y. F., and Tervonen, O. (2009). Functional segmentation of the brain cortex using high model order group PICA. Hum. Brain Mapp. 30, 3865–3886.
Langfelder, P., Zhang, B., and Horvath, S. (2008). Defining clusters from a hierarchical cluster tree: the dynamic tree cut package for R. Bioinformatics 24, 719–720.
Liang, M., Zhou, Y., Jiang, T., Liu, Z., Tian, L., Liu, H., and Hao, Y. (2006). Widespread functional disconnectivity in schizophrenia with resting-state functional magnetic resonance imaging. Neuroreport 17, 209–213.
Liu, Y., Liang, M., Zhou, Y., He, Y., Hao, Y., Song, M., Yu, C., Liu, H., Liu, Z., and Jiang, T. (2008). Disrupted small-world networks in schizophrenia. Brain 131(Pt 4), 945–961.
Lynall, M. E., Bassett, D. S., Kerwin, R., McKenna, P. J., Kitzbichler, M., Muller, U., and Bullmore, E. (2010). Functional connectivity and brain networks in schizophrenia. J. Neurosci. 30, 9477–9487.
Mason, M. J., Fan, G., Plath, K., Zhou, Q., and Horvath, S. (2009). Signed weighted gene co-expression network analysis of transcriptional regulation in murine embryonic stem cells. BMC Genomics 10, 327. doi:10.1186/1471-2164-10-327
McKeown, M. J., Makeig, S., Brown, G. G., Jung, T. P., Kindermann, S. S., Bell, A. J., and Sejnowski, T. (1998). Analysis of fMRI data by blind separation into independent spatial components. Hum. Brain Mapp. 6, 160–188.
Meunier, D., Achard, S., Morcom, A., and Bullmore, E. (2009a). Age-related changes in modular organization of human brain functional networks. Neuroimage 44, 715–723.
Meunier, D., Lambiotte, R., Fornito, A., Ersche, K. D., and Bullmore, E. T. (2009b). Hierarchical modularity in human brain functional networks. Front. Neuroinform. 3:37. doi:10.3389/neuro.11.037.2009
Meunier, D., Lambiotte, R., and Bullmore, E. T. (2010). Modular and hierarchically modular organization of brain networks. Front. Neurosci. 4:200. doi:10.3389/fnins.2010.00200
Mumford, J. A., Horvath, S., Oldham, M. C., Langfelder, P., Geschwind, D. H., and Poldrack, R. A. (2010). Detecting network modules in fMRI time series: a weighted network analysis approach. Neuroimage 52, 1465–1476.
Newman, M. E. (2006). Modularity and community structure in networks. Proc. Natl. Acad. Sci. U.S.A. 103, 8577–8582.
Onnela, J. P., Saramaki, J., Kertesz, J., and Kaski, K. (2005). Intensity and coherence of motifs in weighted complex networks. Phys. Rev. E Stat. Nonlin. Soft Matter Phys. 71(Pt 2), :065103.
Pan, R. K., and Sinha, S. (2007). Modular networks emerge from multiconstraint optimization. Phys. Rev. E Stat. Nonlin. Soft Matter Phys. 76(Pt 2), :045103.
Pettersson-Yeo, W., Allen, P., Benetti, S., McGuire, P., and Mechelli, A. (2011). Dysconnectivity in schizophrenia: where are we now? Neurosci. Biobehav. Rev. 35, 1110–1124.
Ravasz, E., Somera, A. L., Mongru, D. A., Oltvai, Z. N., and Barabasi, A. L. (2002). Hierarchical organization of modularity in metabolic networks. Science 297, 1551–1555.
Rubinov, M., and Sporns, O. (2010). Complex network measures of brain connectivity: uses and interpretations. Neuroimage 52, 1059–1069.
Salvador, R., Suckling, J., Coleman, M. R., Pickard, J. D., Menon, D., and Bullmore, E. (2005). Neurophysiological architecture of functional magnetic resonance images of human brain. Cereb. Cortex 15, 1332–1342.
Shen, X., Papademetris, X., and Constable, R. T. (2010). Graph-theory based parcellation of functional subunits in the brain from resting-state fMRI data. Neuroimage 50, 1027–1035.
Shirer, W. R., Ryali, S., Rykhlevskaia, E., Menon, V., and Greicius, M. D. (2012). Decoding subject-driven cognitive states with whole-brain connectivity patterns. Cereb. Cortex 22, 158–165.
Smith, S. M., Fox, P. T., Miller, K. L., Glahn, D. C., Fox, P. M., Mackay, C. E., Filippini, N., Watkins, K. E., Toro, R., Laird, A. R., and Beckmann, C. F. (2009). Correspondence of the brain’s functional architecture during activation and rest. Proc. Natl. Acad. Sci. U.S.A. 106, 13040–13045.
Smith, S. M., Miller, K. L., Salimi-Khorshidi, G., Webster, M., Beckmann, C. F., Nichols, T. E., Ramsey, J. D., and Woolrich, M. W. (2011). Network modelling methods for FMRI. Neuroimage 54, 875–891.
Stephan, K. E., Baldeweg, T., and Friston, K. J. (2006). Synaptic plasticity and dysconnection in schizophrenia. Biol. Psychiatry 59, 929–939.
Sui, J., Adali, T., Pearlson, G., Yang, H., Sponheim, S. R., White, T., and Calhoun, V. D. (2010). A CCA+ICA based model for multi-task brain imaging data fusion and its application to schizophrenia. Neuroimage 51, 123–134.
Tzourio-Mazoyer, N., Landeau, B., Papathanassiou, D., Crivello, F., Etard, O., Delcroix, N., Mazoyer, B., and Joliot, M. (2002). Automated anatomical labeling of activations in SPM using a macroscopic anatomical parcellation of the MNI MRI single-subject brain. Neuroimage 15, 273–289.
Van Dijk, K. R., Sabuncu, M. R., and Buckner, R. L. (2012). The influence of head motion on intrinsic functional connectivity MRI. Neuroimage 59, 431–438.
van Os, J., Kenis, G., and Rutten, B. P. (2010). The environment and schizophrenia. Nature 468, 203–212.
Variano, E. A., McCoy, J. H., and Lipson, H. (2004). Networks, dynamics, and modularity. Phys. Rev. Lett. 92, 188701.
Vincent, J. L., Kahn, I., Snyder, A. Z., Raichle, M. E., and Buckner, R. L. (2008). Evidence for a frontoparietal control system revealed by intrinsic functional connectivity. J. Neurophysiol. 100, 3328–3342.
White, T., Moeller, S., Schmidt, M., Pardo, J. V., and Olman, C. (2011). Evidence for intact local connectivity but disrupted regional function in the occipital lobe in children and adolescents with schizophrenia. Hum. Brain Mapp. doi:10.1002/hbm.21321. [Epub ahead of print].
Yu, Q., Sui, J., Rachakonda, S., He, H., Gruner, W., Pearlson, G., Kiehl, K. A., and Calhoun, V. D. (2011). Altered topological properties of functional network connectivity in schizophrenia during resting state: a small-world brain network study. PLoS ONE 6, e25423.
Zalesky, A., Fornito, A., Seal, M. L., Cocchi, L., Westin, C. F., Bullmore, E. T., Egan, G. F., and Pantelis, C. (2010). Disrupted axonal fiber connectivity in schizophrenia. Biol. Psychiatry 69, 80–89.
Appendix
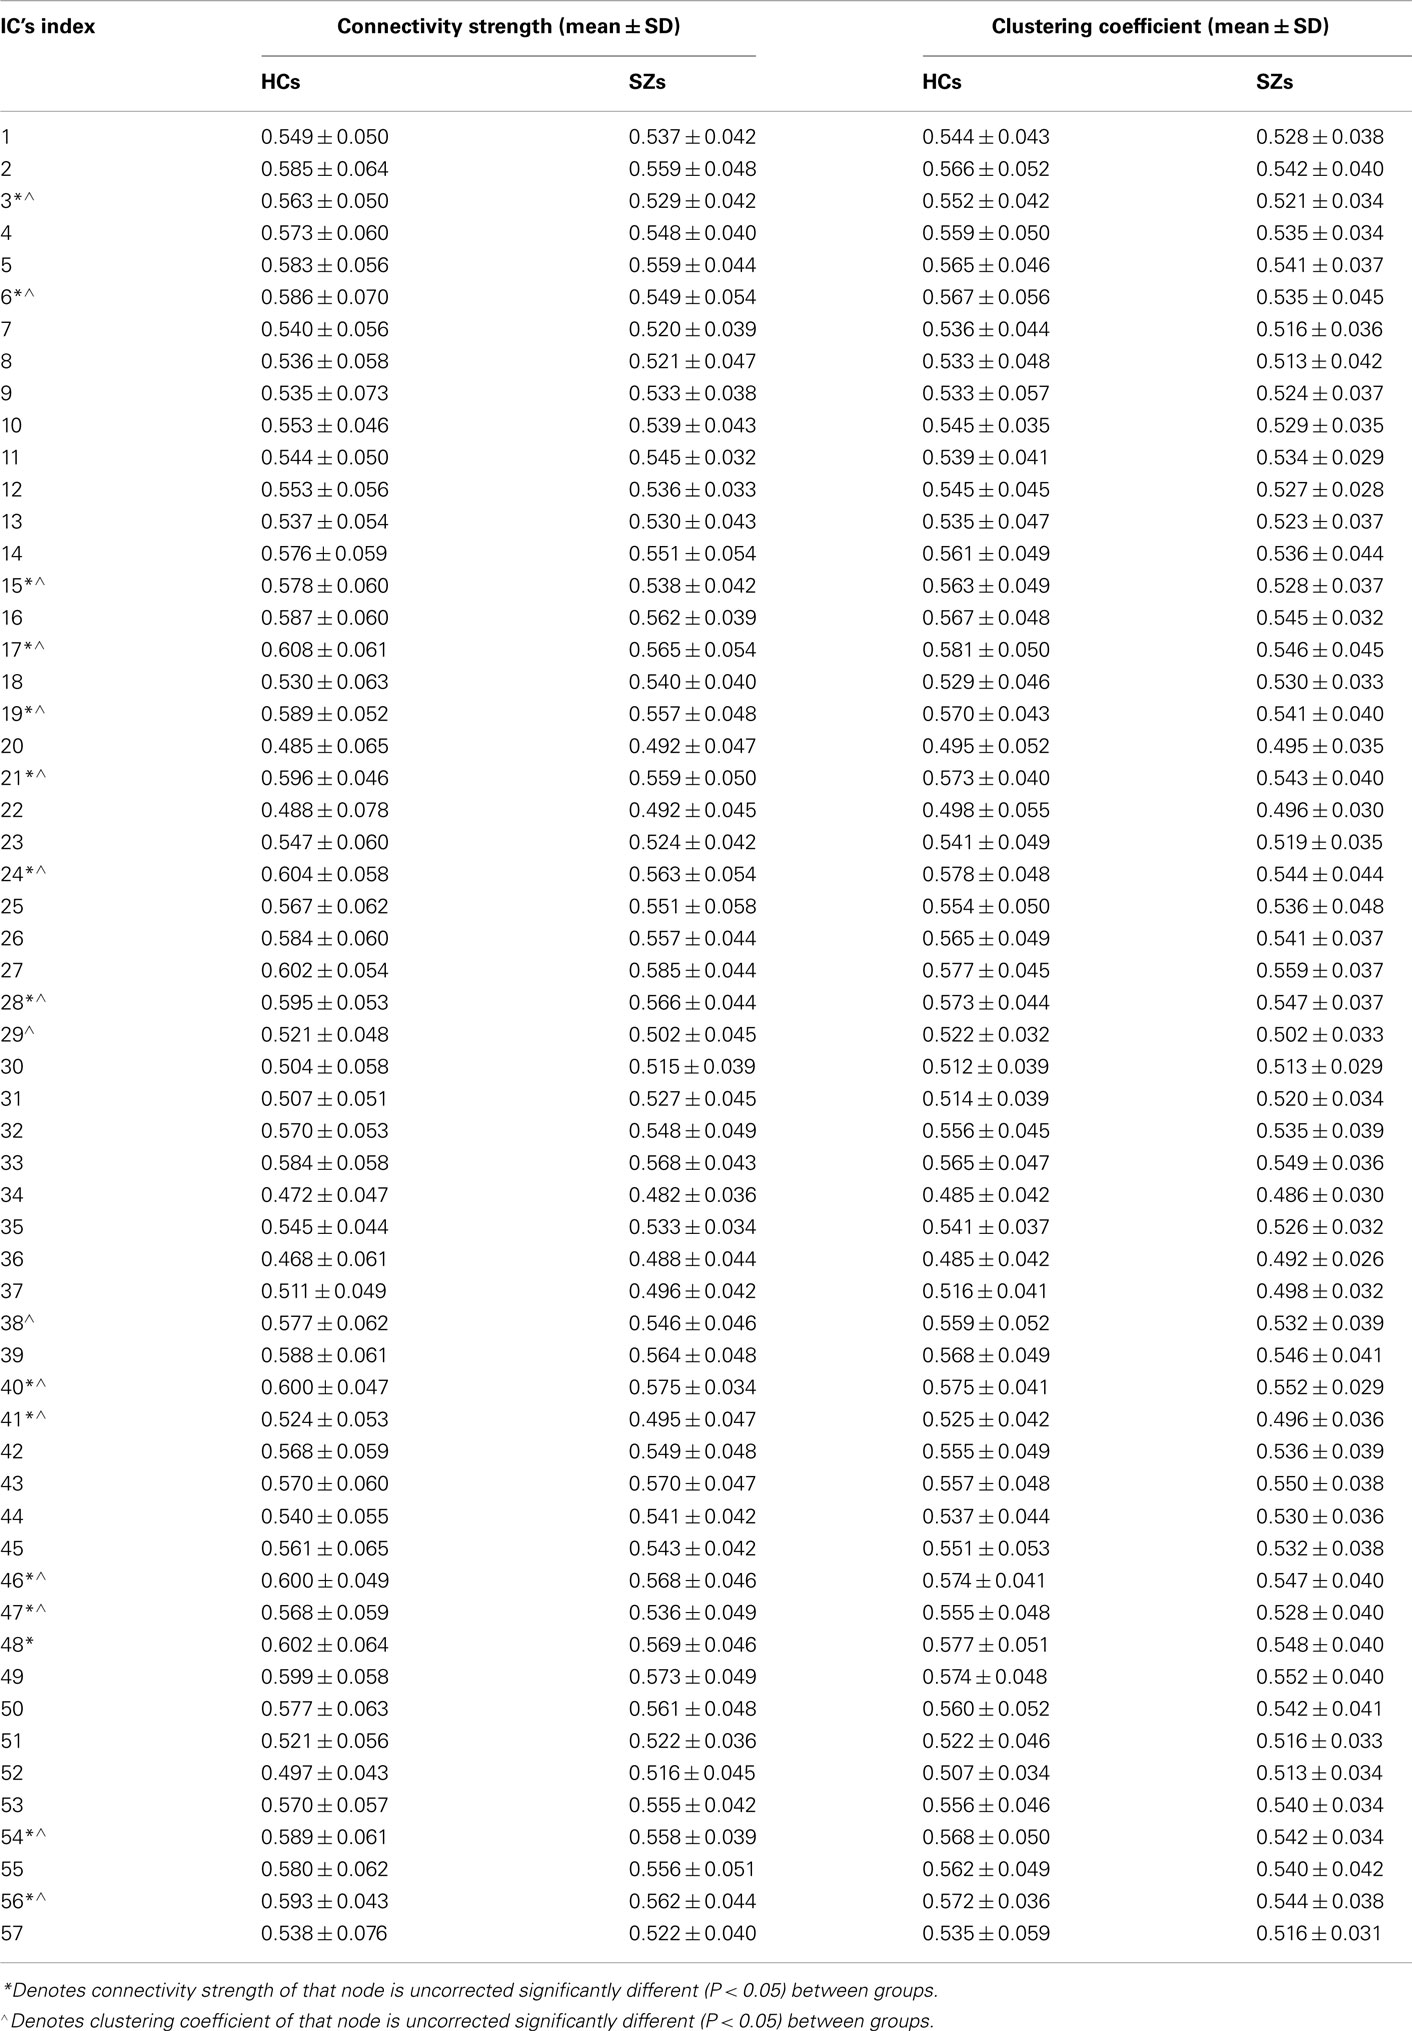
Table A1. Connectivity strength and clustering coefficient of each individual node in HCs and SZs.
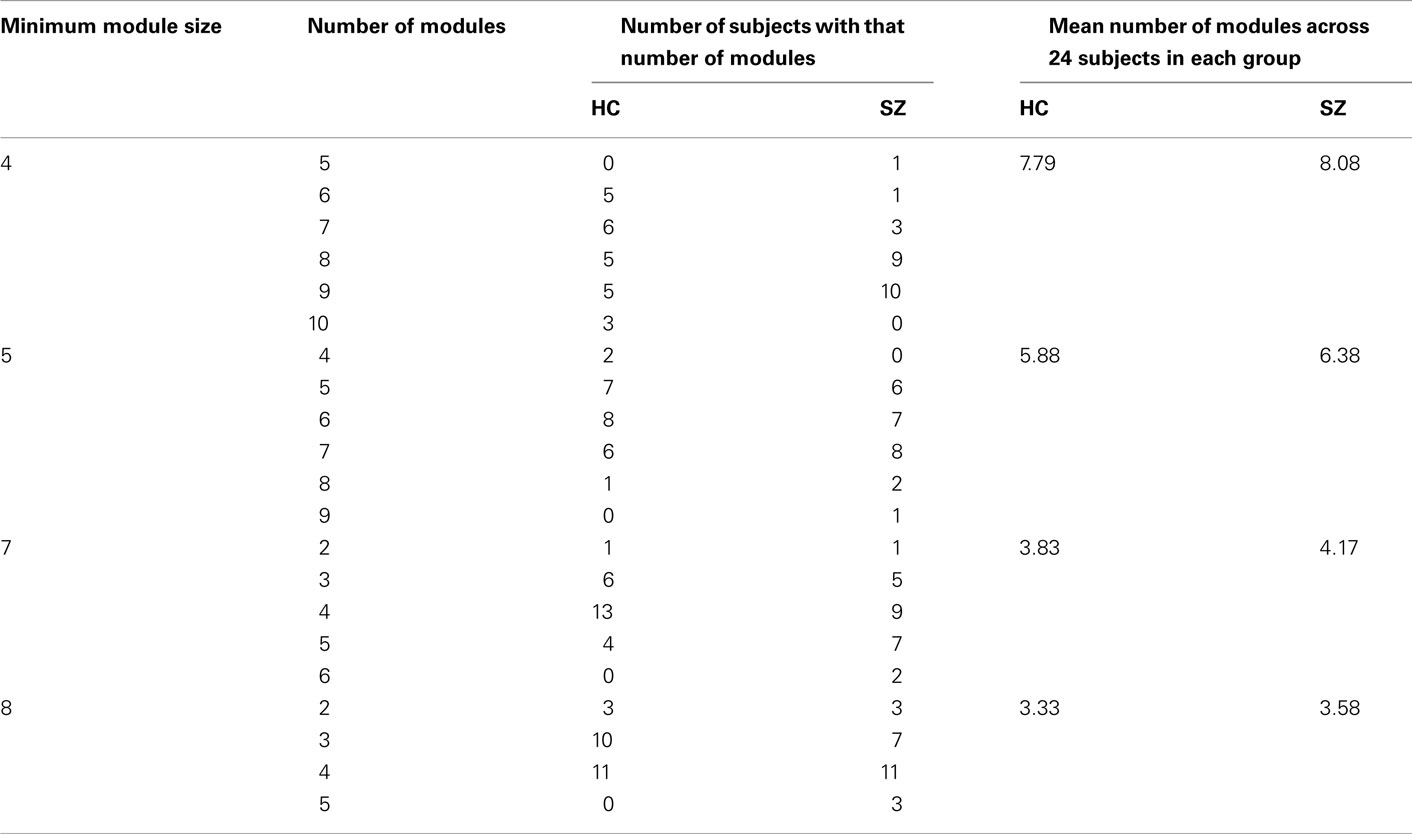
Table A2. Number of modules for individuals when using different minimum module size.
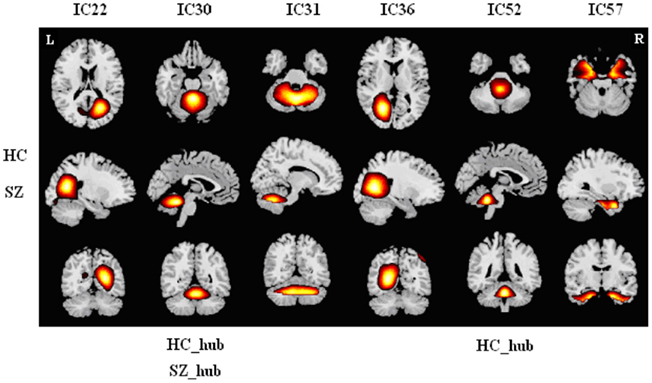
Figure A1. Spatial maps (z-score maps, same in Figures A2–A6) of components in module I for HCs and SZs. Hubs of this module in each group are labeled. Each column shows one component in axial, sagittal, and coronal views. In this module, both groups have six common components including three cerebellar networks, two occipital networks, and one temporal network. We designated this module as “cerebellar–occipital module” (C–O Module). Two cerebellar components are hubs in HCs and one cerebellar component is hub in SZs.
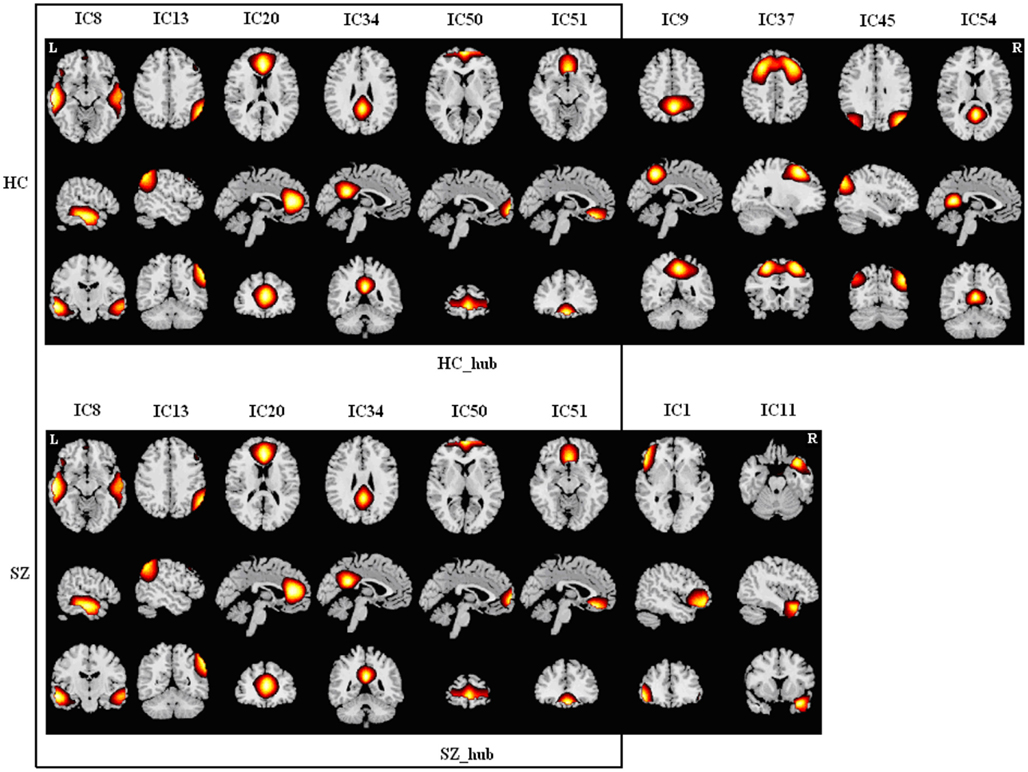
Figure A2. Spatial maps of components in module II for HCs (upper) and SZs (lower). Hubs of each module are labeled. Each column shows one component in axial, sagittal, and coronal views. There are six common components [in the box, most of which are default mode network (DMN) areas] between the groups. This module was designated as “DMN Module.” HCs have another four networks which are also loosely characterized as DMN regions, whereas SZs have another two networks including one frontal component and one temporal component. HCs and SZs have the common frontal hub in this module.
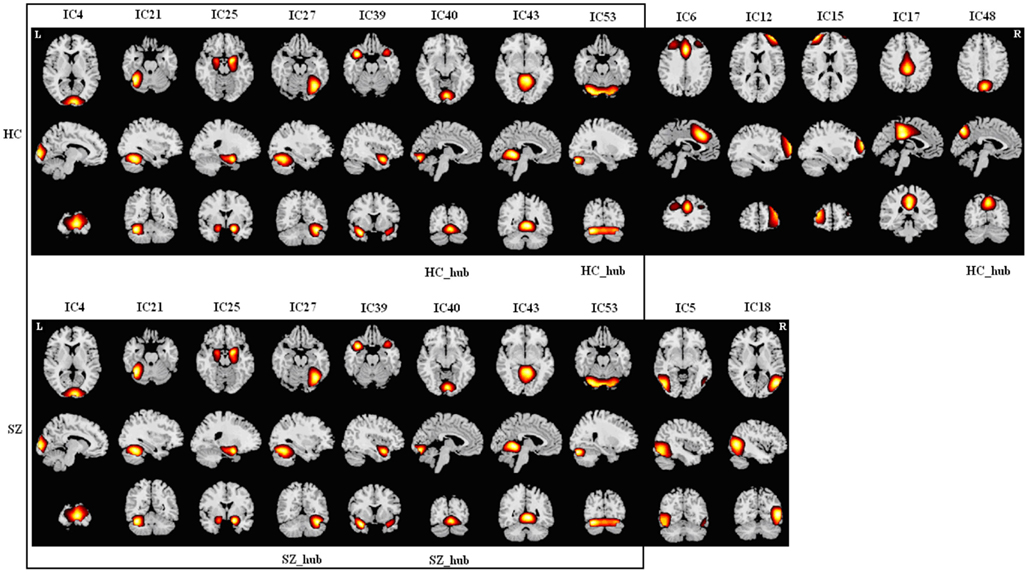
Figure A3. Spatial maps of components in module III for HCs (upper) and SZs (lower). Hubs of this module in each group are labeled. Each column shows one component in axial, sagittal, and coronal views. There are eight common components (in the box) including three occipital components, three cerebellar components, one parahippocampal component, and one temporal component. HCs have five additional components including two frontal components, two cingulum components, and one precuneus component. SZs have two additional components including one occipital component and one temporal component. As the components of this module in HCs represent regions distributed across almost the whole brain, we designated this module as “Global Module” (G1 Module). There are three hubs in HCs and two hubs in SZs.
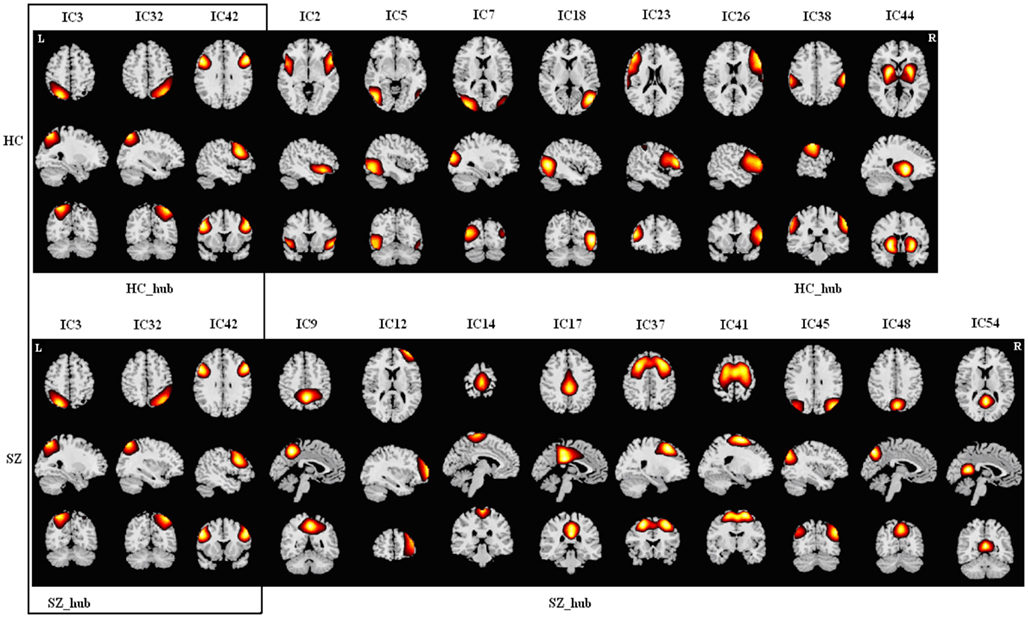
Figure A4. Spatial maps of components in module IV for HCs (upper) and SZs (lower). Hubs of this module in each group are labeled. Each column shows one component in axial, sagital, and coronal views. There are three common components (in the box) including two parietal components and one frontal component. HCs have another eight components including two frontal components, two occipital components, one temporal component, one central component, one putamen component, and one temporal-frontal component. SZs have another nine components including three frontal components, three precuneus component, one angular component, one cingulum component, and one central component. As most of the components of this module in HCs are from attention network, we designated this module as “Attention Module” (A Module). There are two different hubs in this module for the two groups.
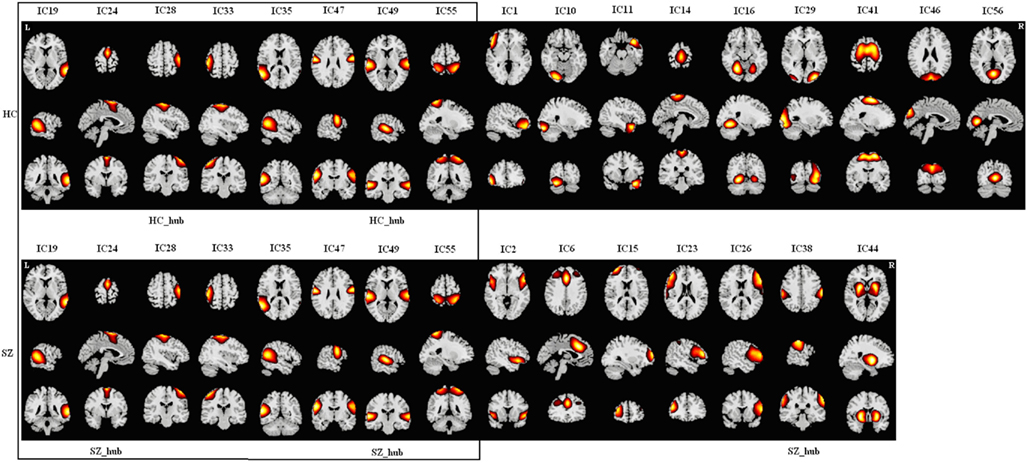
Figure A5. Spatial maps of components in module V for HCs (upper) and SZs (lower). Hubs of this module in each group are labeled. Each column shows one component in axial, sagittal, and coronal views. There are eight common components (in the box) including three temporal components, four sensory motor components, and one parietal component. HCs have another nine components including two cerebellar components, three occipital components, one temporal component, one central component, one motor component, and one frontal component. SZs have another seven components including one putamen component, one temporal-frontal component, one central component, one cingulum component, and three frontal components. As the components of this module in HCs are distributed across almost the whole brain, we designated this module as “Global Module” (G2 Module) as well. There are two hubs in HCs and three hubs in SZs.
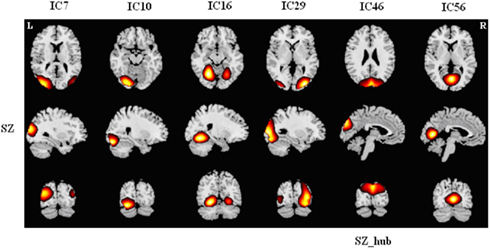
Figure A6. Spatial maps of brain components in module VI for SZs. Hub of this module is labeled. Each column shows one component in axial, sagittal, and coronal views. This module was designated as “occipital module” (O Module) because all the components are centered over occipital cortex. For HCs, occipital components were distributed across other modules.
Keywords: functional network connectivity, ICA, modularity, R-fMRI, schizophrenia
Citation: Yu Q, Plis SM, Erhardt EB, Allen EA, Sui J, Kiehl KA, Pearlson G and Calhoun VD (2012) Modular organization of functional network connectivity in healthy controls and patients with schizophrenia during the resting state. Front. Syst. Neurosci. 5:103. doi: 10.3389/fnsys.2011.00103
Received: 02 November 2011; Paper pending published: 16 November 2011;
Accepted: 19 December 2011; Published online: 10 January 2012.
Edited by:
Detlef H. Heck, University of Tennessee Health Science Center, USAReviewed by:
David M. Cole, Imperial College London, UKMatthew Scoggins, St. Jude Childrens’ Research Hospital, USA
Copyright: © 2012 Yu, Plis, Erhardt, Allen, Sui, Kiehl, Pearlson and Calhoun. This is an open-access article distributed under the terms of the Creative Commons Attribution Non Commercial License, which permits non-commercial use, distribution, and reproduction in other forums, provided the original authors and source are credited.
*Correspondence: Qingbao Yu, The Mind Research Network, 1101 Yale Blvd NE, Albuquerque, NM 87106, USA. e-mail: qyu@mrn.org