1
Department of Physiology, University of California, San Francisco, CA, USA
2
School of Biomedical Sciences, The University of Queensland, Brisbane, Australia
3
Queensland Brain Institute, The University of Queensland, Brisbane, Australia
We have carried out a Gal4 enhancer trap screen in zebrafish, and have generated 184 stable transgenic lines with interesting expression patterns throughout the nervous system. Of these, three display clear expression in the tectum, each with a distinguishable and stereotyped distribution of Gal4 expressing cells. Detailed morphological analysis of single cells, using a genetic “Golgi-like” labelling method, revealed four common cell types (superficial, periventricular, shallow periventricular, and radial glial), along with a range of other less common neurons. The shallow periventricular (PV) and a subset of the PV neurons are tectal efferent neurons that target various parts of the reticular formation. We find that it is specifically PV neurons with dendrites in the deep tectal neuropil that target the reticular formation. This indicates that these neurons receive the tectum’s highly processed visual information (which is fed from the superficial retinorecipient layers), and relay it to premotor regions. Our results show that the larval tectum, both broadly and at the single cell level, strongly resembles a miniature version of its adult counterpart, and that it has all of the necessary anatomical characteristics to inform motor responses based on sensory input. We also demonstrate that mosaic expression of GFP in Gal4 enhancer trap lines can be used to describe the types and abundance of cells in an expression pattern, including the architectures of individual neurons. Such detailed anatomical descriptions will be an important part of future efforts to describe the functions of discrete tectal circuits in the generation of behavior.
One of the fundamental challenges facing neuroscience is to untangle the brain’s vastly complex connectivity and describe how individual cells and connections generate behaviour. Traditionally, this issue has been difficult to address at the level of individual cell types. This is because techniques for describing the structures of neurons (such as Golgi staining) do not generally allow for the neurons’ functions to be addressed. Conversely, approaches for assessing function (such as ablations or fMRI) operate at the level of brain regions rather than distinct types of neuron. As a result, there has been a great effort to develop genetically targeted means of observing and manipulating neurons (reviewed by Luo et al., 2008
). These tools, when deployed properly, will allow for the mapping and functional characterization of brain circuits with unprecedented detail.
The Gal4/UAS system has long been an important tool for researchers in a variety of model systems, particularly Drosophila (reviewed in Elliott and Brand, 2008
). The system is based on the yeast transcription factor Gal4. In cells where the Gal4 gene is expressed, the Gal4 protein targets its Upstream Activating Sequence (UAS), thus driving expression of any gene linked to a UAS element. As a result, animals carrying both transgenes will have expression of a chosen protein (with the gene encoding it linked to UAS) in a defined pattern (determined by the enhancer linked to the Gal4 gene). Since the same Gal4 line can be crossed to any existing UAS line, a researcher can express a variety of different genes in an expression pattern of interest, learning something different each time about its structure or function. In Drosophila, such analyses have included transsynaptic tracing (Yoshihara et al., 1999
), calcium imaging (Wang et al., 2003
, 2004
; Suh et al., 2004
), observation of neurotransmitter release (Ng et al., 2002
), and the silencing (Sweeney et al., 1995
; Kitamoto, 2001
) and activation (Schroll et al., 2006
; Zhang et al., 2007
) of neural circuits. These studies and others have contributed greatly to our understanding of activity in the Drosophila nervous system, and how the functions of particular neurons contribute to the generation of behavior.
Over the past several years, efficient transgenesis techniques based on transposons (Kawakami et al., 2000
; Davidson et al., 2003
; Miskey et al., 2003
; Kawakami, 2007
), meganucleases (Thermes et al., 2002
), and virally-mediated integration (Ellingsen et al., 2005
) have been developed, making the generation of vast numbers of transgenic lines possible. A major use of these transgenesis techniques has been enhancer trapping (ET), in which a transgene linked to a basal promoter is inserted randomly into the genome. In cases where the transgene inserts in or near endogenous enhancer elements, it is expressed in a pattern determined by those enhancers. The initial ET and gene trap (GT) screens in zebrafish used genes for fluorophores in their trapping constructs (Balciunas et al., 2004
; Kawakami, 2004
; Parinov et al., 2004
; Ellingsen et al., 2005
; Kotani et al., 2006
), while more recent screens have involved the insertion of the potent Gal4 derivatives Gal4-VP16, Gal4FF, KalTA4, or Gal4-NFκB (collectively referred to as “Gal4” here) (Davison et al., 2007
; Scott et al., 2007
; Asakawa et al., 2008
; Distel et al., 2009
; Ogura et al., 2009
). While ET screens report on regulatory elements regardless of whether or not the trapping construct has inserted in a gene, the output from GT screens is biased for insertions in genes, and GT is therefore, a potentially potent approach for mutagenesis. ET and GT screens to date have resulted in the production of several hundred zebrafish lines expressing Gal4 in restricted patterns in the CNS. Given the flexibility of the Gal4/UAS system, where various UAS-linked transgenes can be expressed in these patterns, these Gal4 ET and GT lines represent an excellent resource for future investigations into the development, physiology, anatomy, and function of a wide array of tissues (reviewed in Asakawa and Kawakami, 2008
; Halpern et al., 2008
; Scott, 2009
).
The use of Kaede, a photoconvertible fluorophore (Ando et al., 2002
), has allowed for the tracing of axons emanating from groups of neurons (Scott et al., 2007
), while individual neurons have been described using the reversible fluorophore Dronpa (Aramaki and Hatta, 2006
), and a combination of the Gal4/UAS and Cre/loxP systems (Sato et al., 2007
). A few early studies have addressed the functions of Gal4-expressing neuronal subpopulations. These include the expression of tetanus toxin light chain (Asakawa et al., 2008
) and light-gated glutamate receptor (Szobota et al., 2007
), as well as halorhodopsin and channelrhodopsin (Arrenberg et al., 2009
) to silence or conditionally activate circuits involved in simple behaviors, such as swimming, eye movements, or escape.
While this work provides important foundations for future studies, the full potential of this approach has yet to be realized. A vast assortment of genetically-encoded constructs have recently been developed to observe and manipulate activity in neurons (reviewed in Luo et al., 2008
), and these will provide powerful tools for discerning the behavioral importance of various circuits in the zebrafish nervous system. A true linking of structure to function, however, requires that the detailed anatomy of the circuit being manipulated is known. Here, we present the full output of a Gal4 ET screen, the pilot of which has previously been described (Scott et al., 2007
). We then use three lines from the screen to describe the structure and connectivity of the larval tectum.
The optic tectum of zebrafish has recently received considerable interest from neuroscientists studying the development and function of the visual system. The tectum’s well-documented function as the major visual processing center, combined with the promise of genetic access, make it particularly attractive to investigations of axon guidance, synaptic specification, layer formation, and topographic mapping (Stuermer, 1988
; Baier et al., 1996
; Hua et al., 2005
; Xiao et al., 2005
; Aramaki and Hatta, 2006
; Campbell et al., 2007
; Xiao and Baier, 2007
; Gosse et al., 2008
). In addition, the tectum’s superficial position beneath a transparent skin offers the opportunity to carry out optical recording of neuronal activity (Niell and Smith, 2005
; Ramdya et al., 2006
; Sumbre et al., 2008
) and patch-clamp electrophysiology in vivo (Smear et al., 2007
). This latter work has produced detailed information on the tuning, receptive fields, and network properties of tectal neurons and the effects of activity manipulations on their development. However, our knowledge of the cellular anatomy of the zebrafish tectum is still limited. In particular, there does not exist a catalog of morphological cell types or a description of connections between the tectum and other brain areas in zebrafish larvae.
To a large extent, previous studies have relied on cell type classifications and connectivity maps derived from anatomical work in adult goldfish and other teleosts (Meek and Schellart, 1978
; Meek, 1981a
,b
; Stevenson and Yoon, 1982
; Kinoshita and Ito, 2006
; Kinoshita et al., 2006
). While such extrapolations have frequently turned out to be valid, one also expects there to be important differences between fish species and between adult and larval stages. A detailed description of tectal cell types, their morphologies and laminar specificities, and an atlas of the tectum’s input and output pathways will greatly facilitate future analyses of the zebrafish visual system and serve as a baseline for studies that employ experimental perturbations, such as mutations or transgenic manipulations in this model system.
Here we have developed a genetic labeling kit that allows us to visualize the morphologies of single neurons among “enhancer-trapped” subpopulations of tectal neurons. We demonstrate that each of the three lines drives expression in a unique, albeit overlapping profile of tectal cells. We also show that layered input from retinal axons is matched by lamina-specific branching patterns of tectal dendrites, suggesting a great deal of synaptic specificity in the retinotectal system. Finally, we show that output neurons from the tectum are biased toward receiving their input from deeper tectal layers, indicating that they are relaying integrated visual information, or information from non-visual modalities, to motor centers elsewhere in the brain. The type of anatomical analysis presented here for the tectum will also be applicable to other brain areas for which Gal4 lines exist. Such analyses should provide an anatomical grounding for future studies into the roles of enhancer-trapped neurons in generating behavior.
Construction and Injection of ET Plasmids
The construction of hsp1.5:Gal4 and hsp0.6:Gal4 plasmids has been described (Scott et al., 2007
). The E1b:Gal4-VP16 plasmid was made by destroying the NotI (position 5836) and KpnI (position 657) sites of pT2KXIGΔin (Urasaki et al., 2006
), and inserting an I-SceI site into the ApaI (location 3070) site upstream of the HSP70 promoter. We then replaced HSP70 with a synthetic I-SceI, PI-PspI, E1b, KpnI element by cloning it into the I-SceI and KpnI sites of the modified pT2KXIGΔin. The E1b sequence is (5′GGGTATATAATGGATCCCATCGCGTCTCAGCCTCAC3′). The mouse cFos promoter (5′CCAGTGACGTAGGAAGTCCATCCATTCACAGCGCTTCTATAAAGGCGCCAGCTGAGGCGCCTACTACTCCAACCGCGACTGCAGCGAGCAACT3′) was generated by linking synthetic oligonucleotides and inserting the product into the ApaI and KpnI sites of the E1b:Gal4-VP16 vector, thus replacing E1b to create cFos:Gal4-VP16. Injection of plasmids for transgenesis and screening for expression were performed as described (Scott et al., 2007
).
Specimen Preparation and Microscopy
Preparation of live larvae, confocal microscopy, and three-dimensional reconstruction of individual neurons were performed as described (Xiao and Baier, 2007
). For sections, anesthetized larvae were fixed overnight in 4% paraformaldehyde, embedded in O.C.T. compound (Tissue-Tec), and cut into 12-micron cryostat sections. Sections were dried on slides and mounted in Fluoromount medium (EMS, Hatfield, PA, USA). Sections were optically sectioned and processed as described (Xiao and Baier, 2007
). Color channel separation and the construction and rotation of Z-projections were performed using ImageJ version 1.38 software (National Institutes of Health).
All experiments were carried out in accordance with relevant regulatory standards for animal ethics, and were approved by institutional animal care committee at the University of California-San Francisco and the University of Queensland Animal Welfare Unit.
Tol2-Assisted Enhancer Trapping Generated 184 Gal4 Lines
We used four different enhancer-trap constructs, each based on pT2KXIGΔin, which is derived from the Tol2 transposable element (Urasaki et al., 2006
; Scott et al., 2007
; Asakawa et al., 2008
). These constructs carried a fusion of Gal4 and the transcriptional activator VP16 and differed only in the 5’ basal promoter. The promoters used were hsp1.5 (the 1.5-kb heat shock cognate 70-kd protein promoter), hsp0.6 (a truncated hsp1.5) (Scott et al., 2007
), E1b (Scheer and Campos-Ortega, 1999
), and c-fos (Dorsky et al., 2002
). Fish of the TLN wildtype strain, injected at the single-cell stage with one of these four constructs were raised to adulthood (F0) and screened for germline transformation by crossing them to carriers from the UAS:Kaede line, also maintained in the TLN background (Scott et al., 2007
). TLN fish are particularly suitable for live imaging of the CNS, because they lack melanophores due to mutation of mitfa (Lister et al., 1999
). F1 progeny (>100) of each F0 founder were observed for Kaede expression at 3 and 5 days post fertilization (dpf) and imaged with a confocal microscope, as previously described (Scott et al., 2007
). F1 larvae showing interesting expression patterns (see below) were raised to establish a line. Composite patterns, resulting from the occasional combination of two or more enhancer traps in one F1 fish, were resolved by segregation in the subsequent generations.
In total, we injected and screened 707 potential F0 founders. Of these, 252 F0 fish (36%) showed germline transformation, generating 502 distinct Gal4 patterns. The higher number of patterns than founders resulted from individual founders carrying multiple insertions. These multiple insertions were suspected based on distinct expression in different F1 larvae within a clutch, and were confirmed by the independent segregation of the patterns in subsequent generations. Based on anatomical criteria alone, we raised progeny for about a third (184) of the observed patterns. As this project progressed, we reduced the number of stably maintained lines further to 156. The criteria for keeping or discarding a Gal4 pattern were guided by our interest in specific neural circuits. We generally discarded very broad, unusually variegated, weak, or repetitive patterns. At least a third of the lines show some degree of variegation when crossed to the UAS:Kaede reporter (stochastic absence of Kaede expression within the broader domain of the Gal4 driver). We also observed that even highly consistent Gal4 patterns may drive some UAS transgenes incompletely, possibly due to variegation from the chromosomal environment of that particular UAS insertion, or to methylation of the UAS insertion (Goll et al., 2009
). The screen results are summarized in Table 1
. About 120 Gal4 lines are currently available from the Zebrafish International Resource Center
(ZIRC) in Eugene (Oregon, USA) or from the authors’ labs.
Two-thirds of the lines were generated with the c-fos basal promoter, because collectively the c-fos patterns showed the lowest non-specific background expression in muscle, a problem shared by many ET lines previously reported (Scott et al., 2007
; Asakawa and Kawakami, 2008
; Asakawa et al., 2008
). The E1b promoter exhibited a very strong bias for expression in cranial ganglia – most patterns generated with the E1b:Gal4-VP16 construct looked similar to s1102t (Figure 1
). We therefore stopped using this promoter and kept only two of the E1b lines. In terms of integration efficiency, the four promoters gave very similar results.
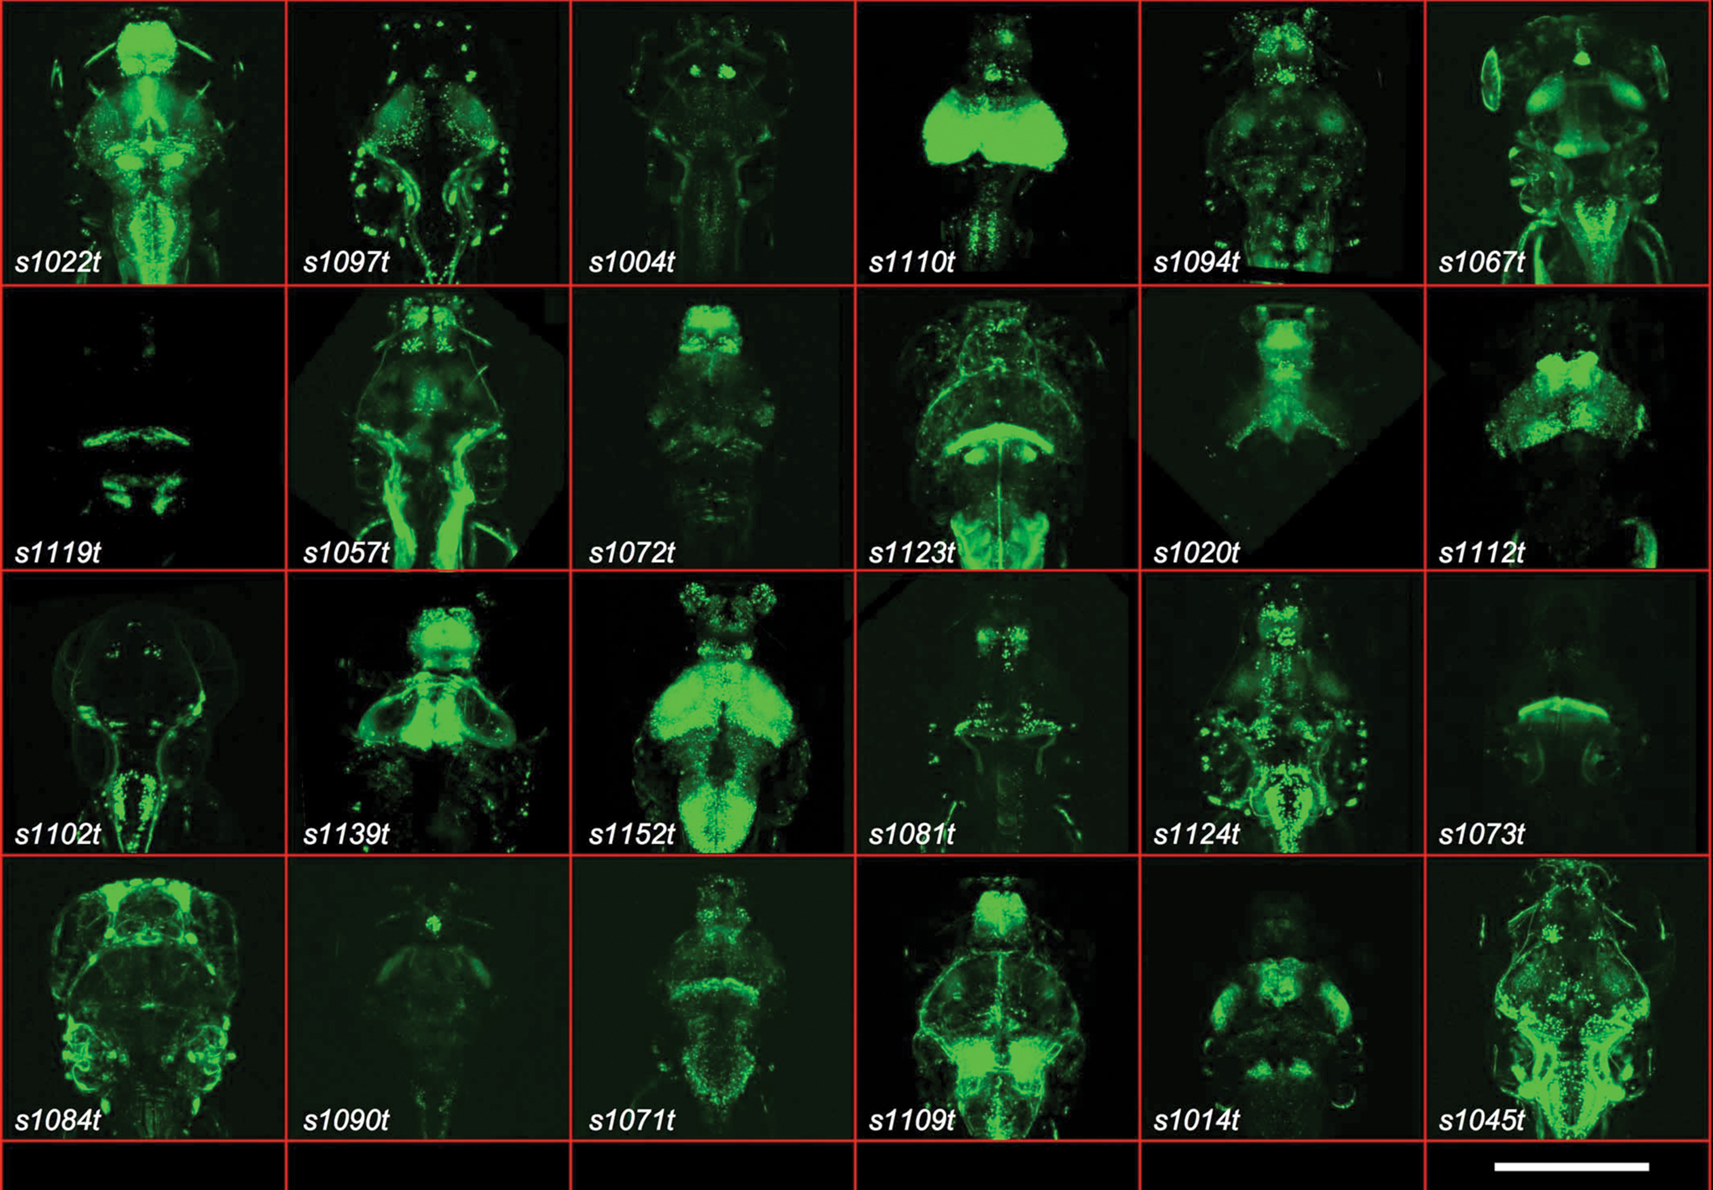
Figure 1. Gal4 expression patterns from the ET screen. Twenty-four examples are shown of expression patterns from the ET screen, with the line number indicated. All are dorsal images of 5- or 6-dpf larvae. The scale bar (bottom right) indicates roughly 200μm. All larvae carry the indicated Gal4 insertion and UAS:Kaede.
Gal4 Lines Label Every Major Brain Area and Many Different Cell Types in the Developing CNS
We discovered Gal4-driven labelling patterns in every major subdivision of the zebrafish nervous system, including the olfactory epithelium, telencephalon and olfactory bulb, pineal and habenular complex, pretectum, hypothalamus, retina, optic tectum, cerebellum, non-cerebellar hindbrain, and spinal cord. Figure 1
shows a selection of the stable labelling patterns generated in this screen. A summary of the stable zebrafish lines is shown in Table 2
. Images and preliminary annotations of most lines are available online at http://www.zfin.org/
. Hyperlinks to the corresponding images are embedded in the allele names (first column) of Table 2
.
Our Gal4 drivers are very rarely restricted to single cell types. Although we have made no systematic attempt to identify the genomic insertion sites of our enhancer traps, the expression of Gal4 probably matches the expression of the trapped genes (Balciunas et al., 2004
; Parinov et al., 2004
; Ellingsen et al., 2005
). Large-scale RNA localization studies, such as the Allen Brain Atlas and the gene expression atlas at zfin.org confirm that most genes are expressed at multiple locations in the CNS. In addition, Kaede protein is known to be extremely stable (Ando et al., 2002
) and may be present in cells days after gene transcription has subsided. Therefore, some patterns may reflect the developmental history of the labelled cells in addition to their acute expression profile. In the future, this could be disambiguated for lines of interest by converting Kaede and looking for freshly translated green Kaede. Together with unwanted background expression in muscle, which is observed in about a third of the lines and is probably related to the Tol2 sequence itself (Scott et al., 2007
; Asakawa et al., 2008
), multi-area labelling will limit the usefulness of many of these Gal4 lines for tissue-specific transgene expression.
Tectal Expression Patterns from the ET Screen
Among the 511 expression patterns that we observed and the 184 that we initially maintained, 13 showed labelled cells in the tectum and three had strong and fairly specific expression in the tectum. We used these lines to perform a detailed analysis of the structure, connectivity, and cellular composition of the larval tectum. This analysis was also intended to provide proof of principle for using Gal4/UAS tools to describe neuroanatomy in zebrafish. As such, it made sense to start with a structure like the tectum that is already coarsely characterized, and that is readily optically accessible.
The three lines that we have analyzed are s1013t, s1038t, and s1156t. Although all three have pronounced tectal expression, there are clear distinctions among the patterns when viewed using a UAS:Kaede transgene in combination with the Gal4 insertions (Figure 2
).
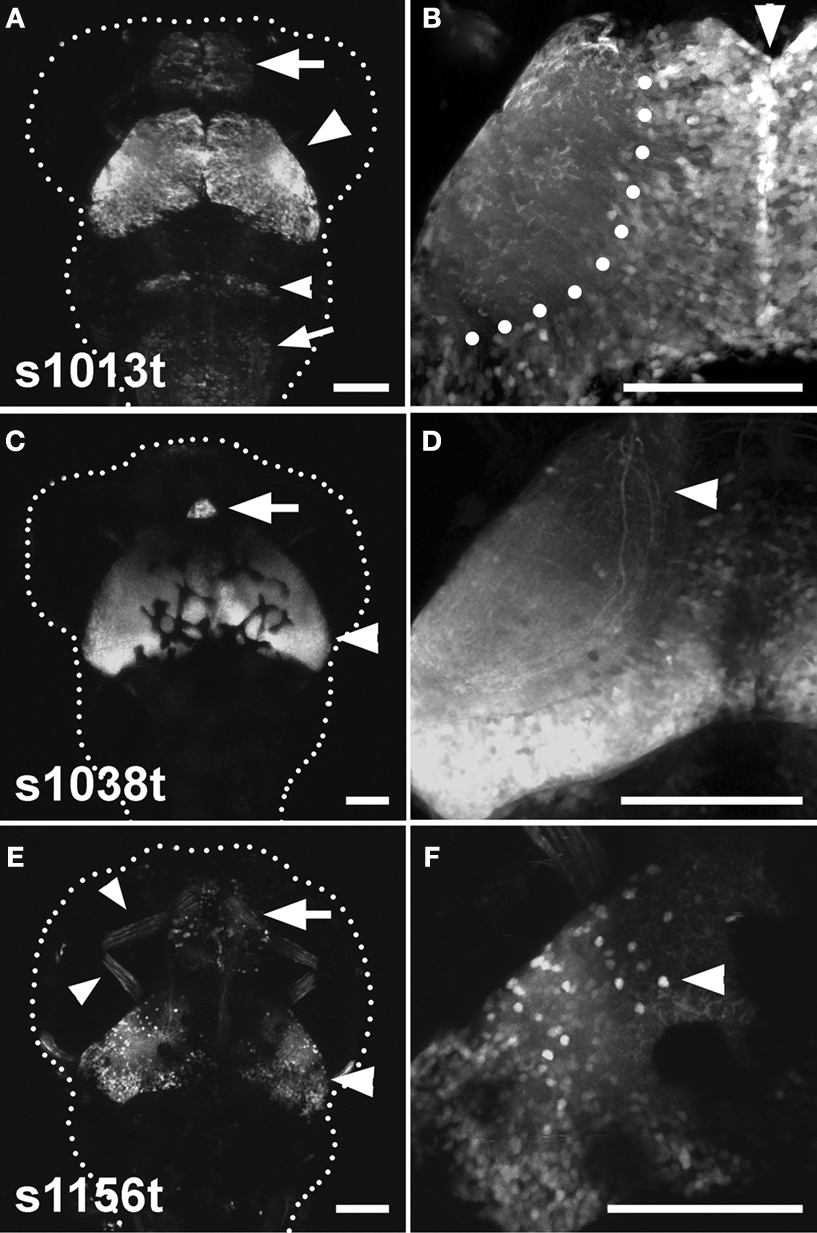
Figure 2. Three tectal lines arising from the ET screen. (A), (C), and (E) show dorsal images of 5-dpf larvae, anterior at the top. A dotted line indicates the approximate boundary of the animal. (B), (D) and (F) contain corresponding high-magnification images of the left tectum in the same ET line. (A) Shows the s1013t expression pattern. Expression is seen primarily in the tectum (arrowhead), but also in the pallium (arrow), the hindbrain (small arrowhead) and the medulla oblongata (small arrow). Expression in the tectum is strong and spread evenly across the A-P and M-L axes (B). The midline (arrowhead) and boundary between the tectal cell body layer and neuropil (dotted line) are indicated in (B). s1038t (C) has strong expression in the tectum (arrowhead) and pineal (arrow). Expression in s1038t is strongest in the posterior tectum (D), and axons from s1038t-positive neurons are seen extending beyond the tectum (arrowhead). (E) Shows s1156t expression in the tectum (arrowhead), forebrain (arrow), and ocular muscles (small arrowheads). As compared to the other lines, s1156t is expressed in a smaller subset of tectal neurons (F), and is prominent in cell bodies located at the superficial surface of the tectal neuropil (arrowhead). Scale bars in all panels indicate 100μm. Animals are heterozygous both for the indicated Gal4 insertion and UAS:Kaede.
Expression in s1013t is strong and uniformly distributed across the tectum, and this line also has weaker Gal4 expression in other regions of the CNS (Figures 2
A,B). s1038t shows strong expression in the tectum and the pineal organ, and tectal expression is strongest in the posterior of the tectum, with little or no fluorescence in the anterior tectum (Figure 2
C). The tectal neurons in s1038t give rise to neurites that extend ventrally out of the tectum to targets elsewhere in the CNS (Figure 2
D). The tectum is less strongly labelled in s1156t, and Gal4 expression is most prominent in the lateral tectum, especially in neurons with their cell bodies at the superficial edge of the tectum (Figures 2
E,F). This line also shows Gal4 expression in the forebrain, ocular muscles (Figure 2
E), and the musculature of the trunk (not shown).
Neural Targets of Tectal Efferent Neurons
Among the three lines that we have described, only s1038t has obvious neurites extending away from the tectum (Figure 2
D). Based on the structure and termination points of these neurites, we believe that they are the axons of tectal neurons. In order to determine the likely targets of these axons, we fixed, sectioned, and stained larvae, and observed the locations of the axons in a range of positions along the anterior/posterior (A/P) axis (Figure 3
). We found that these axons extend ventrally away from the cell bodies in the PV layer of the tectum, following the boundary between the PV layer and the tectal neuropil. Once ventral to the tectum, some axons turn rostrally to terminate near the midline in the inferior Raphe nucleus (Figure 3
B). Others turn caudally and then dorsally to reach the superior reticular formation (Figure 3
D) or extend further caudally to the medulla oblongata (Figure 3
E). Given these projections’ length and simplicity and the fact that they are known to be axons in adult fish (Luiten, 1981
; Pérez-Pérez et al., 2003
; Kinoshita et al., 2006
; Luque et al., 2008
), it seems safe to assume that they represent the efferent output from the larval tectum. In the future, this assumption could be confirmed by crossing s1038t to transgenic lines for targeted fluorophores such as UAS:synaptophysin-GFP (Meyer and Smith, 2006
) and UAS:PSD95-GFP (Niell et al., 2004
). This would allow the labelling of these neurons’ axonal and dendritic terminals, respectively.
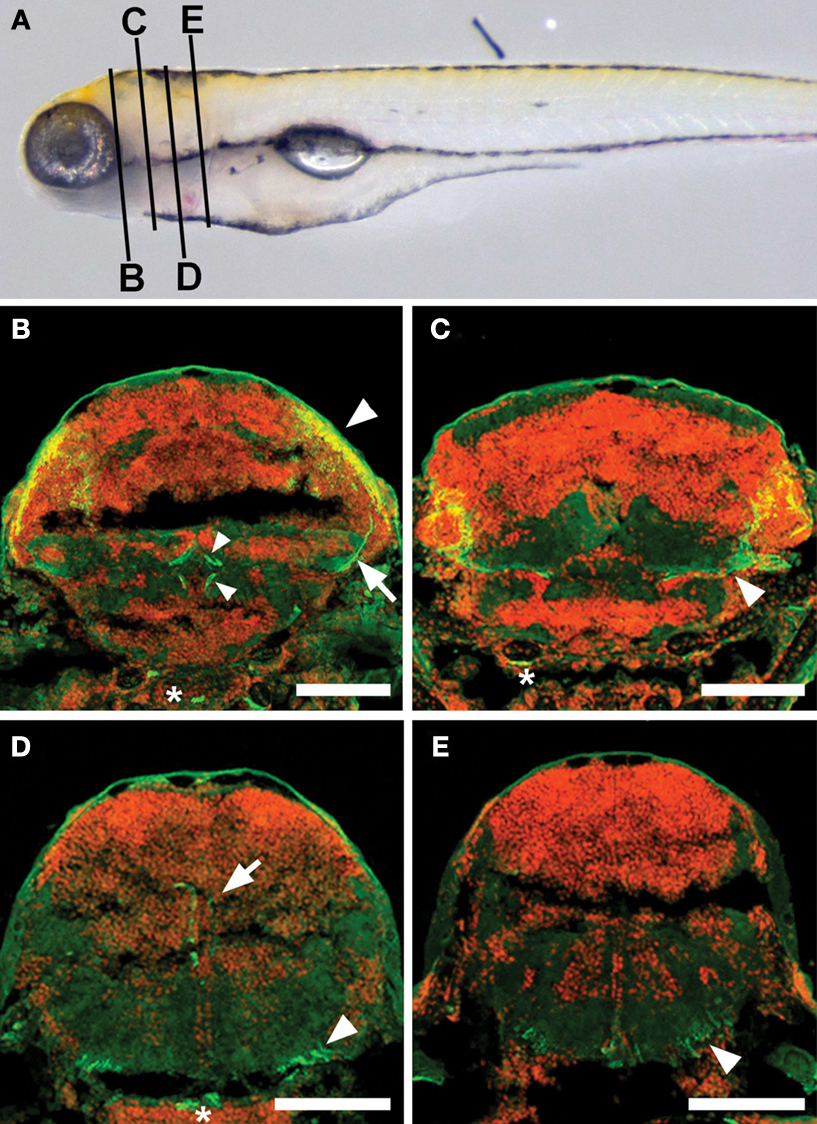
Figure 3. Axonal targets of s1038t-positive PV neurons. (A) Schematic of a 5-dpf larva with the approximate positions of the slices shown in (B–E). Kaede fluorescence (green) shows s1038t PV neurons and cell bodies (DAPI, false colored red) provide landmarks throughout the brain. Axons of PV neurons [cell bodies indicated by arrowhead, (B)] extend ventrally [arrow, (B)] and out of the tectum. They can be seen to course medially [arrowhead, (C)] before terminating in the superior Raphe nucleus [small arrowheads, (B)]. Other axons from these neurons terminate in the superior reticular formation [arrow, (D)] or extend caudally [arrowhead, (D)], terminating in the medulla oblongata [arrowhead, (E)]. Asterisks indicate non-neural staining. Scale bars indicate 100μm. Larvae are 6-dpf, and are heterozygous for the s1038t Gal4 insertion and UAS:Kaede.
Cellular Composition of the Larval Tectum
As described above, observations of Gal4 expression patterns using a UAS-linked fluorophore provide information on the brain region expressing Gal4, and allow for analyses of the overall connectivity of neural structures. Most brain regions, however, contain numerous distinct types of neuron, each with its own structure and role in generating, integrating, or relaying neural signals. Descriptions of gross anatomy, therefore, have a limited utility in describing how the structure of a brain region relates to its function. To address this issue, we have examined cells composing the larval tectum, and described their individual morphologies.
One approach for labelling single cells would be to convert individual Kaede-expressing neurons, and observe their red morphologies among their green, unconverted neighbors (Sato et al., 2006
). However, we found this difficult to execute in cells as small and densely packed as tectal neurons. We have previously shown that individual neurons within broader Gal4 expression patterns can be visualized using the highly variegated UAS:mGFP contained within the Brn3c:Gal4, UAS:mGFP (BGUG) transgene (Scott et al., 2007
). Using this technique, we were able to image the morphologies of individual neurons composing each of our three tectal expression patterns. We observed four cell types that had consistent structural characteristics and that recurred in numerous individual animals.
One cell type was located exclusively in the superficial tectal neuropil, with an arbor spreading in two dimensions over the stratum opticum (SO) and possibly the stratum fibrosum et griseum superficiale (SFGS) (Figures 4
A,B).
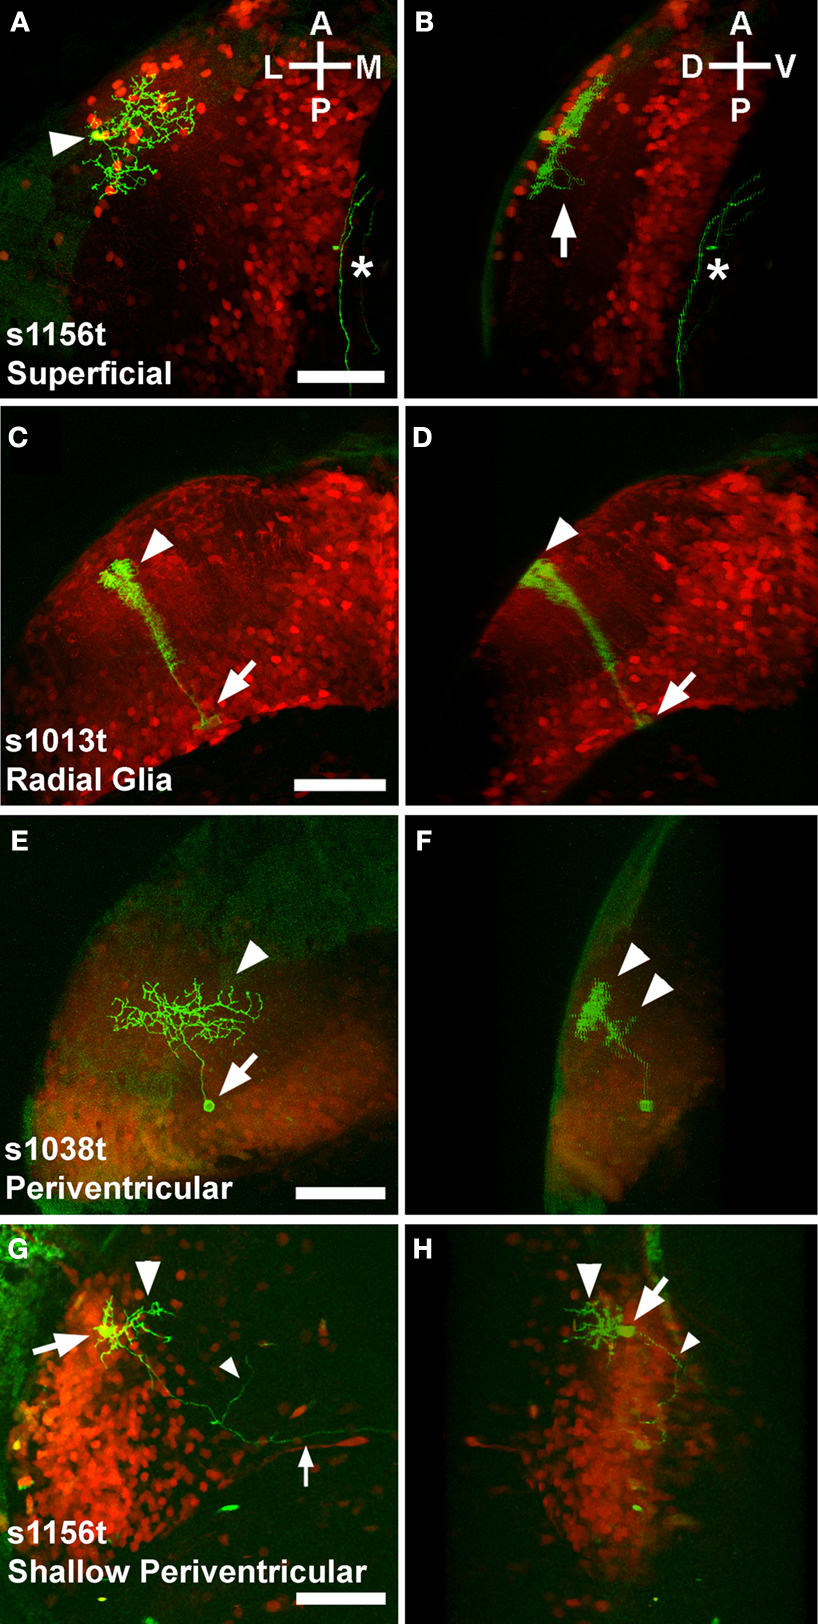
Figure 4. Variegated UAS:mGFP reveals single cell types in the larval tectum. Panels show Gal4 expression patterns in red (photoconverted Kaede), and individual neurons in green (mGFP). Each pair of panels [e.g. (A) and (B)] comprises a dorsal view showing the structure in the A/P and M/L axes (A) and a rotated image that illustrates the D/V extent of the neuron (B). Superficial neurons have neurites spreading away from the cell body [arrowhead, (A)] in the A/P and M/L axes. The arbor is highly stratified to a dorsal layer of the neuropil, probably the SO (B), with a single extension, possibly an axon, crossing into a deeper layer, probably the SFGS [arrow, (B)]. An unrelated neurite is also visible [asterisk in (A) and (B)]. Cells with structures typical of radial glia have cell bodies in the ventral periventricular layer [arrow, (C)], and a bushy dorsal extension that passes through the neuropil [arrowhead, (C)]. These cells invariably extend from their cell body at the ventricular boundary [arrow, (D)] to the extreme dorsal edge of the neuropil [arrowhead, (D)]. Periventricular neurons have their cell bodies in the periventricular layer [arrow, (E)], and extend dendrites into the tectal neuropil [arrowhead, (E)]. These dendrites are typically but not always stratified in one or more D/V layers of the neuropil [arrowheads, (F)]. A distinct category of periventricular neuron, the shallow periventricular neuron, is shown in (G) and (H). Shallow periventricular neurons have cell bodies at the boundary of the cell body layer and the neuropil [arrows, (G) and (H)], send dendrites exclusively into deeper layers of the neuropil [arrowheads, (G) and (H)], and have axons that extend ventrally, rostrally, [small arrowheads, (G) and (H)] and contralaterally [small arrow, (G)] to targets beyond the tectum. All scale bars represent 50μm, and apply to both panels in a pair. Orientations are approximate. Animals are 5 or 6 dpf, and are heterozygous for the indicated Gal4 insertion, UAS:Kaede, and BGUG.
A second type of cell had a morphology similar to radial glia seen in numerous developing laminated neural tissues, including the tectum (Kinoshita et al., 2005
). These cells span the entire D/V axis of the tectum, spreading little in any other axis (Figures 4
C,D). The most abundant cell type in our analysis was the periventricular (PV) neuron, with a cell body in the PV layer and neurites in the tectal neuropil (Figures 4
E,F). Some PV neurons are restricted to the tectum while others have axons that exit the tectum. Concentrated in the anterior and shallow (dorsal) region of the cell body layer were cells that we termed shallow PV neurons. These had an arbor in the deep layers of the neuropil, and an axon exiting the tectum (Figures 4
G,H). In addition to these four types, we saw a small number of neurons with their cell bodies in various layers of the neuropil. These cells varied in their location and structure, and occurred in numbers too small to allow for a categorization of types. These cells serve to remind us that the description of the four cell types above is not a full cataloging of larval tectal neurons, and that there are likely to be more cell types that are not present in any of these three lines.
Having described several of the cell types present in the larval tectum, we were interested in determining whether our lines drive Gal4 in different subsets of tectal cells. For each line, we looked at numerous animals containing one or a few GFP-positive cells, and developed a profile of the cell types observed for each line. We found that s1013t and s1156t both contain a wide variety of tectal cells, with each cell type present (Figure 5
). The rates varied, with s1013t containing large numbers of PV and radial glial cells, and s1156t containing predominantly PV neurons. In contrast, s1038t appears to express Gal4 exclusively in PV neurons within the tectum (Figure 5
).
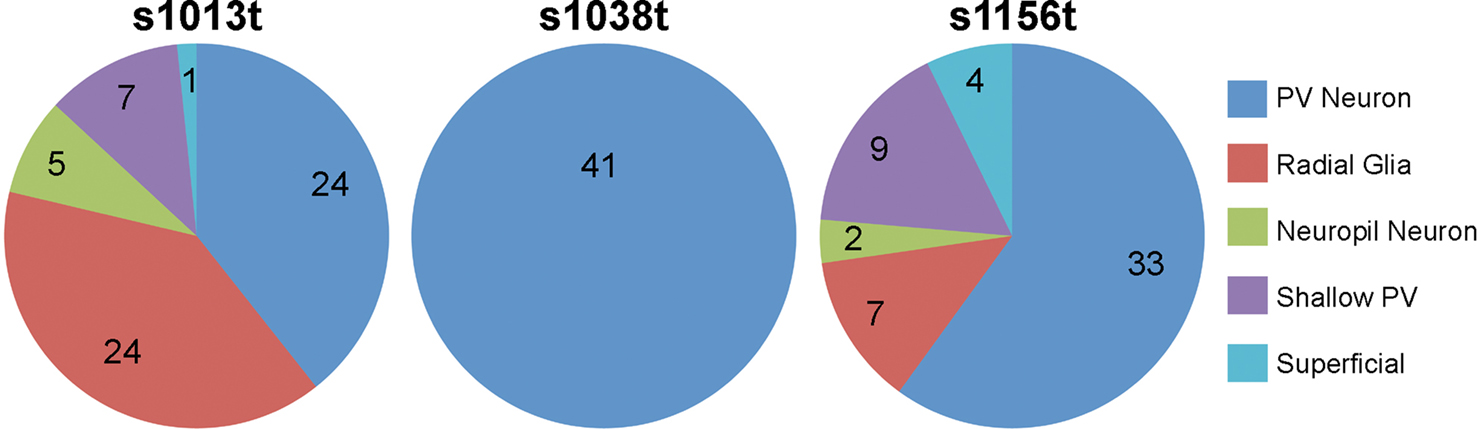
Figure 5. Cell types present in each line. For each tectal ET line, the types and frequencies of cells observed are shown. The number of times that each cell type was observed in repeated single cell analyses is indicated for each line and cell type.
Tectal Output Neurons Receive Input from Deep Layers of the Neuropil
As mentioned above, we found that some PV neurons extend their axons outside of the tectum while others’ neurites are completely contained within the tectum. We also found that shallow PV neurons have extra-tectal axons. These two categories accounted for all of the output neurons that we observed in our single cell analyses. We were therefore interested in whether output neurons have characteristic dendritic properties that reflect the type of input that they receive. We analyzed 26 PV neurons from the s1038t line, describing the dendritic tree as occupying the superficial, intermediate, or deep thirds of the neuropil, or some combination of these regions (Figure 6
).
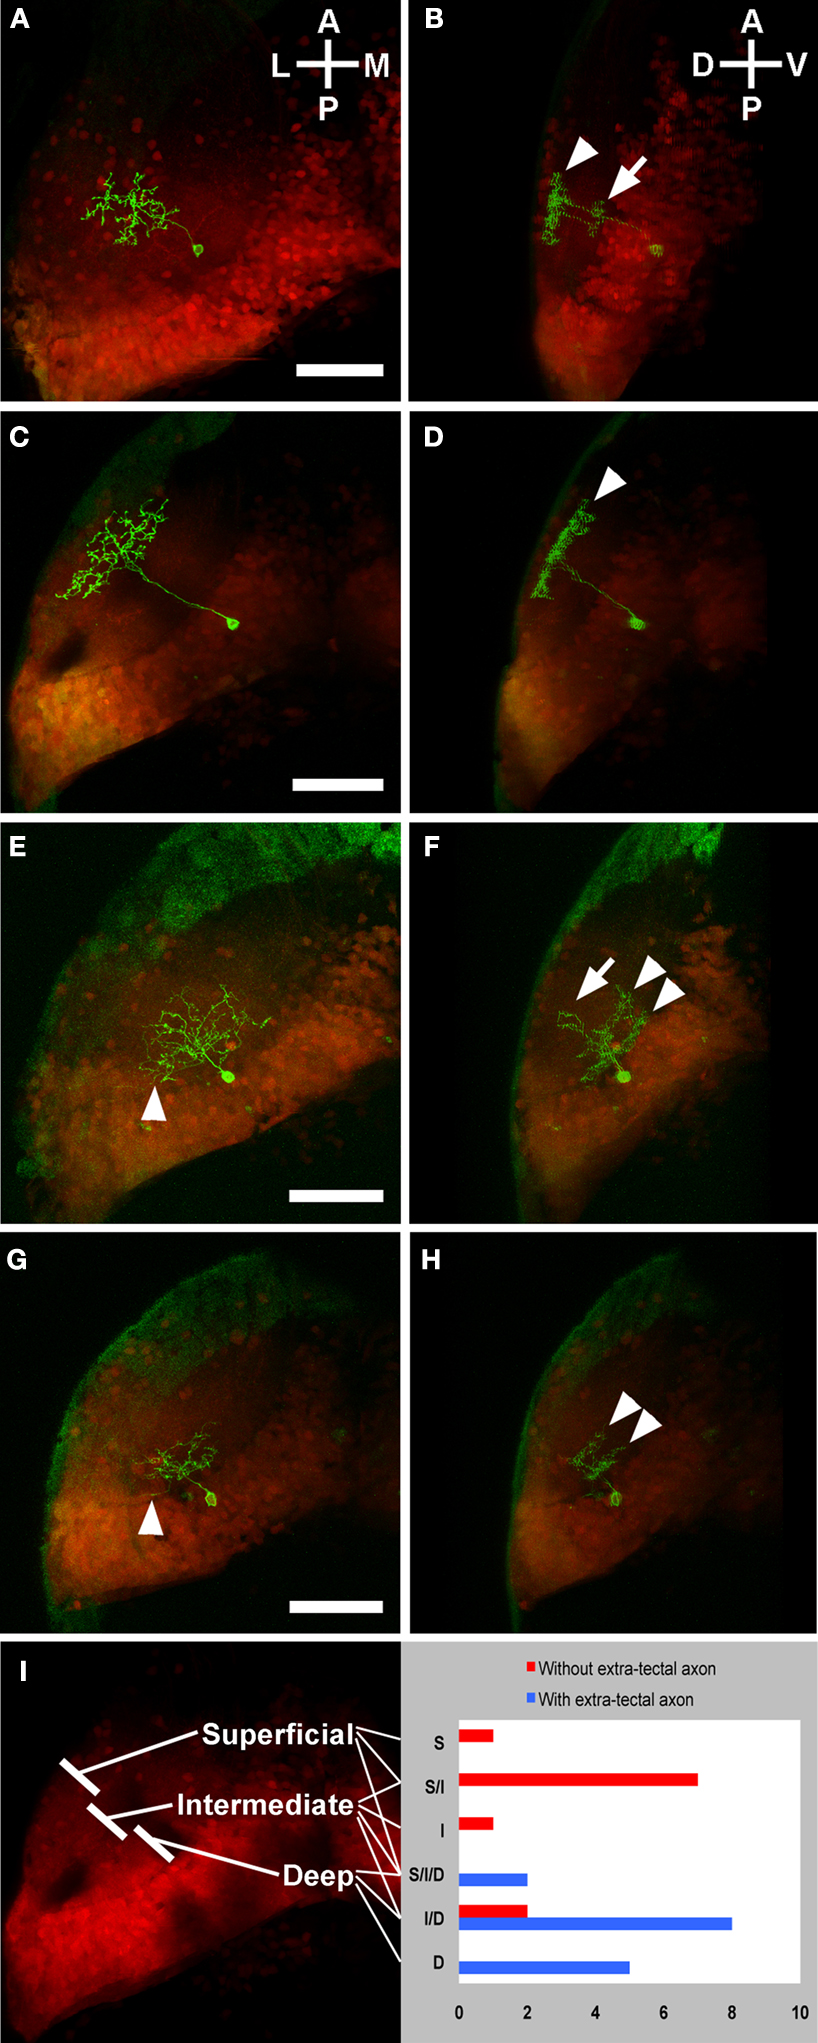
Figure 6. Laminar profiles of PV neurons with and without extra-tectal axons. Panels show the individual s1038t PV neurons (green) in the context of the entire s1038t tectal expression pattern (red). Each pair of panels [e.g. (A) and (B)] comprises a dorsal image and a rotation of that image. PV neurons without extra-tectal axons typically have abundant laminated neurites in the superficial [arrowhead, (B)] layers of the tectal neuropil, and a smaller laminated arbor in intermediate layers [arrow, (B)]. Some of these PV neurons (C,D) have an exclusively superficial arbor [arrowhead, (D)]. PV neurons with axons exiting the tectum [arrowheads in (E) and (G)] usually have neurites in the deep [arrowheads, (F)] and intermediate [arrow, (F)] layers of the neuropil, or exclusively in the deep layers [arrowheads, (H)]. (I) shows a summary of all analyzed s1038t PV neurons, indicating the regions of tectal neuropil where they have neurites and whether or not they have axons extending beyond the tectum. The number of neurons observed with dendrites in given regions or combination of regions is shown on the right side of (I). All scale bars represent 50μm, and apply to both panels in a pair. Orientations are approximate. All animals are 5 or 6 dpf, and are heterozygous for the s1038t Gal4 insertion, UAS Kaede, and BGUG. Supplementary movies 1 and 2 show animated z-series of (E) and (G), and more clearly show the extratectal axons belonging to these neurons.
We then described their axons, finding that 15 had extra-tectal axons, while 11 did not. Comparing the axons to the dendrites of these PV neurons revealed that those with extra-tectal axons invariably had dendrites in the deep layers of the neuropil, and that these dendrites often extended into the intermediate but rarely into the superficial layers. A majority of PV neurons without extra-tectal axons had dendrites restricted to intermediate and superficial layers of the neuropil (Figure 6
I). This correlation was highly significant (p < 0.0001, χ2 test comparing neurons with versus those without deep dendrites). These data, combined with the structure of shallow PV neurons, imply that the efferent neurons of the tectum are receiving input in the deeper layers of the neuropil. Because retinal ganglion cell axons are largely confined to SO and SFGS, this feature indicates that the tectal projection neurons are not directly retinorecipient. These observations are in accord with previous descriptions of tectal efferent PV neurons in adult trout (Kinoshita and Ito, 2006
).
Gal4 Enhancer Trapping Reveals Broad Expression Patterns
In accord with previous studies (Davison et al., 2007
; Scott et al., 2007
; Asakawa et al., 2008
; Ogura et al., 2009
), we found ET to be an efficient approach for generating large numbers of Gal4 expression lines, and found many expression patterns (184/502) that have clear and distinct expression in the nervous system. For most brain regions, there were multiple lines with bright expression, including the three lines for the tectum that we describe here. A majority of our lines, however, display expression in various parts of the brain, and often in non-neural tissues as well. As demonstrated by this study, such broad patterns permit anatomical descriptions of the targeted brain regions, including single cell morphology, but the breadth of the patterns may present obstacles to functional studies of the circuits. Attempts to link transgenic activation or silencing of neurons to the behaviors that they mediate will be complicated by expression of UAS transgenes in many brain regions and cell types. Indeed, our attempts to silence tectal neurons using UAS:dominant negative VAMP (data not shown) resulted either in no discernible phenotype (normal swimming and capture of paramecium prey for s1038t and s1156t), or in nonspecific phenotypes (mild edema, reduced swimming, and defective prey capture for s1013t). These severe effects on behavior have also been seen in studies of larvae with silencing in the circuits for escape responses (Szobota et al., 2007
; Asakawa et al., 2008
). In the future, functional linkage of behavior to underlying neural circuitry will require strategies that provide spatially and temporally precise manipulation of subsets of cells within a broad expression pattern, such as the activation and silencing of neurons using focused light (Douglass et al., 2008
), or restricting regions of UAS transgene activation through expression of Gal80 (reviewed by Halpern et al., 2008
).
BGUG Provides Variegated Expression and Allows for Single-Cell Anatomy
The Gal4/UAS system allows researchers to express a variety of trangenes in consistent expression patterns. This provides a wealth of tools for experiments into the structure or function of brain regions of interest. Here, we have used UAS:Kaede and BGUG to provide distinct pieces of information about the cells expressing Gal4 in three ET lines. Kaede revealed the expression patterns and their broad connectivity while the variegated GFP from BGUG allowed for descriptions of the individual neurons composing the whole. Anatomical studies like this one set the stage for further Gal4/UAS-based inquiry. Knowledge of the cellular structure and composition of these expression patterns will support future work in which additional UAS transgenic lines could be used to activate, silence, or observe activity in these neurons. Combining such functional data with detailed anatomical descriptions of the neurons should help to clarify the behavioural function of the tectum at the level of the individual neurons composing it. In principle, such detailed analyses are possible for any brain region in which cell-specific Gal4 expression patterns exist.
Larval Tectal Targets Represent a Subset of those in Adult Fish
In adult goldfish (Pérez-Pérez et al., 2003
; Luque et al., 2008
), carp (Luiten, 1981
) and trout (Kinoshita et al., 2006
), tectal efferent neurons target numerous regions, including the mesencephalic and rhombencephalic reticular formation, oculomotor nuclei, pretectum, torus semicircularis, nucleus isthmi, lateral geniculate nucleus, torus longitudinalis, and the tegmentum. It is interesting to note that the larval target fields of s1038t neurons represent a subset of those described in adult fish, focusing on different parts of the reticular formation (specifically the Raphe nucleus, the superior reticular formation, and the medulla oblongata). There are a few possible explanations for this. One is that this represents a difference in the connectivity between goldfish and zebrafish brains, although brain regions targeted in a number of fish species already described are highly similar (Luiten, 1981
; Pérez-Pérez et al., 2003
; Kinoshita et al., 2006
; Luque et al., 2008
). More likely, this reflects the incomplete development of the CNS at 5 dpf. As development proceeds, connections may be made with an increasing number of targets. Finally, the observations presented here do not establish whether particular efferent target fields may be missing because the neurons innervating them do not express Gal4 in s1038t animals. Therefore, it is also possible that the larval tectum has more targets than those revealed by our analysis of the s1038t line, and that the target fields in larval and adult brains are more similar than this analysis indicates. Since Gal4 expression is absent in the tecta of adult s1038t fish (data not shown), it is difficult to address this possibility using this line.
The Individual Cells of the Larval Tectum Closely Resemble those in Adult
The cells composing the adult tecta of trout and goldfish have previously been described in detail (Meek and Schellart, 1978
; Meek, 1981a
,b
; Stevenson and Yoon, 1982
; Kinoshita and Ito, 2006
; Kinoshita et al., 2006
). Our descriptions of larval tectal cells show remarkably similar structures at 5 dpf to their eventual adult form. Most of the neurons that we have observed closely resemble adult counterparts in their cell body positions and the positions and structures of their axons and dendrites. These include the superficial neurons (Figures 4
A,B) which structurally resemble the adult type III neurons, larval PV neurons that are similar to adult type XIV neurons, and larval shallow PV neurons that appear to correspond to adult type XV neurons (cell types as described in Meek and Schellart, 1978
). Additionally, the larval tectum contains a large number of cells that resemble the radial glia that have been described in the tectum of adult trout (Kinoshita et al., 2005
). Although neurons with their cell bodies in the neuropil represent a small minority of the total tectal neurons in adult, they account for a large proportion of the cell type diversity (Meek and Schellart, 1978
). The same may be true in larvae, as we observe these cell types rarely, and they show a range of morphologies.
Overall Tectal Organization is Mature in Larvae
Previous work has shown that superficial tectal layers are primarily innervated by retinal ganglion cells and therefore receive unprocessed visual information from the retina (Stuermer, 1988
). In fact, a recent study using ganglion-cell specific reporter lines in zebrafish (Xiao et al., 2005
) reported that the vast majority of retinal axons (estimated at 80%) innervate the SFGS in the superficial third of the tectal neuropil. A substantial minority of axons (estimated 15%) project to an even more superficial synaptic lamina, the (SO). A much smaller number of retinal axons are found in deeper strata, the stratum griseum centrale and the boundary zone between stratum album centrale and stratum periventriculare (SAC/SPV). Deeper layers thus receive visual input largely from superficial tectal layers, along with input from a variety of brain regions and spanning multiple sensory modalities (Kinoshita and Ito, 2006
).
Our observations reinforce the idea that the tectum is primarily involved in the processing and integration of sensory input, and indicate that the circuitry for some of this integration is in place by 5 dpf. This is approximately the time at which these larvae begin to rely on predation for their survival, and therefore need their sensory modalities, particularly vision, fully functional. Specifically, the coordination of eye and body movements is important for the capture of prey, and such coordination is the likely contribution of the tectum to the larval visual system (Gahtan et al., 2005
). It is therefore unsurprising that tectum-ablated zebrafish larvae are deficient solely in prey capture among the behaviours for which they have been tested (Roeser and Baier, 2003
; Gahtan et al., 2005
). All of these facts point to a critical role for the tectum in larval survival, and the importance of functional tectal circuitry by 5 dpf. The tectum outlined here, as a structure that relays integrated sensory information to premotor structures, seems well suited to supporting behavior at this early age.
The authors declare that the research was conducted in the absence of any commercial or financial relationships that could be construed as a potential conflict of interest.
We thank Wendy Staub, Karin Finger-Baier, Aristides Arrenberg, Limor Ziv, Nathan Gosse, Tong Xiao, Claire Wyart, Filippo Del Bene, Peter Schoonheim, and Chunyue Yin for assistance with the ET screen, Toni McCurry, Lindsay Mason, Karin Finger-Baier, and Wendy Staub for technical assistance, and Linda Nevin, Aristides Arrenberg, and Estuardo Robles for their comments on the manuscript. This work was supported by the Australian Zebrafish Phenomics Facility (NHMRC Enabling Grant #455871), NIH grant F32 EY015063, a NARSAD Young Investigator Award, and University of Queensland Early Career and New Staff Startup grants to E.S. and NIH R01 NS053358, the 2006 Byers Award, and a Sandler Opportunity Award to H.B.
The supplementary material for this article can be found online at http://www.frontiersin.org/neuralcircuits/paper/10.3389/neuro.04/013.2009/
Allen Brain Atlas. Available at: http://www.brain-map.org/
Szobota, S., Gorostiza, P., Del Bene, F., Wyart, C., Fortin, D. L., Kolstad, K. D., Tulyathan, O., Volgraf, M., Numano, R., Aaron, H. L., Scott, E. K., Kramer, R. H., Flannery, J., Baier, H., Trauner, D., and Isacoff, E. Y. (2007). Remote control of neuronal activity with a light-gated glutamate receptor. Neuron 54, 535–545.
Yoshihara, Y., Mizuno, T., Nakahira, M., Kawasaki, M., Watanabe, Y., Kagamiyama, H., Jishage, K. I., Ueda, O., Suzuki, H., Tabuchi, K., Sawamoto, K., Okano, H., Noda, and T., Mori, K. (1999). A genetic approach to visualization neurotechnique of multisynaptic neural pathways using plant lectin transgene. Neuron 22, 33–41.
Zebrafish International Resource Center. Available at: http://zfin.org