Biomedical Research Center Nucleus and Department of Psychiatry, Institute of Psychiatry, King’s College, London, UK
The quantitative analysis of pooled data from related functional magnetic resonance imaging (fMRI) experiments has the potential to significantly accelerate progress in brain mapping. Such data-pooling can be achieved through meta-analysis (the pooled analysis of published results), mega-analysis (the pooled analysis of raw data) or multi-site studies, which can be seen as designed mega-analyses. Current limitations in function-location brain mapping and how data-pooling can be used to remediate them are reviewed, with particular attention to power aggregation and mitigation of false positive results. Some recently developed analysis tools for meta- and mega-analysis are also presented, and recommendations for the conduct of valid fMRI data pooling are formulated.
A goal of brain mapping in healthy subjects is to associate mental functions with specific brain locations. In its clinical application, brain mapping aims at identifying the location of brain activation differences between persons suffering from a given neurological or psychiatric disorder and healthy controls during the performance of a cognitive task. Functional magnetic resonance imaging (fMRI) has become the main tool in the brain mapping field as, relative to other techniques, it is non-invasive, has increased spatial resolution, wider availability and lower cost (Pekar, 2006
). Conversely, brain mapping studies represent well over half of the fMRI literature to date (Logothetis, 2008
).
It has been recognized that data pooling across individual studies has the potential to significantly accelerate progress in the brain mapping field (Van Horn et al., 2004
), following other successful data-sharing initiatives, such as The Human Genome Project (Collins and Mansoura, 2001
). The most immediate advantage of data pooling is an increase in power due to the larger number of subjects available for analysis. Data pooling across scanning centers can also lead to a more heterogeneous and potentially representative participant sample. Finally, the study of the causes of variability across related experiments may also lead to novel scientific insights (Matthews et al., 2006
; Costafreda et al., 2008
).
Meta-analysis techniques based on published coordinates of activation have been used since early on to summarize research data and generate novel insights (Fox et al., 1998
). Mega-analysis, defined as the pooling of the fMRI time-series, has been less successful so far in spite of its much greater potential, probably due to the difficulty in databasing and making publicly available these “raw” data, and a lack of specific analysis methods that recognize the additional heterogeneity introduced by different scanning centers. Such difficulties may be easing as the field evolves towards multi-site studies (Schumann, 2007
), which can be seen as designed mega-analyses, and the necessary databasing, data-sharing and analysis tools are emerging (Keator et al., 2008
, 2009
; Bockholt et al., 2009
).
In the following, current limitations in function-location brain mapping are examined, along with strategies for their remediation through data pooling. Following the meta/mega-analysis distinction frequently employed in the field, the advantages and shortcomings of different types of data-sharing based on the type of data used as prime matter for pooling are also discussed. Finally, the different steps for a valid data pooling exercise, from data collection to the selection of suitable analysis methods, are considered.
Erroneous Results in Single-Study fMRI Analysis
The aim of conventional group analysis of fMRI data is to detect the regions that show significant increases in BOLD signal in response to a given task. For explanatory purposes, a comparison between an active task and a baseline condition will be assumed, although the following reasoning can be easily extended to more complex designs. Localizing significant changes is often done through voxelwise hypothesis testing, where a null (H0) and an alternative (H1) hypothesis are compared. The null hypothesis states that there is no difference in mean signal across subjects between the active and the baseline tasks, while the alternative hypothesis states that such difference exists. The decision as to whether or not H0 should be rejected in favor of H1 is then made on the basis of the value of a suitable test (e.g. t-test). Table 1
presents the possible decision outcomes.
False positive results
This mapping strategy is liable to false positive (FP) findings, if H0 is rejected when it is in fact correct, that is if the area declared to be active was truly not engaged by the active task. The probability α of a FP result can be kept acceptably low by using multiple comparisons control procedures such as the random field theory (Worsley et al., 1996
). In practice, the level of FP results in the literature is likely to be higher than the conventional 5% value of α, as uncorrected results are sometimes reported and sub-optimal fixed-effects group analysis is still occasionally used.
However, under the assumption that FP appear at random brain locations, aggregating results across studies is likely to result in improved brain mapping accuracy in the sense of FP reduction, as a FP finding in a given region is unlikely to be replicated across studies (Fox et al., 1998
). In other words, the more studies which have reported that a given area is recruited by a certain paradigm, the less likely it is to be a false positive result. This idea can be formalized: if an observed level of replication in a given location across studies is greater than what would be expected by chance alone, then the null hypothesis of a FP result can be rejected. Recent years have seen the development of several voxel-based meta-analysis methods (Chein et al., 2002
; Turkeltaub et al., 2002
; Wager et al., 2004
, 2007
; Laird et al., 2005a
; Neumann et al., 2005
; Costafreda et al., 2009a
; Eickhoff et al., 2009
). The initial breakthrough was provided by the Activation Likelihood Estimate (ALE) method presented by Turkeltaub et al. (2002)
. ALE is a kernel-based approach currently implemented in BrainMap, an online database of published studies (Laird et al., 2009
). In kernel-based methods, individual studies are represented by a pattern of activation peak coordinates, which are smoothed using a spatial kernel function (Silverman, 1986
). The smoothed patterns are aggregated to obtain a summary map with voxel-level scores representing the local density of activation peaks. This summary map is then thresholded using simulation (Wager et al., 2004
; Laird et al., 2005a
) or parametric (Costafreda et al., 2009a
) approaches, and the areas that survive the threshold are declared as true positive activations. Voxel-based meta-analysis techniques have liberated the meta-analysis process from simple counting of anatomical labels reported by each study and have increased sensitivity to detect aggregate sub-regional activations. A workflow example for one of such methods, Parametric Voxel-based Meta-analysis (PVM, software available from the author; Costafreda et al., 2009a
), is presented in Figure 1
.
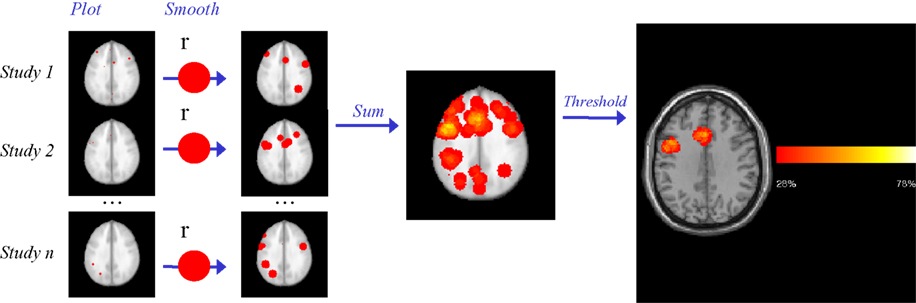
Figure 1. Parametric Voxel-based Meta-analysis. Step 1: the coordinates for each study are plotted in standard space brain (MNI). Step 2: After smoothing with a uniform kernel of size r, each study map is transformed into an indicator map, where voxels with 1 values (red) indicate the presence of at least one activation within distance r. Step 3: all study-level indicator maps are summed and then divided by the number of studies n, to obtain a summary map reflecting the proportion of studies reporting an activation within distance r of each voxel. Step 4: the p value of the observed proportion is computed, under the null hypothesis that the activations are generated at random spatial locations. The final thresholded map reflects the areas where the proportion of studies reporting activation is too high to have been generated by such null random process alone. In this example of a meta-analysis of language production in healthy subjects, Broca’s area and anterior cingulate are revealed as areas of significant activation (Costafreda et al., 2009a
).
False negative results
Brain mapping also suffers from False Negative (FN) reporting, when a region truly active during the task is not recognized as such. This problem is exacerbated by the low number of subjects and, hence, low power that is common in fMRI research. Using a 3T scanner, Thirion et al. (2007)
estimated that at least 20 and preferably 27 or more subjects were needed to obtain reproducible results with a simple sensori-motor task under random-effects assumptions. Although specific to the particular scanner, task and analysis employed by the authors, these findings suggest that many fMRI studies may be underpowered. Additionally, Thirion et al. (2007)
also found that high inter-subject variability was the key element producing low reliability of group mapping. Factors which increase inter-subject variability in BOLD response, such as the inclusion of psychiatric or neurological populations, will therefore require larger samples.
Under certain conditions, data pooling may also result in an increase of power to detect brain activations and therefore a decrease in FN results. It is this potential for increased power through the aggregation of sub-significant results that underpins meta-analysis applications in most fields (Whitehead, 2002
). This type of effect-size meta-analysis is based on study-level estimates of a given scalar effect size (e.g. difference in treatment effects across clinical trials) plus, crucially, the standard error of such estimates. Effect sizes from several studies are then statistically pooled to obtain a summary effect size, which has increased precision over any of the original studies.
An equivalent for fMRI research of this primary data would be the (group-level) effect size image or “beta map” accompanied by its corresponding standard error image. However, fMRI researchers rarely publish the complete statistical images, but instead present a highly compact and refined, but impoverished, representation of the original brain activation maps. Regions of significant brain activation, also known as “blobs”, are three-dimensional structures which approximately follow grey matter distribution and its associated complicated topography. As a description of such structures, only a list of three-dimensional coordinates is available in a standard paper, usually the points of maximum activation (most statistically significant voxel) for each blob, or its centroid. Results published in this format also lack a measure of variance (i.e. standard error), which precludes the use of traditional effect-size meta-analytical techniques (Fleiss, 1993
).
Kernel-based meta-analysis methods can be seen as an attempt to recover a richer representation by deeming as active not only the point of the activation coordinates, but also some neighboring area (Turkeltaub et al., 2002
; Wager et al., 2007
; Costafreda et al., 2009a
). Non-active areas are simply represented by zero. An unavoidable consequence of this impoverished representation is that subtleties in the three-dimensional spatial distribution of the blobs are lost when studies are pooled. Another result is that because the (non-significant) measurements of non-active areas are also lost and simply coded as zero it is not possible to add non-significant findings across studies to decide whether the pooled outcome does, in fact, reach significance. In other words, meta-analysis of coordinate-based data cannot aggregate power across studies and thus cannot remediate the FN problem. Improvements in power can only be obtained through mega-analysis.
In fact, current meta-analysis techniques for brain mapping can be described, from a statistical point of view, as spatial vote-counting (Hedges and Olkin, 1980
), where each study “votes” through its reported peak coordinates on whether a particular location is active or not. Vote-counting is a less than ideal technique for research synthesis in statistical terms (Hedges and Olkin, 1980
). In particular for fMRI research, detection of significant activation in a given study is a factor of both activation effect size and power, mainly determined by its sample size. Given that sample size is usually limited in typical fMRI experiments, there is scope for misleading findings when aggregating vote-counting results.
Variability in Experimental Design, Power and Generalization
From the previous discussion, it can be seen that the initial appeal of pooling fMRI data is therefore a very practical one: to increase the reliability of findings and the power of the statistical analysis. However, this comes at a price: relative to a single large-scale study, a multi-site (or analogously multi-study) design of a similar scale would suffer from inflated variability in its fMRI measurements. This is because it is rare that independent fMRI experiments can be considered exact replicates of each other. For instance, Matthews et al. (2006)
described how a subtle variation in the visual presentation of the cue for a simple hand-tapping task across centers in a multi-center study generated significant between-study variability in visual cortical BOLD responses. Findings such as this one suggest that minor changes in experimental conditions may result in significant differences in brain activation. Examples of experimental characteristics with empirical evidence of an effect on fMRI results include: scanner strength (Friedman et al., 2006
), subject sample composition (D’Esposito et al., 2003
) and analysis method (Strother et al., 2004
). The resulting inflation in variability of the fMRI measurements due to these between-study or between-site factors, even when a standardised protocol across sites is enforced (Zou et al., 2005
; Friedman et al., 2006
) may reduce the statistical power relative to a large single-site design.
Although optimal from the point of view of maximising statistical power, recruitment and other pragmatic issues have tended to make such large-scale single site studies an exception in neuroimaging. Particularly when elusive clinical samples are necessary, recruitment difficulties may recommend a multi-site design (see for example the Alzheimer’s Disease Neuroimaging Initiative, Mueller et al., 2006
). Also, for many research questions, a sample of relevant studies already exists, and pooling results across this sample through meta- and mega-analysis techniques will often be a more efficient use of these data than considering the findings of each study in isolation (Salimi-Khorshidi et al., 2009
).
Apart from the above practical considerations, the increased variability inherent to multi-site or multi-study design is not necessarily detrimental, and can even present advantages for certain research questions. The main potential benefit is that including participants from different sites may lead to a more representative sample of participants, an important consideration if the results of the analysis are intended to be generalized to the population at large. Additionally, activations that generalize over sites and studies are more likely to be linked to the substantive research question under consideration than to idiosyncrasies in study design. As an illustration, the discovery of the resting state brain network in an early mega-analysis was “(…) particularly compelling because these activity decreases were remarkably consistent across a wide variety of task conditions” (Raichle and Snyder, 2007
). Data pooling can then be useful to quantitatively examine the generalization of a finding by pooling the results of related studies performed under different conditions. Finally, the causes of between-study variability may also be of interest in themselves. In Costafreda et al. (2008)
, we applied a meta-regression approach to a large sample of experiments on emotional processing to identify the study characteristics that predicted amygdala activation. Independent predictors of amygdala activation included the type of emotion depicted in the experimental stimuli (e.g. fear), along with more “methodological” variables such as modality of presentation of the stimulus or scanner strength.
Reverse Inference
Reverse inference in functional neuroimaging is the deduction of the presence of a particular cognitive process as a component of a task due to the engagement of the region (or set of regions) during the task (Poldrack, 2006
). An example of reverse inference is concluding that reward may be present during a particular task on the basis of observing activation in striatum. Although problematic from a logical point of view, used cautiously reverse inference may be useful to elucidate the component processes for a task, and it is often used by functional neuroimaging practitioners (Poldrack, 2006
).
In Costafreda et al. (2008)
we reported quantitative estimates of the selectivity of amygdala for different emotions relative to neutral material. For example, we found that the amygdala is four to seven times more likely to be activated by fear than by stimuli of neutral content. This probabilistic estimate may be useful in the interpretation of a particular study finding by quantifying the specificity of the link between an area (or network) and a cognitive process. This estimate also acts as an explicit reminder of the limitations in reverse inference, in that such link is not absolute, but probabilistic and necessarily relative to an alternative state (in this example, a neutral stimulus). Therefore, detecting amygdala activation in a particular experiment cannot lead to the conclusion that the task must have involved a fearful stimulus, but simply that it is more likely that the stimulus was fearful than neutral. Additionally, this single estimate cannot exclude a number of credible alternatives, such as amygdala reactivity to social stimuli per se or emotions other than fear.
Spatial Resolution and Functional Segregation
The spatial resolution of fMRI has been estimated as a point spread function with full width at half maximum (FWHM) of 3.5 mm for 1.5 T scanners (Engel et al., 1997
) and as low as 2 mm for 7 T scanners (Shmuel et al., 2007
). However, inter-subject variability in cytoarchitecture is substantial (Amunts et al., 1999
), which significantly reduces the resolution obtainable at group level. In addition, the analysis of fMRI data usually involves Gaussian filtering, with typical filter sizes (FWHM) being in the range of 6–15 mm, thus further limiting the effective resolution obtained in practice.
Spatial resolution is particularly relevant to the study of functional segregation. Functional segregation aims to delineate discrete cortical regions along functional lines. Very fine-grained examinations of functional segregation have been attempted by pooling results from different studies (Picard and Strick, 1996
). In Costafreda et al. (2006
; Figure 2
), we developed a quantitative method to determine whether two sets of activation peaks are spatially segregated in their cortical distribution. We applied this method to the analysis of verbal fluency studies demonstrating different distributions for the activation peaks of phonological and semantic studies within Broca’s area. The significant difference in mean location identified between both distributions (2–18 mm) was comparable or below the usual resolution of any single study.
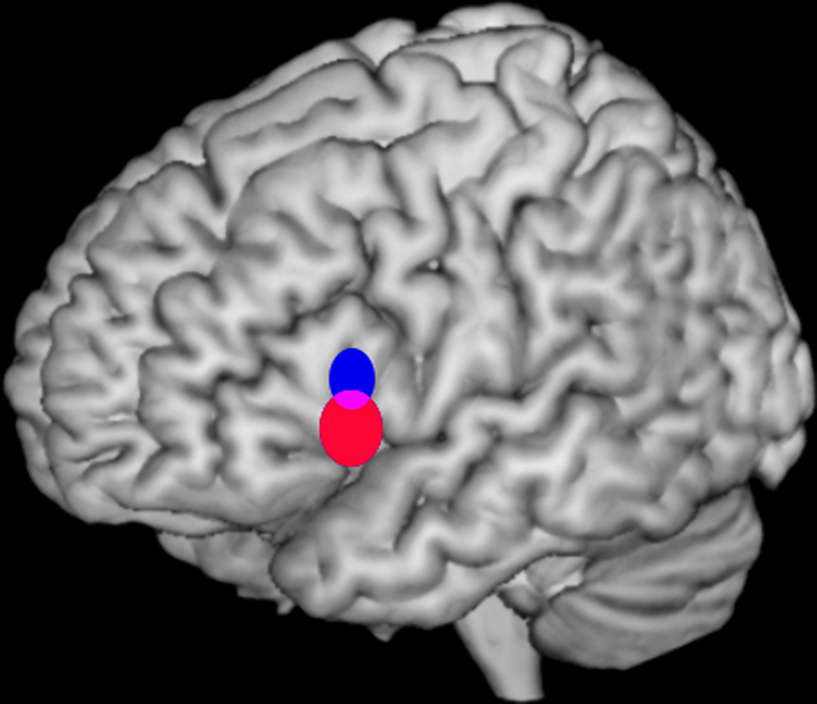
Figure 2. Bootstrap 95% confidence intervals for the mean locations of peak activations in a meta-analysis of phonological and semantic verbal fluency activations in the left inferior frontal gyrus. Updated version of the analysis in Costafreda et al. (2006)
: the systematic literature search has been updated to September 2008 with a total of 25 studies included, and the bootstrap method has been modified to take into account the clustered nature (activations within studies) of the data. The conclusions are the same as the ones in the published paper. Left lateral view of a rendered image of the brain (MNI template). The confidence intervals (CI) for the mean location of peak BOLD responses associated with semantic verbal fluency (red) were significantly more ventral (z-axis) than for those for phonological verbal fluency (blue) at α = 0.05. Areas of intersections of the CI (phonological semantic) are shown in mauve.
Meta-Analysis
Activation coordinates as primary data
Almost all the pooling exercises to date have been meta-analysis, conducted using the coordinates of the location of activations as the primary data. Some of this popularity may be due to the availability of coordinate data, which has become a standard of neuroimaging reporting (Laird et al., 2009
). As discussed earlier, its main disadvantage is the impossibility to aggregate power across studies. Therefore most meta-analyses compute estimates of between-study reliability of activations, although many other coordinate-based approaches are possible, such as the examination of between-study co-activation of brain as a proxy of functional connectivity (Toro et al., 2008
).
Meta-analysis using additional descriptors
Neuroimaging publications often report both coordinates of peak or maximum activation and their associated anatomical label. Meta-analysis based on labels (Laird et al., 2005b
), or a combination of labels and coordinates (Costafreda et al., 2008
) is possible, and can even be more powerful than voxel-based meta-analysis when the number of studies is low (<10) as multiple testing is reduced from the number of voxels to the number of regions. However, the variability in anatomical nomenclature in published studies can be a serious limitation. Additionally, voxel-based meta-analysis may be more sensitive if the clustering of activations across studies is not well matched by the chosen anatomical label (Laird et al., 2005b
).
Often, in addition to location coordinates, additional measures of the activation characteristics are reported. If the volume of the activated “blobs” was consistently reported, then it could be used for more accurate approximation of the original activations. In our experience though, volume of activation is not consistently reported.
Often the T or Z statistics of significant activations are also reported. It is possible to employ these quantities to generate effect size meta-analyses. The difficulty with this approach, however, consists of how to handle non-significant effects, for which no effect size estimate is given: are we to assume these unknown effect sizes are zero, or just below significance, or simply exclude them from the dataset? In our view any of these alternatives leads to further difficulties in the form of potential biases of our results, while the benefit is only an apparent increase in power (apparent because the subsignificant results are unknown).
In conclusion, while acknowledging the serious limitations inherent in coordinate-based data, and short of a decided move towards full voxel-based reporting of significant and non-significant effect sizes discussed below, coordinates are currently the best available substrate for meta-analysis.
Mega-Analysis
fMRI time-series as primary data
As the raw time-series contains the record of all the measurements obtained during an fMRI experiment, it would seem the obvious prime matter for data pooling: mega-analysis can reduce both false positive and false negative results. However, three practical difficulties have severely limited the application of this approach. First, fMRI measurements from a single study typically generate gigabytes of data. Databasing such large volumes of information and making it publicly available is no trivial technical task (Van Horn et al., 2001
; Bockholt et al., 2009
). Secondly, fMRI data sharing initiatives have in the past sparked serious objections in the scientific community, which has often proven reticent to share data that are difficult and expensive to acquire (Koslow, 2002
). Only a very small fraction of fMRI experiments are nowadays publicly available for download. Finally, there is currently a paucity of quantitative methods that are able to cope with the processing complexity that may arise in fMRI data mega-analysis. These factors create a classical egg and chicken situation: as very limited data are available for download, limited effort is put into developing mega-analysis methods, which in turn further limits the appeal of data-sharing in this format.
This situation, however, is starting to change. Empirical studies have shown low scanner-related variance relative to between-subject variability and measurement error (Costafreda et al., 2007
; Suckling et al., 2008
) thus encouraging multi-center designs and associated databasing technology (Keator et al., 2008
). Methods of analysis are also starting to reflect the need for large-scale integration of results (Pinel et al., 2007
; Costafreda et al., 2009b
; Dinov et al., 2009
; Salimi-Khorshidi et al., 2009
), as discussed below.
Statistical maps as intermediate format
The complexity in databasing and publishing time-series data would be reduced if instead statistical brain maps were made publicly available. If effect-size brain maps were accompanied by their standard error images, then usual effect-size meta-analysis methods could be applied (Whitehead, 2002
), and power could be aggregated across studies with smaller databasing overheads. Additionally, standard random-effects fMRI analysis techniques could be used validly on such summaries (Salimi-Khorshidi et al., 2009
). If subject-level statistical maps, rather than group-level maps, were to be released, this would also allow the examination of the causes of between-subject variability, which has been consistently identified as the main source of heterogeneity in fMRI measurements (Zou et al., 2005
; Costafreda et al., 2007
; Thirion et al., 2007
; Suckling et al., 2008
).
In spite of its convenience, it must be stressed that such intermediate data format would also have its disadvantages. Temporal data, and therefore, connectivity information, would be lost in the translation. Relative to time-series pooling, extraneous variability would also be introduced by those statistical maps, as different labs would report maps obtained through varying pre-processing and first-level analysis approaches.
Systematic search strategy
The validity of data pooling is crucially dependent on which studies are included. In effect-size meta-analysis, a particularly important problem is publication bias. Also known as the “file-drawer” problem, it originates from the fact that negative studies are less likely to be published, biasing the overall estimate of effect size towards higher values (Sterne and Egger, 2001
). Unbiased, exhaustive and a priori literature-sampling strategies are necessary to ensure the inclusion of all relevant studies, or at least of a representative sample, of which only clearly flawed or inadequate studies should be excluded. It is worth insisting that these sampling considerations also apply to mega-analysis of fMRI data, as negative studies may be less likely to be represented in publicly available data repositories. In our view, databases containing the results of fMRI experiments (e.g. Brainmap, fMRIDC) (Laird et al., 2009
) should be used to complement the systematic literature search bearing in mind the caveat they do not include all potential studies, and the criteria for inclusion in the database are often not explicitly stated, creating room for selection biases. By contrast, in coordinate-based meta-analysis, the focus of the analysis is usually the determination of the location of an effect, which may be less affected by the exclusion of non-significant results (Fox et al., 1998
).
Study as a Random Effect
Both meta- and mega-analysis require analysis methods adapted to the specificities of pooling data across experimental designs. As discussed earlier, functional MRI experiments are highly heterogeneous in their subjective recruitment strategies, cognitive paradigms, acquisition software and hardware, and analysis methods. Even with standardized protocols and adequate data preprocessing (Zou et al., 2005
; Friedman et al., 2006
; Costafreda et al., 2007
) two fMRI measurements coming from the same center can be expected to be more similar to each other than what would be expected by chance alone, compromising crucial independence assumptions inherent to most analysis methods. Therefore, the existence of multiple sites for data acquisition will in most cases have to be recognized during data analysis as well.
In the analysis of the efficacy of clinical interventions, meta-analysis of (scalar) data from heterogeneous trials is also the rule (Whitehead, 2002
). It is often dealt with in a double strategy: (1) by employing study-level covariates that are likely to explain some of the study heterogeneity as fixed-effects in a meta-regression approach, and (2) through the inclusion of a study-level error term capturing residual inter-study variability. This second point is equivalent to treating the study factor as a random effect, in a similar way as subjects are treated in fMRI group-level estimates (Mumford and Nichols, 2006
).
Meta- and mega-analysis of functional imaging data could benefit from a similar approach. The study should therefore be recognized as a further level in the usual fMRI data hierarchy of task runs within subjects within studies (Penny et al., 2003
). Most methods currently in use for fMRI meta-analysis, however, consider the foci of activation as the independent observations and ignore the clustering of coordinates in the original studies (Chein et al., 2002
; Turkeltaub et al., 2002
; Wager et al., 2004
; Laird et al., 2005a
; Neumann et al., 2005
). These approaches are therefore fixed-effects meta-analysis techniques. The results of fixed-effects meta-analysis only apply to the specific sample of experiments under consideration and cannot be generalized to a population of studies if between-study heterogeneity is present. In practical terms, the main undesirable consequence of omitting study-level clustering is that statistically significant density can be obtained with fixed-effects methods simply by the report of several contiguous foci by a single paper, which may have been obtained through overly generous statistical thresholding and thus a marker of poor study quality (Wager et al., 2007
). Random-effects alternatives for fMRI meta-analysis have been recently developed using simulation-based (Wager et al., 2007
; Eickhoff et al., 2009
) and parametric analytical approaches (Costafreda et al., 2009a
), and should in our view be preferentially employed.
In particular, PVM (Costafreda et al., 2009a
; Figure 1
) is a statistical method for function-location meta-analysis that allows valid, powerful, fast and scalable detection of the areas with significance concordance between studies for maps expressed in proportions. That is, the statistic computed in this approach is, for each voxel, the proportion of studies that have reported activation within a pre-determined local neighbourhood. Proportions are “natural” random effects estimators, in the sense of taking between-study variability into account. They are also easily interpretable, even when translated into a map. Finally proportions, and ratios between proportions, can be directly used as quantitative estimates of probability, for example as guidance in reverse inference.
Regarding mega-analysis, the existence of study-level clustering effects would need to be recognized through, for example, the introduction of a study level in the analysis hierarchy (e.g. runs within tasks within subjects within group within centers/studies). If the highest-level, “top” summary map is of interest, a random-effects analysis can be obtained through the application of split-level analysis using usual software libraries, such as FSL (Salimi-Khorshidi et al., 2009
). Costafreda et al. (2009b)
presents a mega-analysis tool that may be useful for more complex designs, especially in the presence of clusters (families, studies) with potentially low degrees of freedom. If covariate estimation is required, then clusters with low counts may present an identifiability problem (if number of parameters ≥ items in cluster). The Bayesian all-in-one approach allows the estimates to “borrow strength” across clusters, thus stabilizing the model fitting process (Bowman et al., 2008
).
Study Differences as Fixed Effects
As discussed earlier, heterogeneous experimental designs are inevitable in many data pooling situations. Some of this heterogeneity may have direct consequences on the results of the experiments. Known or suspected sources of heterogeneity may be controlled at the study selection step by restriction, for example by only including studies with exclusively right-handed samples in a language meta-analysis. At the analysis step, covariates can be included as fixed effects in a meta-regression strategy (Costafreda et al., 2008
). Covariate adjustment is often an attractive option, because the addition of the extraneous factor as a covariate maximizes power both by allowing the inclusion of a larger number of studies than if a restrictive approach had been used, and by removing the variability associated with the covariate factor. Whether a covariate is, in fact, influencing the summary findings can then also be determined, which may be interesting in itself.
Finally, if the covariate is associated with both the outcome under study and the predictor of primary interest, this association may result in confounding, which would lead to biased meta-analytical findings if not taken into account (Greenland et al., 1999
; Lawlor et al., 2004
). A hypothetical example of confounding would be created if fMRI was a more sensitive technique than PET, and experiments on negative emotions were mostly done with fMRI while those on positive emotions were conducted with PET. Thus, ignoring this potential confounding effect in the analysis would create an apparent increase in the probability of amygdala activation for negative over positive emotions. Two difficulties have to be acknowledged when dealing with confounding. First, potential confounders are not always accurately measured. For example, while functional neuroimaging publications do not always disclose enough methodological detail to ascertain whether fixed or random-effects multisubject analysis was performed, this methodological choice influences the sensitivity and generalizability of the analysis (Friston et al., 1999
). Accurate and extensive meta-data collection is thus a pre-requisite for pooled data analysis, which should benefit from recent advances in automated meta-data collection (Bockholt et al., 2009
). Second, the number of potential confounding factors that can be effectively introduced in the analysis depends ultimately on the size of the available dataset. A general rule-of-thumb in linear modeling is that one predictor may be included for each 10 independent observations (Harrell, 2001
), although newer statistical approaches may be able to remediate this limitation (Fu et al., 2008
). If these steps for heterogeneity control are not available, for example due to incomplete information, then the likely impact of potential confounding factors should be addressed when discussing the results (Costafreda et al., 2006
).
Crucially, random and fixed-effects strategies are not competing alternatives to deal with between-study heterogeneity. When possible, pertinent covariates can be used in a meta-regression to explain some of the variability or to study the causes for between-study heterogeneity. Additionally, all attempts at fMRI data pooling should include a study-level error even if study factors are already included as fixed effects, because it is unlikely that the measured covariates capture all the between-study variability.
Pooling data across sites responds primarily to pragmatic necessities, such as the maximization of sample size, especially in elusive clinical populations. It can also satisfy the need to utilize already existing, but frequently underpowered, neuroimaging studies in a more efficient way than the consideration of their individual findings. Last but not least, as fMRI research grows exponentially, quantitative synthesis of published fMRI research will remain necessary simply to allow researchers a summary of a mountain of research data. As functional neuroimaging becomes more data-rich, such computational approaches able to extract novel insights from existing large-scale datasets are likely to become increasingly valuable.
The author declares that the research was conducted in the absence of any commercial or financial relationships that could be construed as a potential conflict of interest.
Work supported by a MRC Special Training Fellowship in Neuroinformatics and a Wellcome Trust Value in People Award. The author also acknowledges support from the National Institute for Health Research (NIHR) Specialist Biomedical Research Centre for Mental Health award to the South London and Maudsley NHS Foundation Trust and the Institute of Psychiatry, King’s College London.
Bockholt, H. J., Scully, M., Courtney, W., Rachakonda, S., Scott, A., Caprihan, A., Fries, J., Kalyanam, R., Segall, J., de la Garza, R., Lane, S., and Calhoun, V. D. (2009). Mining the Mind Research Network: A Novel framework for exploring large scale, heterogeneous translational neuroscience research data sources. Front. Neuroinform. 3. doi:10.3389/neuro.11.036.2009.
Costafreda, S. G., Fu, C. H. Y., Picchioni, M., Kane, F., McDonald, C., Prata, D. P., Kalidindi, S., Walshe, M., Curtis, V., Bramon, E., Kravariti, E., Marshall, N., Toulopoulou, T., Barker, G. J., David, A. S., Brammer, M. J., Murray, R. M., and McGuire, P. K. (2009b). Increased inferior frontal activation during word generation: a marker of genetic risk for schizophrenia but not bipolar disorder? Hum. Brain Mapp. 30, 3287–3298.
Dinov, I., Van Horn, J., Hojatkashani, C., Magsipoc, R., Petrosyan, P., Liu, Z., Lozev, K., Mackenzie-Graham, A., Eggert, P., Stott Parker, D., and Toga, A. (2009). Effcient, distributed and interactive neuroimaging data analysis using the LONI pipeline. Front. Neuroinform. 3. doi: 10.3389/neuro.11.022.2009.
Keator, D. B., Grethe, J. S., Marcus, D., Ozyurt, B., Gadde, S., Murphy, S., Pieper, S., Greve, D., Notestine, R., Bockholt, H. J., and Papadopoulos, P. (2008). A national human neuroimaging collaboratory enabled by the biomedical informatics research network (BIRN). IEEE Trans. Inf. Technol. Biomed. 12, 162–172.
Van Horn, J. D., Grethe, J. S., Kostelec, P., Woodward, J. B., Aslam, J. A., Rus, D., Rockmore, D., and Gazzaniga, M. S. (2001). The functional magnetic resonance imaging data center (fMRIDC): the challenges and rewards of large-scale databasing of neuroimaging studies. Philos. Trans. R. Soc. Lond., B, Biol. Sci. 356, 1323–1339.
Zou, K. H., Greve, D. N., Wang, M., Pieper, S. D., Warfield, S. K., White, N. S., Manandhar, S., Brown, G. G., Vangel, M. G., Kikinis, R., and Wells, W. M. (2005). Reproducibility of functional MR imaging: preliminary results of prospective multi-institutional study performed by Biomedical Informatics Research Network. Radiology 237, 781–789.