Mining the Mind Research Network: a novel framework for exploring large scale, heterogeneous translational neuroscience research data sources
1
Neuroinformatics, Mind Research Network, Albuquerque, NM, USA
2
Computer Science, The University of New Mexico, Albuquerque, NM, USA
3
Medical Image Analysis, Mind Research Network, Albuquerque, NM, USA
4
Electrical and Computer Engineering, The University of New Mexico, Albuquerque, NM, USA
A neuroinformatics (NI) system is critical to brain imaging research in order to shorten the time between study conception and results. Such a NI system is required to scale well when large numbers of subjects are studied. Further, when multiple sites participate in research projects organizational issues become increasingly difficult. Optimized NI applications mitigate these problems. Additionally, NI software enables coordination across multiple studies, leveraging advantages potentially leading to exponential research discoveries. The web-based, Mind Research Network (MRN), database system has been designed and improved through our experience with 200 research studies and 250 researchers from seven different institutions. The MRN tools permit the collection, management, reporting and efficient use of large scale, heterogeneous data sources, e.g., multiple institutions, multiple principal investigators, multiple research programs and studies, and multimodal acquisitions. We have collected and analyzed data sets on thousands of research participants and have set up a framework to automatically analyze the data, thereby making efficient, practical data mining of this vast resource possible. This paper presents a comprehensive framework for capturing and analyzing heterogeneous neuroscience research data sources that has been fully optimized for end-users to perform novel data mining.
Modern science is marked by an accumulation of massive amounts of data and neuroscience is no exception. The different neuroimaging modalities, such as diffusion tensor imaging (DTI), functional magnetic resonance imaging (fMRI), structural MRI (sMRI), electroencephalography (EEG), positron emission tomography, or magnetoencephalography, each produce a huge amount of data that when combined with genetic information, psychological assessment results, and socio-demographics makes it impossible for researchers to draw conclusions without sophisticated storage, recall, and inference methods. As research has moved to multi-site collaborations, the difficulties of working with large datasets have only increased, underlining the need for comprehensive tools to address these problems (Amari et al., 2002
).
Neuroinformatics (NI) aims to solve these problems and increase the effectiveness of researchers through intelligent use of data storage, data analysis, and data presentations. NI makes storage and retrieval of data easy and transparent to researchers, but also assists them by supplying only the data that is relevant to their needs (Toga, 2002
). Combining these services with data repositories enables easy sharing and reduces the difficulties of scanning enough subjects to draw meaningful conclusions.
The importance of a NI framework and system cannot be overstated. A NI system is critical in order to shorten the time between study conception and results. Second, a scalable system is required when large numbers of participants are studied. Further, when multiple sites participate in research projects, organizational issues become difficult. Optimized NI applications mitigate these problems. Finally, NI software enables coordination across multiple studies, leveraging the advantages of each to potentially lead to exponentially greater research discoveries. The web-based Mind Research Network (MRN) system has been designed and improved through our experience with several multi-site translational neuroscience research studies and feedback from researchers from seven different institutions. The MRN tools permit the collection, management, reporting and efficient use of large scale, heterogeneous data sources, e.g., multiple institutions, multiple principal investigators, multiple research programs and studies, and multimodal acquisitions (Carneiro and Vasconcelos, 2005
; Bockholt et al., 2007
).
Applications typically contain complex features often found to be non-intuitive by end-users, especially when they are first starting to use them. Our framework has been shaped by the requirements of several years of experience in providing NI tools to a full- spectrum of investigators and researchers conducting data acquisition, storage, management, analysis, and retrieval. The MRN approach and tools have proven to be effective and scalable. When researchers have access to an existing, well-designed, well-documented turnkey solution, that is already specialized to their domain of research, they can use the tools for their own projects, providing a distinct advantage to the group in both startup time and in minimizing future data integrity problems. However, the ultimate goal of data mining is to effectively use data sources to their full potential. The framework presented herein strives to achieve this end for the scientists that access the vast MRN data sources by providing intuitive access to fully annotated, anonymous data sources for novel exploration.
The MRN Clinical Imaging Consortium (MCIC) is one example of a multi-institutional program for which the described framework was initially developed, built, and deployed (Demirci et al., 2008
; Kim et al., 2009
; Segall et al., 2009
; Sui et al., 2009
). The MCIC project needed sophisticated tools to analyze and support the multi-site heterogeneous data sources that were collected by the consortium of investigators (Carneiro and Vasconcelos, 2005
). The tools within the framework needed to provide security, querying, reporting, analyzing, summarizing, exporting, and archiving capabilities (see Figure 1
). The MCIC project is composed of sources from more than 400 human research volunteers that have had comprehensive baseline and longitudinal neuroimaging (sMRI, fMRI, DTI), genetic, clinical, socio-demographic, and neuropsychological assessments. This NI capability has been actively used by several investigators and researchers distributed across The University of New Mexico, The University of Iowa, The University of Minnesota, and Massachusetts General Hospital at Harvard University. In addition to the MCIC project, the framework presented has benefited enormously through years of collaboration with the Biomedical Informatics Research Network (BIRN
1
), the National Alliance for Medical Imaging Computing (NA-MIC
2
) and collectively, all of the investigators and researchers within the scope of the MRN.
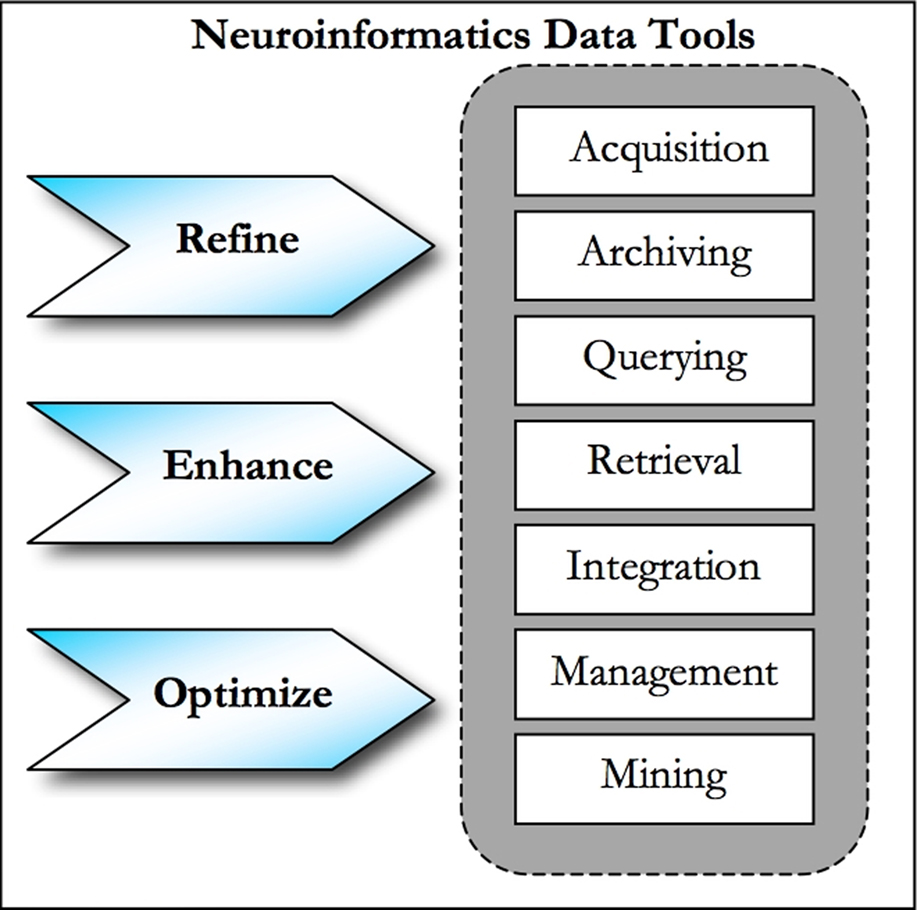
Figure 1. Neuroinformatics data tools.
A large volume of data is collected, managed, and made available for exploration in any type of neuroscience research project. In Figure 2
is an overview of the applications that commonly access and use the MRN clinical research tools. The framework focuses on real-time neuropsychological assessment acquisition via a tablet-PC platform, real-time annotation via web services, collaborative web portals for data management and reporting, automated neuroimaging analyses, web application tools for monitoring and staging data analyses, quality assurance (QA) methods, and data mining capabilities. The full implementation details for this framework will be made available on The Neuroimaging Informatics Tools and Resources Clearinghouse (NITRC)
3
.
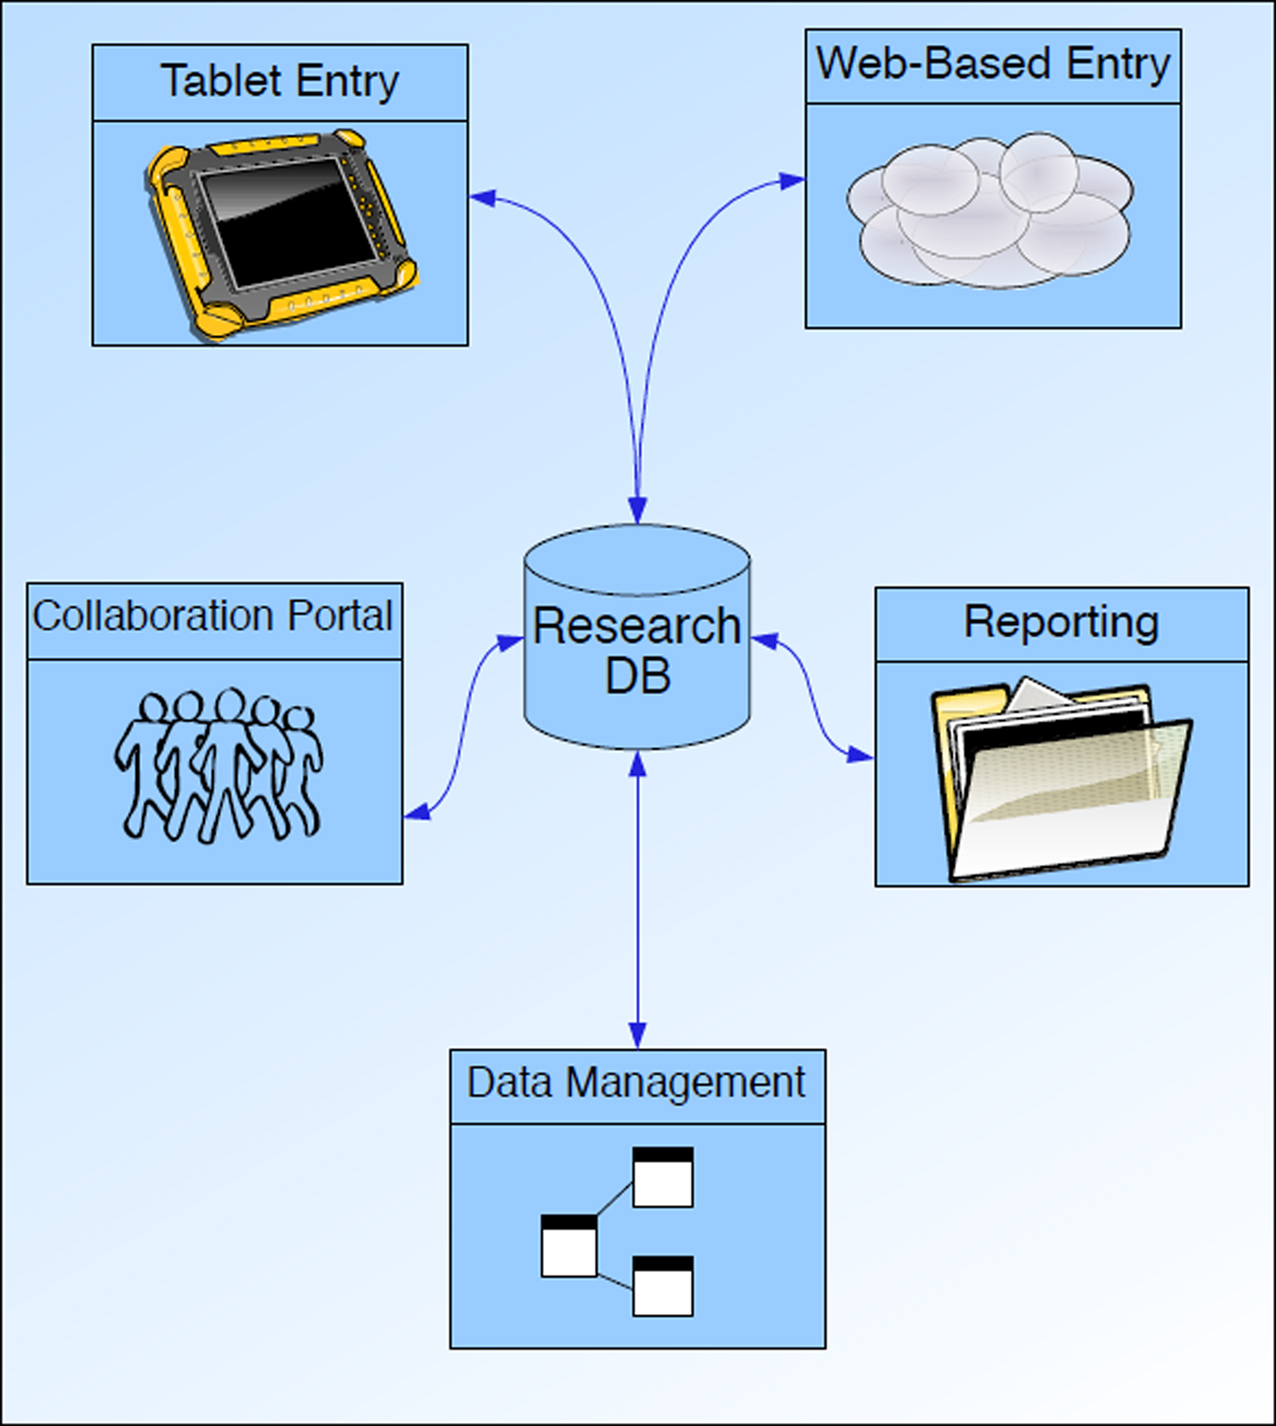
Figure 2. Overview of MRN Neuroinformatics System.
Database
A system for storing, archiving, accessing, and integrating the various sources of data is clearly needed. One tier of the system is a relational database management system (RDBMS) (Farn and Hu, 1995
). The advantage of using a RDBMS over other types of databases is that the RDBMS technology is mature, stable, portable, scalable, and easy to integrate (Brinkley and Rosse, 2002
; Bly et al., 2004
; Bota and Arbib, 2004
; Bota et al., 2005
). In the MRN data-mining framework, we have determined that the following items in Table 1
should be supported within the RDBMS schema.
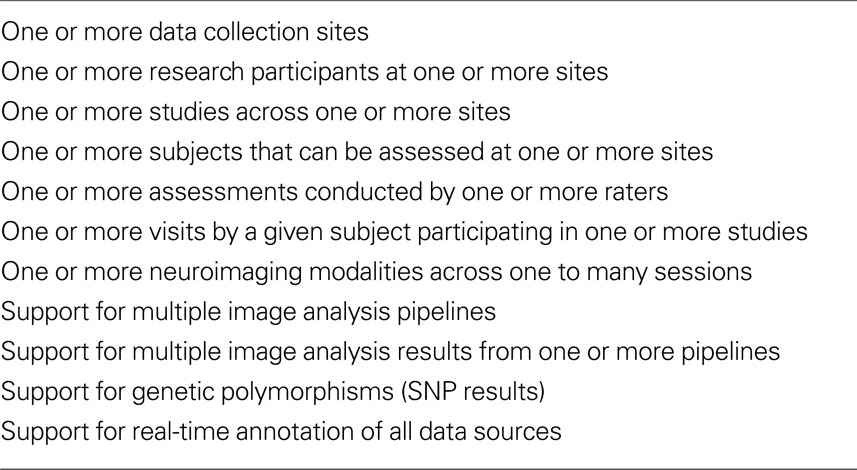
Table 1. Items that should be supported within the RDMBS schema.
Collaborative Web Portal Application
The public face of the MRN framework is a collaborative portal that provides secure access to data sources for the participating researchers and investigators. This web-tier application manages requests between a user’s desktop browser and the RDBMS tier.To accompany the RDBMS, we have identified functional requirements and designed and implemented a comprehensive web-based system to support the translational neuroscience research needs within the MRN organization. These requirements have been summarized in Table 2
.
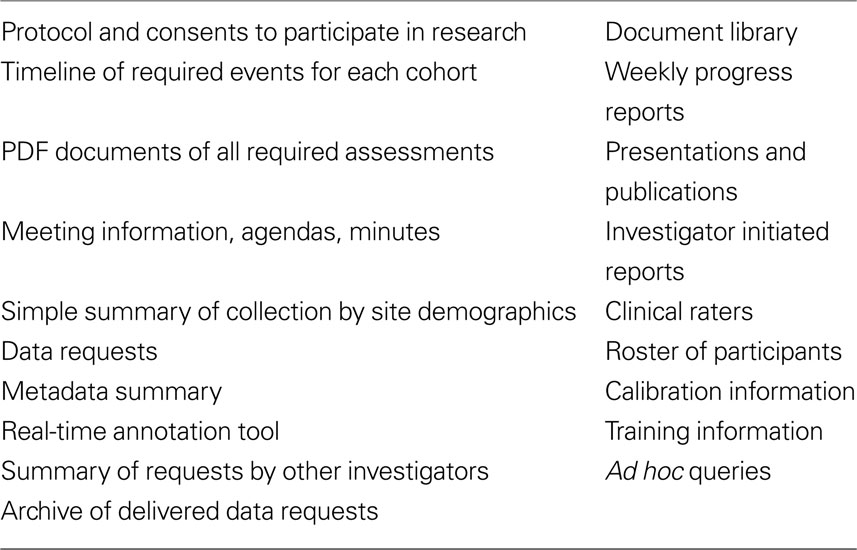
Table 2. Functional requirements for the web-based system supporting the translational neuroscience research needs within the MRN organization.
The specific requirements for an end-user’s ability to create, modify, query, or export a given item of research data depends on the site and role of the user requesting the data manipulation event (Prasad et al., 1987
; Brinkley and Rosse, 2002
; Bota and Arbib, 2004
; Costa, 2004
; Bota et al., 2005
; Jovicich et al., 2005
). We have developed tools for attaching roles to portal users, such as principal investigator, co investigator, study coordinator, rater, etc. The features that a given user has access to depends upon the assigned role that user has in the study. The MRN framework provides a mechanism for indicating who the principal investigator is on a given study and a means for managing the users and their role on each study.
Web-Based Data-Entry
The socio-demographic, clinical, and neuropsychological assessments collected in the MCIC protocol, along with many other types of multi-site consortium studies, generate a large amount of data that must be made electronic so that it can be integrated with data collected in other research domains. After completing a training program, raters, the individuals that conduct the assessment events, are trained to document the interview results on standard paper-based forms. When a complete set of assessments has been collected and documented for a given subject, the stack of assessments for that subject is shipped to a centralized data-entry. This data acquisition process generates specific requirements for an application to manage the multitude of paper-based assessments.
Data-entry of clinical, socio-demographic, neuropsychological and other types of assessments performed is necessary since most of the time these data sources are collected as pen-and-paper-based assessments. The following web application requirements for an assessment data-entry system have been determined: perform first entry of assessment by data-entry operator; perform second entry of assessment by alternative data-entry operator; perform conflict screening and logical checks of doubly-entered assessments by clinical program manager; summarize data acquisition by assessment, subject, site, and other custom report generating features as needed (Andreasen et al., 1995
; Vessey et al., 2003
).
The pen-and-paper forms must be data-entered in a secure and fault tolerant manner. The web-based data entry application, accessible via the intranet, facilitates the first and second entry of assessment data by two different data-entry operators. A clinical program manager then utilizes the application to perform conflict screening and logical checks on the double-entered assessments. Data acquisition summaries may then be generated by assessment, subject, and site along with other custom report generating features as needed.
Tablet-Based Data-Entry
The purpose of the tablet PC entry capability is to provide end-users with a capability for the real-time collection and quality validation of clinical neuroscience research assessment data. This tool (written for use on any tablet hardware running Windows XP Tablet Edition with SDK 1.7, operating system patched to SP2, Microsoft.Net 2.0 framework 1.7) provides our researchers a means to capture assessment data electronically in settings where a network connection may not be possible or permitted. Electronic acquisition of assessment events also permits a more efficient research process since data-entry of paper-based assessments is not required. Additionally, quality control can be conducted in real-time, since the tablet PC can provide feedback to the rater during the data acquisition process. Finally, tablet PC based data collection was found to be preferred by raters (Pace and Staton, 2005
; Cole et al., 2006
).
The Tablet Assessment software validates data as it is entered, including: required fields; data type for the response (e.g., numeric, character string or date); bounds checking information (e.g., systolic blood pressure is a number between 0 and 300); question dependencies (e.g., question 2 “How many cigarettes do you smoke a day?” does not need to be answered if the answer to question 1 “Do you smoke?” is no).
During an interview, the rater is notified immediately when a required field is skipped or data entered does not meet quality criteria, but the software does not constrain the rater to fix the data immediately. This allows the rater to complete the interview smoothly and fix data issues at a later time if necessary. Assessments that do not pass data quality validation may be stored on the rater’s tablet and edited at any time, but they may not be submitted to the database until all issues are resolved. The tablet-based product stores and maintains the data that it manages in XML and is capable of exporting data via a SOAP webservice
4
using XCEDE
5
or other XML schema.
Scan Annotation
In providing NI tools for the MCIC project, we have developed a utility for having integrated data sources and real-time documentation of what, when, and where items (such as neuroimaging events) succeed or fail. This documentation permits timely, efficient processing and maximizes data-usability. In Figure 3
, we present a screenshot of a real-time, web-based, image annotation tool. During a neuroimaging session, this annotation tool allows the end-user to track and document each imaging series. The web application is connected to both a custom DCM4CHE-based DICOM receiver
6
and the MRN RDBMS database described above. The order of events, whether or not the event was completed, whether or not the end-user thinks that the imaging data is usable for analysis can be annotated by using this tool. Furthermore, the end-user may attach additional detailed documentation such as why an image may not be usable. Finally, auxiliary files, such as behavioral data, may be attached and submitted in real-time.
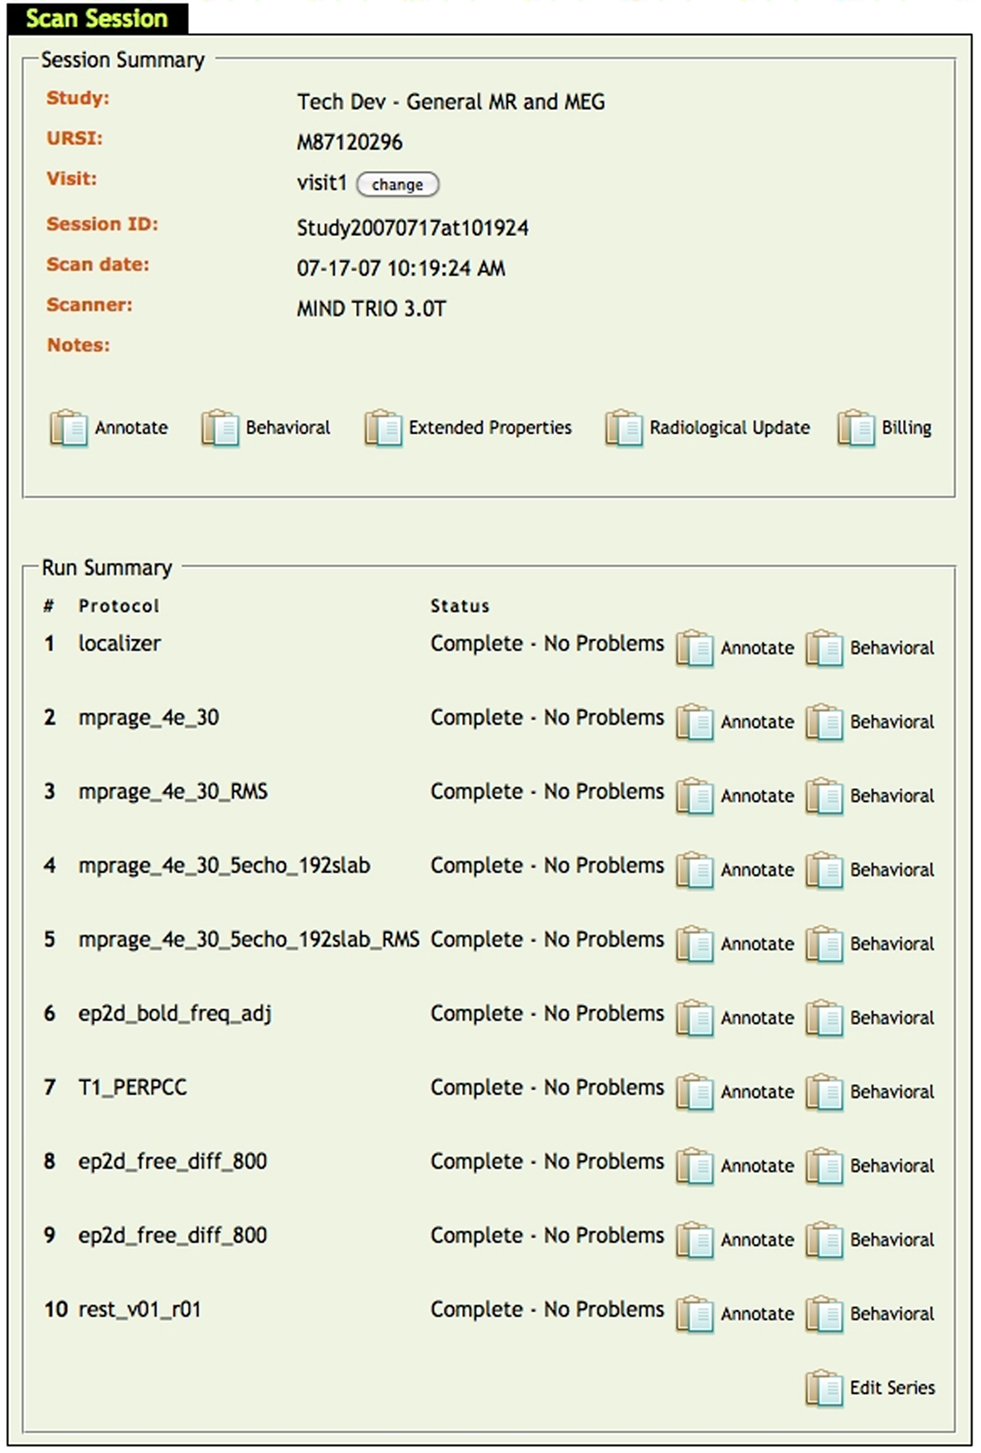
Figure 3. Real-time annotation tool.
Auto-Analysis Description
We have standards in place at The MRN for researchers to follow for scanning and naming data. When research subjects are scanned, information is input into a database form on the scanner console that feeds the information directly into the NI database about the scan session. The scanned data is then archived onto a backup storage space. The subject data is then transferred by auto-analysis scripts to a local analysis area. Here the data is reformatted, so that all scans are in an analyzable format. Automation performs the first level analysis for fMRI, the two modalities of sMRI, and DTI. Preprocessing is done on both the fMRI and sMRI data that allows researchers to work on the statistical analysis, instead of having to pre-process their data first. For the structural scans, FreeSurfer provides cortical and subcortical results for individual subjects. VBM provides volume and density results for grey matter and white matter tissues. In the case of FreeSurfer, which is processed on a computing cluster, auto-analysis has saved investigators lots of time and local computing resources, for it is a computationally intensive software package. DTI gives us water diffusion results for white matter tracts. We are currently in the process of automating magnetic resonance spectroscopy. This auto-analysis pipeline benefits the PIs, boosting their effectiveness, and it also magnifies the value of the information, allowing it to be pooled from smaller datasets to larger datasets, yielding large Ns to analyze effects, such as gender, that are not seen in smaller datasets.
Data Querying
We have learned that users of our MRN tools wish to perform customized queries within individual research studies and across studies, where permitted. To that end, we have developed a prototype application to handle queries within and across research studies for all data domains stored in the MRN database. For custom queries, users typically wish to first be able to select the study or studies they wish to query, and then perform some high-level filtering of the major data domains in order to set the criteria for the subjects they wish to analyze.
In Figure 4
, we demonstrate the applications filtering capability. The user is able to select assessment criteria, such as the instrument, the visit type, the field, and operator and a value. In the example, the user wished to query all MCIC subjects where neuropyschological batteries were conducted at a baseline visit and where the total reading score was assessed at greater than a value of 50. The result is a filtered list of subjects for which the user is then asked what they wish to report from that filtered list of subjects. The example continues where the user is able to select and report all of the data sources available on that filtered list of subjects. Finally, we demonstrate how the user may export the data in a format that suits their needs. The application currently permits a customizable field delimiter, line terminator, and selectable data orientation. This functional prototype permits extensive customized querying, and given that it may be used across all data sources from all studies stored in the MRN database, it will prove to be an invaluable tool, forming the foundation for planned data mining activities.
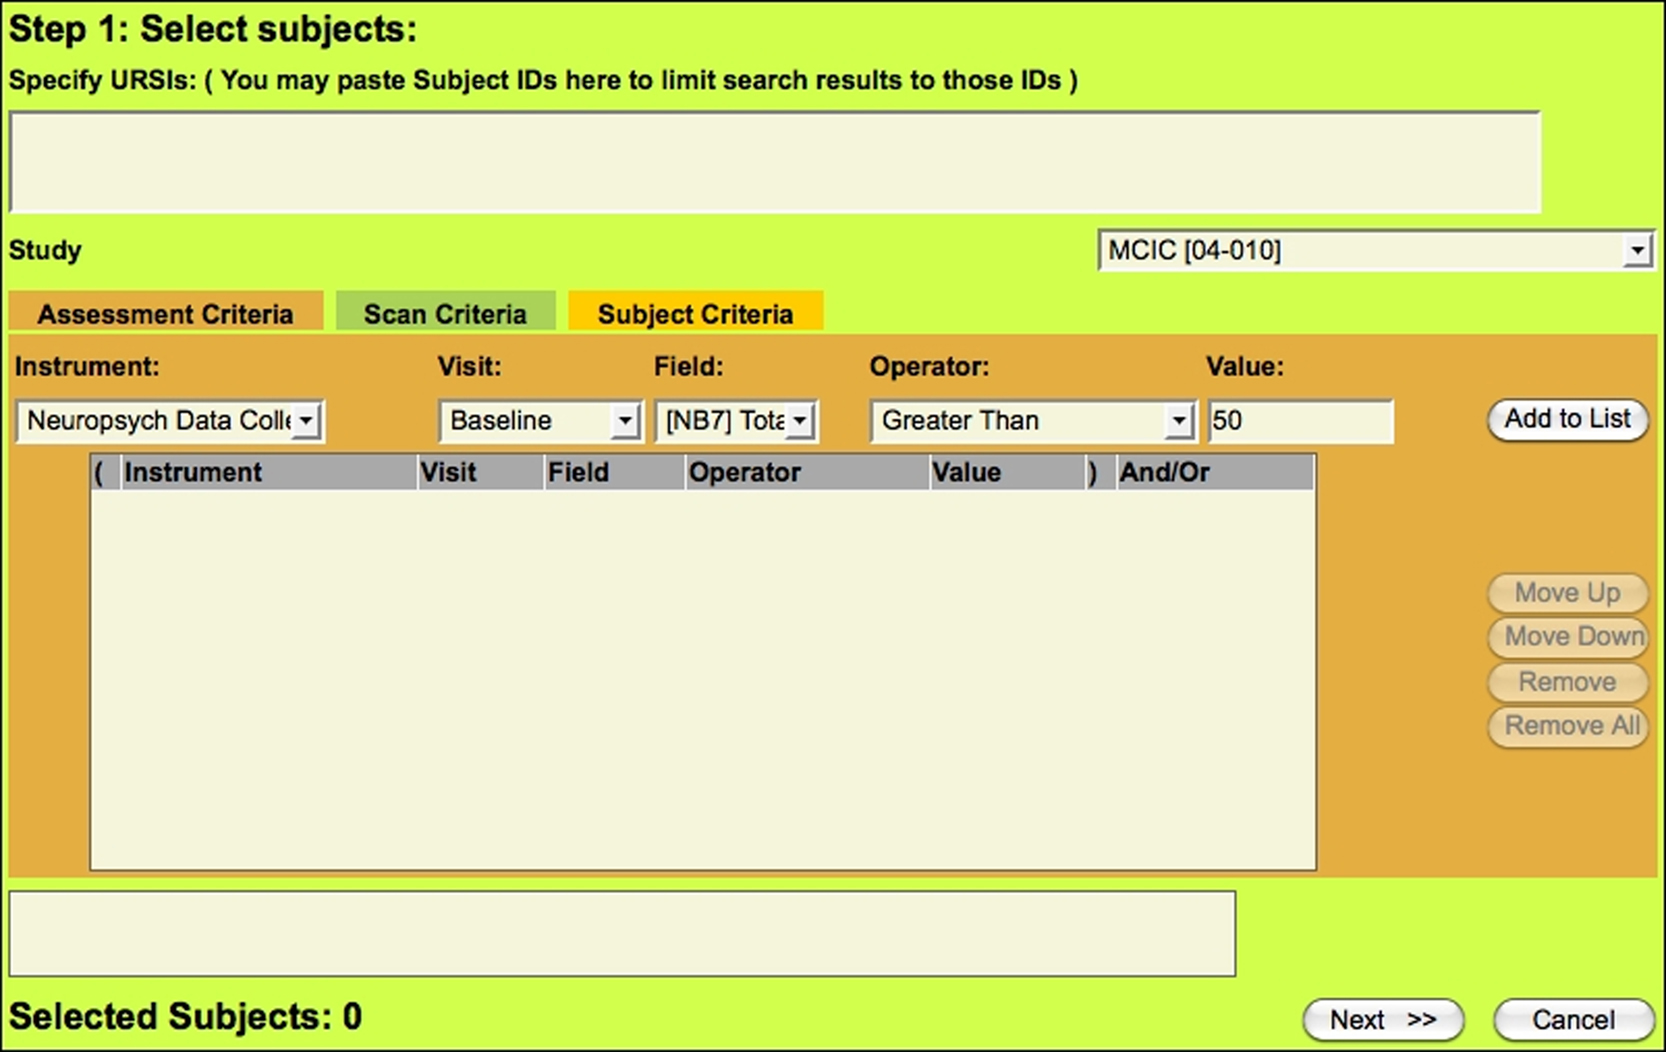
Figure 4. Data querying application tool.
Quality Assurance and Quality Control
We now present two QA protocols: one for morphological data and one for behavioral data. We have used individuals control charts on the morphological data because of an automated segmentation algorithm that allows us to inspect every brain. When multiple structural scans are taken, the variation within session is too small to be identifiable (Spiring, 2007
). Each segment is normalized to total brain volume due to differences across gender, age, and scanner differences (Tofts, 2004
). Our control limits are set by the data, but as our database size continues to increase, the variability will decrease. With an increasingly large dataset that has multiple subject types, a regression control chart (Aroian and Levene, 1950
) can be used to detect outliers by subject type. The morphological findings show that within psychometrically normal subjects, neuromorphometric outliers are detected. These outliers will begin to lead us into researching more of the predictive potential of neuromorphometric data. Figure 5
illustrates an example of a control chart. In the example, a single subject is found to be an outlier on the left thalamic proper label (that has been normalized by total brain volume). When this particular subject is flagged as a statistical outlier on this measure, the end-user is prompted to review the entire neuromorphometric results for that subject and make a decision on whether or not to use that subject in their particular analysis.
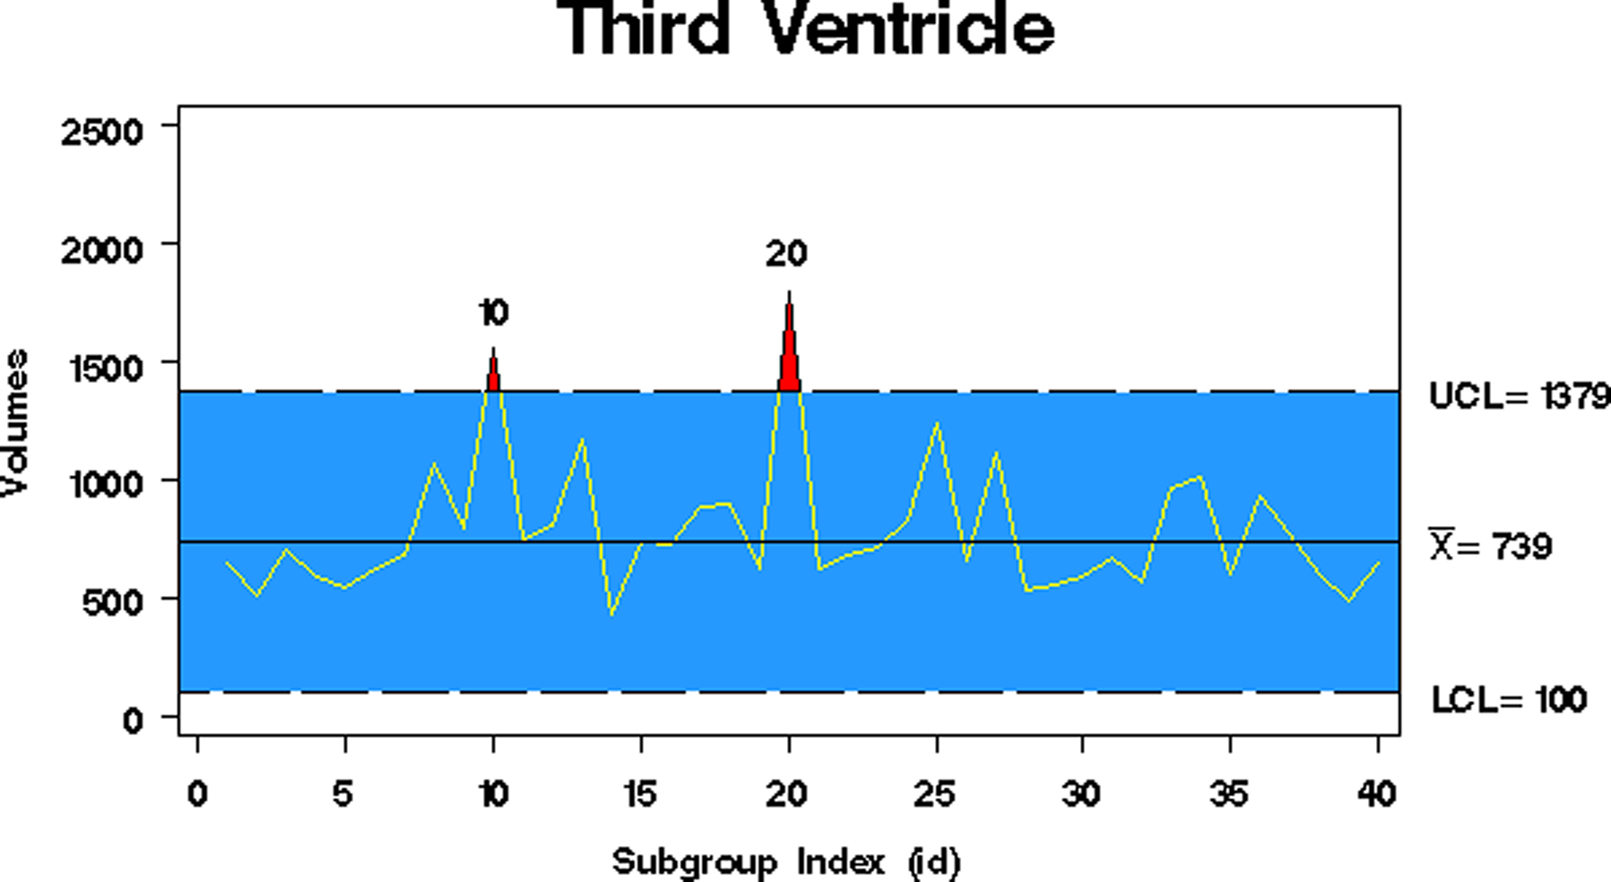
Figure 5. Quality control chart example.
In tandem with the QA of the neuromorphometric data is the QA of the assessment data. The three aims of using QA of assessment data are: make certain that collected data falls within acceptable boundaries, use subject type to determine quality of data, and, integrate neuroimaging data and clinical assessment data to create multivariate control charts.
Quality assurance of the processed data is always a concern. We have designed measures to ensure that both the automation process is working correctly on all of the data analysis methods and that the quality is consistent. The NI database has a field to include notes about issues that come up during the individual scans. Incoming scans and processed scans are monitored daily by a team of people involved in automation. A weekly report of disk space and total number of scans is generated to make sure the process is operating properly. QA measures are being built in to the automation stream that notifies us when data fails to meet QA standards. These issues can then be resolved and the corrections implemented into future analyses to prevent concerns.
Within the MRN system across five sites and 280 system users, the framework encompasses access to 8502 subjects with 10,410 MRI scan sessions, 1200 EEG session, 752 unique instruments have been developed for 140,692 assessment events with a total of 2,533,868 questions available for use in mining nearly 150 TB of raw and analyzed data. We are now actively sequencing one million SNP arrays on prospective subjects, as well as continuing to collect vast amounts of baseline and longitudinal clinical, neuropsychological, behavioral, and treatment assessment results. While the preliminary research studies that drove the initial development of MRN tools were primarily based on schizophrenia, MRN studies managed in MRN tools now involve a wide range of psychiatric, psychological, and neurological disorders including post- traumatic stress disorder, psychopathy, addiction, traumatic brain injury, lupus, vascular dementia, stroke, mild cognitive impairment, Alzheimers, as well as studies of creativity and accelerated learning.
The following three case studies provide examples of results of data-mining using the MRN framework.
Case Study One: Novel Analysis Planning
As part of a study’s configuration in the NI system, a protocol must be devised regarding the necessary assessments, tasks, and automated analysis pipelines that are to be performed on each subject entered into the study. These protocols are specialized to a specific subject type under which each subject may be registered. From this information, along with the data results and metadata contained in the database, the system can determine which subject data has been completed, which data is not yet scheduled to be completed, and which data is delinquent.
The system is flexible enough to accommodate multiple types of protocols to enable growth that may come with future analysis techniques. For example, it currently supports the management of assessment data and analysis snapshots, but will soon be used to drive automated quality control systems that will rely on professional, human confirmation. Furthermore, this unified protocol schema enables a commonized system of viewing the data collected from the subjects.
Persons with the necessary privileges may view the summarized results from their study’s web portal. The user must choose a type of analysis to be summarized and may optionally filter their results by subject type. The results are displayed in a color-coded grid and can be sorted by the links at the tops of the columns. Data results that have been completed can be viewed by clicking on the appropriate link in their representative box. In the case of analysis pipelines, various images are displayed for fast reviewing purposes in thumbnail form (see Figure 6
). These can be expanded, along with metadata concerning their entry, to be viewed in full size for a more detailed qualitative review. Assessment questions and their responses can be viewed in a similar way.
Figure 6. First level analysis planning.
This tool provides investigators with a tool to summarize the results of the analysis done on their subjects’ data and bring to light the results that are tardy in their completion. Much time can be spared from the waste of manually sifting through filesystem-based data storage to view results. As an added boon, problems with analysis pipelines may also now be found more easily.
Case Study Two: Conducting Analysis
An image processing module in the database can be used as a quick diagnostic tool to compare groups such as controls vs patients. A number of tests are supported including one sample t-tests, two sample t-tests, Class mean, and K-means clustering.
The input data for these algorithms are the contrast images obtained from the first level analyses using Statistical Parametric Mapping. Figure 7
shows an example where six healthy and six schizophrenics contrast images are used to generate a one sample t-test map. In addition, we plan to provide data mining tools which work with the preprocessed spatiotemporal fMRI data for example. In this case, the processing must be done in an offline manner as the wait time will be considerably longer.
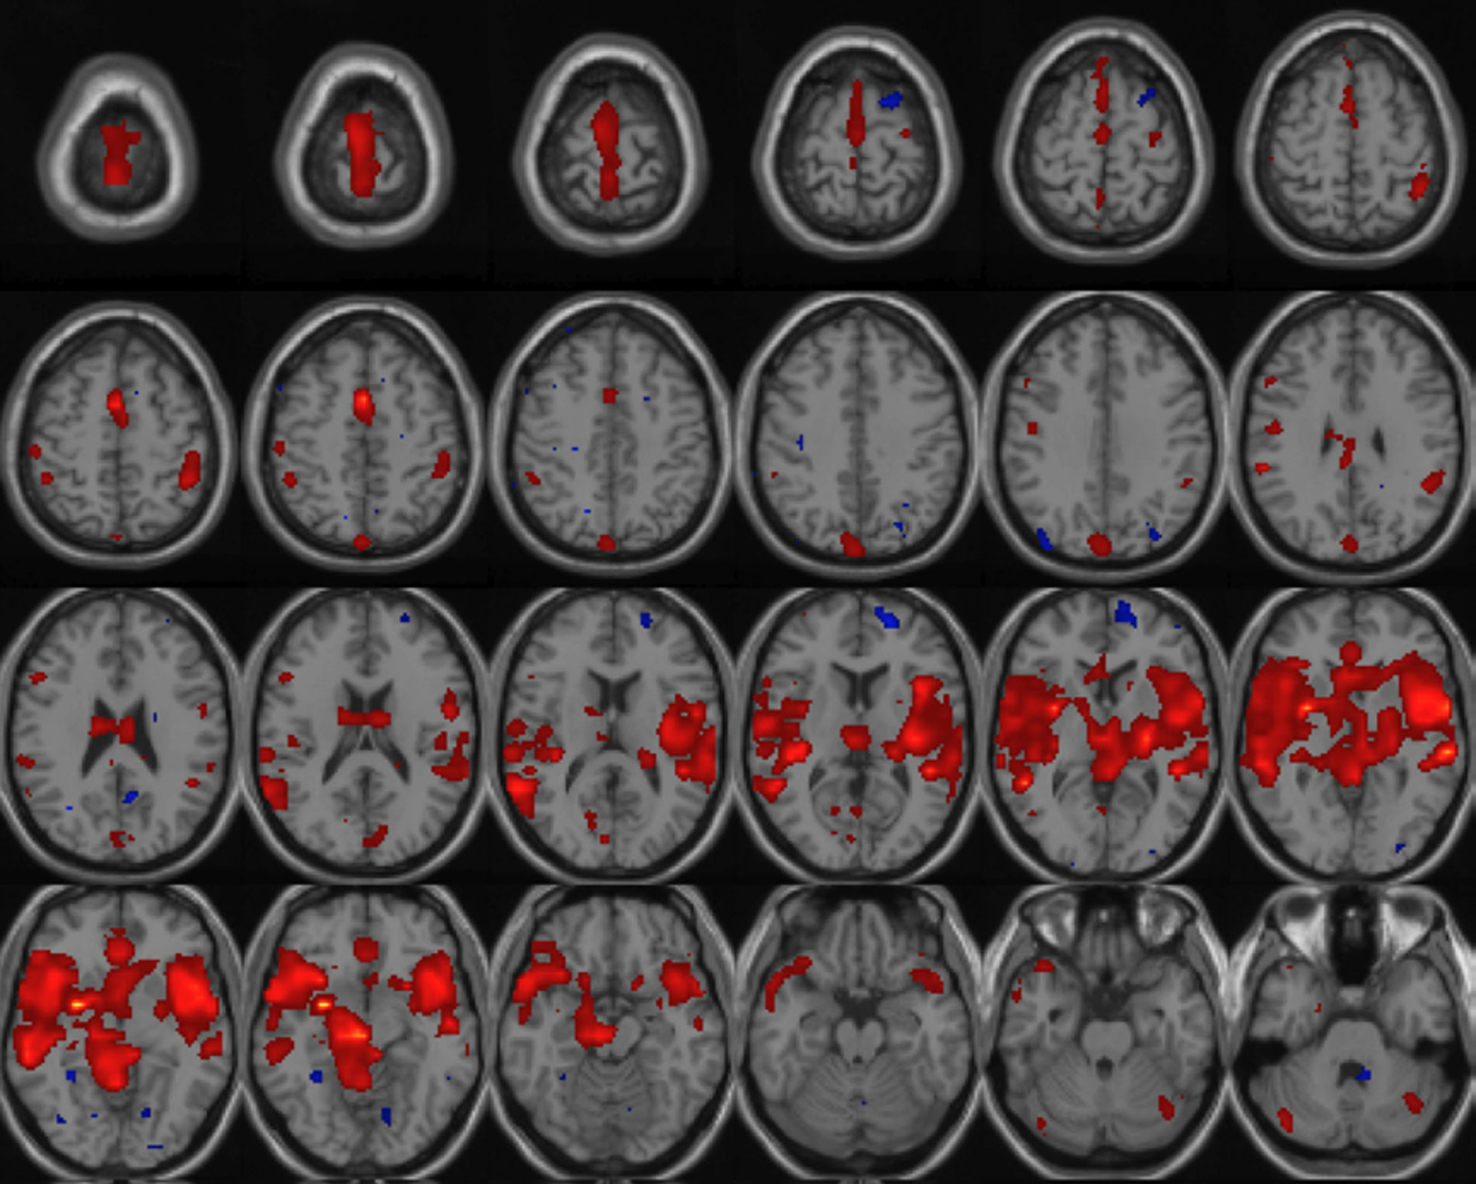
Figure 7. One sample t-test calculated on 12 images (six healthy and six schizophrenics) with a T-threshold of 1. 5 applied to the t-map.
Case Study Three: Classification
In this case study, the entire system can be tested, including determining selection criteria for each group, ensuring that first and second level analyses are performed and available, after which, a further classification analysis is performed. In this example, a class mean is used to classify a given image by computing the distance from the mean of each of the input groups.
To illustrate the method, we use five subjects from a healthy group and five subjects from schizophrenics group and two subjects from an unknown group that needs to be classified. Based on the Euclidean distance measure, both the unknown subjects belonged to the first group (Figure 8
).
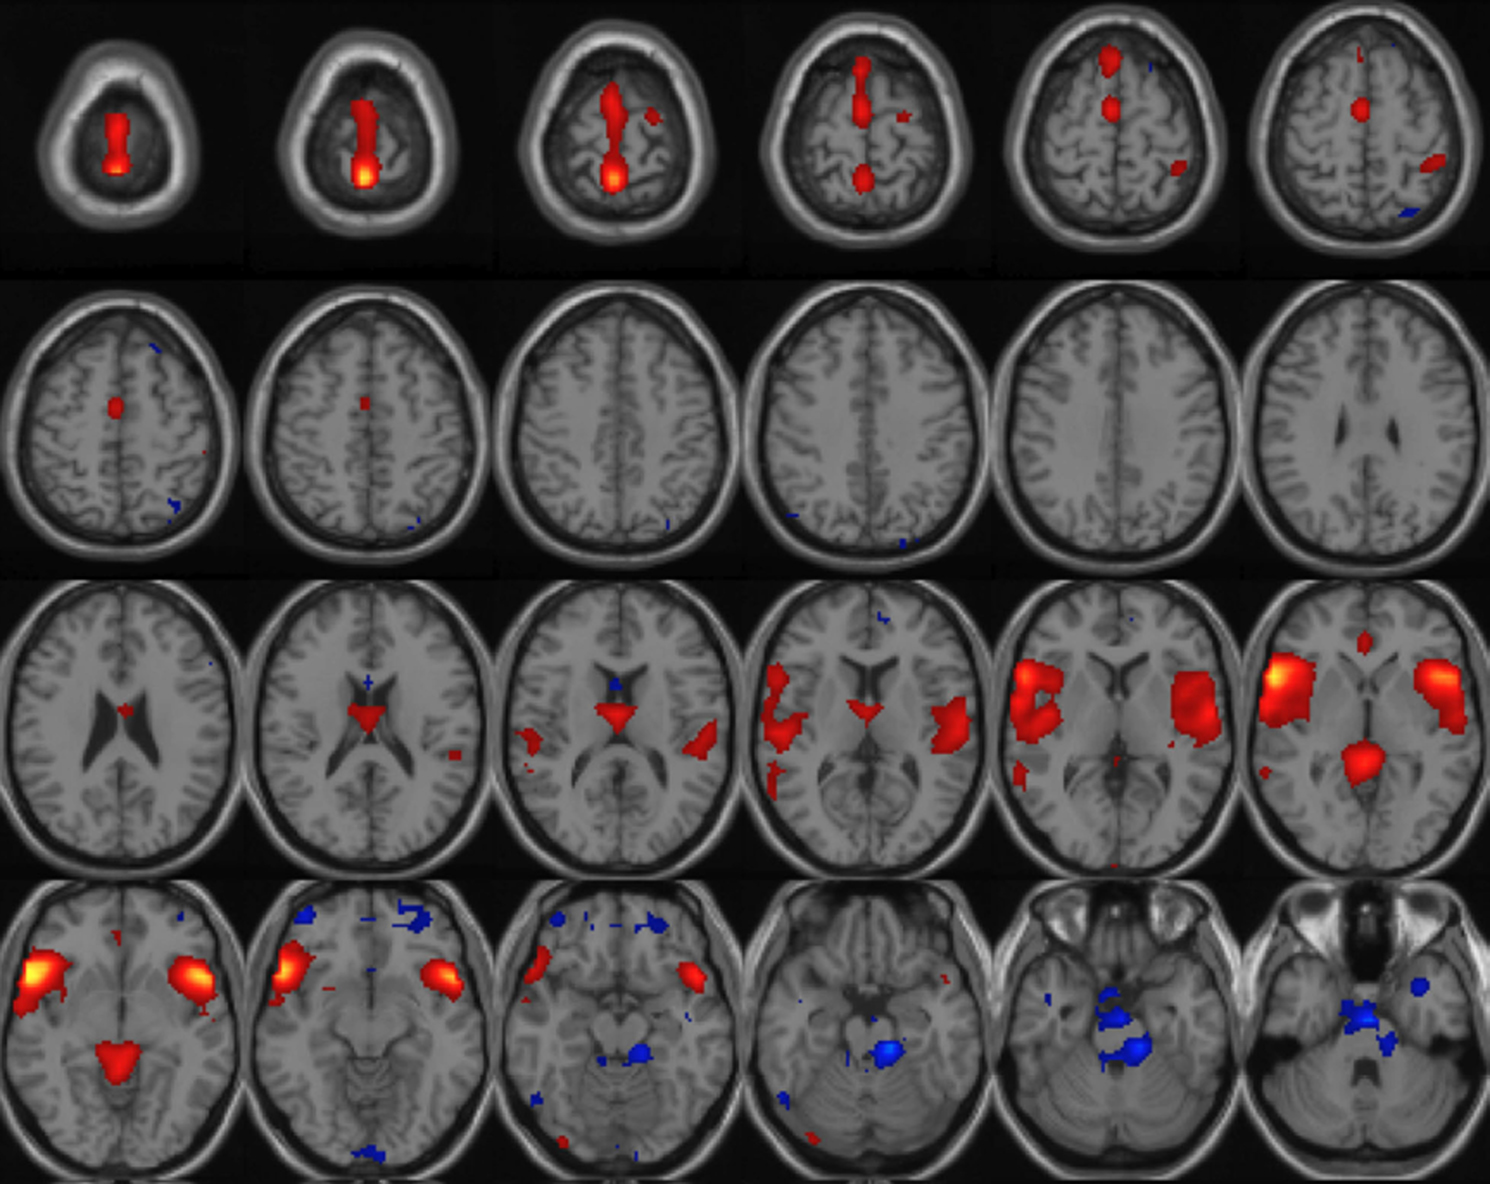
Figure 8. Class mean run on five healthy, five schizophrenics and two images unknowns. Image shown is the mean image of group 1 thresholded at 1.0.
This novel workflow utilizes a custom web application client that communicates with a database back-end along with a custom DICOM receiver that permits the end-user to conduct real-time annotation of neuroimaging data during acquisition. The user has the ability to annotate each imaging series with metadata such as the order of events, whether or not the event was completed, whether or not the end-user thinks that the imaging data is usable for analysis, and any other notes or relevant information. In addition, the web application allows the end-user to upload auxiliary data, such as stimulus response time files, supporting video or other files that may be needed for full analysis of functional neuroimaging datasets.
For automated image analysis to be feasible in the NI framework presented here, the protocol metadata (what type, kind, and condition an imaging run belongs to) and the usability of an imaging session, are needed to perform analyses. As soon as the end-user has set the status of an imaging session to usable, an automated process evaluates the constraints of the protocol, metadata, and usability status in order to execute the appropriate image analysis pipeline. In functional imaging runs where behavioral data is needed to process activation maps, when the end-user attaches the behavioral data, it triggers the functional imaging pipeline processing. The other strength of managing research protocols is the ability to monitor and enforce compliance as well as provide a platform for QA.
Since we have integrated this annotation tool with a DICOM receiver, and a comprehensive RDBMS, we are able to provide end-users with rich metadata associated with each neuroimaging session and run. This integration of annotation along with comprehensive NI tools that combine clinical, socio-demographic, and neuropsychological data sources collected in a study greatly enhances the usability of data and establishes the foundation for efficient, semantic-based retrieval of complex images via a secure web application. When combined with fully automated image analyses, this annotation tool can serve as a powerful quality control mechanism for the end-user to flag problematic cases or guide automated procedures and subsequent users of the data with pertinent information that may otherwise be lost, such as protocol deviations, subject noncompliance, poor data acquisition, etc.
We have developed a capability to handle queries within and across research studies for all data domains stored in the MRN database. The user is able to select assessment criteria, such as the instrument, the visit type, the field, an operator and a value. The result is a filtered list of subjects for which the user is then prompted for what data they want reported. Following that step, the user is able to select and report all of the data sources available on that filtered list of subjects. Finally, the user may export the data in a format that suits their needs (CSV, SAS, SPSS, XCEDE, or custom format). This capability permits extensive customized querying, and given that it may be used across all data sources from all studies stored in the MRN database, it will prove to be an invaluable tool, forming the foundation for planned data mining activities. Once queries take place they can be saved and run again to reflect new subjects being available, and finally the queries can be leveraged to plan and execute meta-analyses across all subjects and research studies permitting analyses of individual data sources that were not envisioned by the investigator that may have collected the original data.
Within an active study, the NI system provides investigators with a tool to manage and evaluate the quality of their data through the structured protocol schema and its associated display. The user may evaluate their study both on a subject-by-subject basis and by viewing a summary of the study as a whole. In the near future, this tool will further lead to the implementation of automated quality control mechanisms that can flag suspicious data for review by a human expert and collect the results of their assessment. The image processing module is especially advantageous because it helps people to perform a quick group comparison and classification within the database and thus avoids the need to use analysis packages for doing these diagnostic tests. Furthermore, the database-driven analysis will grant a more detailed on-the-fly analysis of the quality of the existing data to provide insight into the progress of a given study as well as supporting the likelihood of a hypothesis proposed for future studies.
We believe this novel framework represents an enormous step toward the efficient mining of large scale heterogeneous translational neuroscience research. Data mining of such large NI repositories can lead to the creation of classifiers with the ability to perform diagnosis, predict treatment outcomes, and identify novel targets for pharmaceuticals. We provided a data mining example of classification, but current users are also using the NI system to perform clustering, regression, and associative rule learning. Ultimately this type of mining should hasten translation neuroscience discoveries to 1 day lead to better treatments, cures, and more complete understanding of the basic neurosciences.
The authors declare that the research was conducted in the absence of any commercial or financial relationships that could be construed as a potential conflict of interest.
This research was supported by DOE DE-FG02-99ER6274, NIH 1R01EB006841, NIH U24RR021992, and NIH U54EB005149. The authors thank the Mind Clinical Imaging Consortium members for data collection and support of the scientists and engineers involved in the project.
Amari, S.-I., Beltrame, F., Bjaalie, J. G., Dalkara, T., De Schutter, E., Egan, G. F., Goddard, N. H., Gonzalez, C., Grillner, S., Herz, A., Hoffmann, K. P., Jaaskelainen, I., Koslow, S. H., Lee, S. Y., Matthiessen, L., Miller, P. L., Da Silva, F. M., Novak, M., Ravindranath, V., Ritz, R., Ruotsalainen, U., Sebestra, V., Subramaniam, S., Tang, Y., Toga, A. W., Usui, S., Van Pelt, J., Verschure, P., Willshaw, D., and Wrobel, A. (2002). Neuroinformatics: the integration of shared databases and tools towards integrative neuroscience. J. Integr. Neurosci. 1, 117–128.
Aroian, L. A., and Levene, H. (1950). The effectiveness of quality control charts. J. Am. Stat. Assoc. 45, 520–529. Available at: http://www.jstor.org/stable/2280720
.
Bockholt, H. J., Ling, J., Scully, M., Magnotta, V. A., Gollub, R. L., White, T., Schulz, S. C., Lauriello, J., and Andreasen, N. C. (2007). MIND Clinical Imaging Consortium as a Case Study of Novel Multi-Center Neuroinformatics Software. Colorado Springs: International Congress on Schizophrenia Research.
Demirci, O., Clark, V. P., Magnotta, V., Andreasen, N. C., Lauriello, J., Kiehl, K. A., Pearlson, G. D., and Calhoun, V. D. (2008). A review of challenges in the use of fMRI for disease classification/characterization and a projection pursuit application from multi-site fMRI schizophrenia study. Brain Imaging and Behav. 2, 207–226.
Jovicich, J., Beg, M. F., Pieper, S., Priebe, C., Miller, M. M., Buckner, R., Rosen, B., and Birn, B. M.(2005). Biomedical Informatics Research Network: Integrating Multi-Site Neuroimaging Data Acquisition, Data Sharing and Brain Morphometric Processing. The 18th IEEE International Symposium on Computer-Based Medical Systems, Dublin, 288–293.
Kim, D., Manoach, D. S., Mathalon, D., Turner, J., Brown, G., Ford, J. M., Gollub, R. L., White, T., Wible, C. G., Belger, A., Bockholt, H. J., Clark, V. P., Lauriello, J., O’Leary, D., McCarthy, G., Mueller, B., Lim, K., Andreasen, N. C., Potkin, S., and Calhoun, V. D. (2009). Dysregulation of working memory and default-mode networks in schizophrenia during a Sternberg item recognition paradigm: an independent component analysis of the multisite Mind and fBIRN studies. Hum. Brain Mapp. 30, 3795.
Segall, J. M., Turner, J. T., Van Erp, T., White, T., Bockholt, H. J., Gollub, R. L., Ho, B. C., Magnotta, V., Jung, R., McCarley, R., Schulz, S. C., Lauriello, J., Clark, V. P., Voyvodic, J., Diaz, M. T., and Calhoun, V. D. (2009). Voxel-based morphometric multi-site collaborative study on schizophrenia. Schizophr. Bull. 35, 82–95.
Spiring, F., (2007). Introduction to statistical quality control (5th Edn.), by Douglas C. Montgomery. Technometrics 49 (1), 108–109. Available at: http://www.ingentaconnect.com/content/asa/tech/2007/00000049/00000001/art00026
.