
- 1 Vision Lab, The School of Psychology, University of St Andrews, St Andrews, Fife, Scotland, UK
- 2 Man-Machine Interaction Group, Faculty of Electrical Engineering, Mathematics, and Computer Science, Delft University of Technology, Delft, Netherlands
Our forward-facing eyes allow us the advantage of binocular visual information: using the tiny differences between right and left eye views to learn about depth and location in three dimensions. Our visual systems also contain specialized mechanisms to detect motion-in-depth from binocular vision, but the nature of these mechanisms remains controversial. Binocular motion-in-depth perception could theoretically be based on first detecting binocular disparity and then monitoring how it changes over time. The alternative is to monitor the motion in the right and left eye separately and then compare these motion signals. Here we used an individual differences approach to test whether the two sources of information are processed via dissociated mechanisms, and to measure the relative importance of those mechanisms. Our results suggest the existence of two distinct mechanisms, each contributing to the perception of motion-in-depth in most observers. Additionally, for the first time, we demonstrate the relative prevalence of the two mechanisms within a normal population. In general, visual systems appear to rely mostly on the mechanism sensitive to changing binocular disparity, but perception of motion-in-depth is augmented by the presence of a less sensitive mechanism that uses interocular velocity differences. Occasionally, we find observers with the opposite pattern of sensitivity. More generally this work showcases the power of the individual differences approach in studying the functional organization of cognitive systems.
Introduction
Although a great deal is known about binocular vision and the brain mechanisms responsible for depth perception from binocular disparity (Cumming and DeAngelis, 2001; Howard, 2002; Howard and Rogers, 2002), understanding how binocular vision is used to perceive motion-in-depth is a current controversial area in vision research (see Harris et al., 2008). Theoretically, motion-in-depth may be derived either from changes in binocular disparity over time (CDOT) or by using the differences in motion at the left and right eye that occur when objects move in depth. These motion differences are usually referred to as interocular velocity differences (IOVD)(Regan, 1993; Cumming and Parker, 1994). The above distinction is one of order of processing (see Figure 1). In a CDOT-sensitive mechanism, the rate of change of binocular disparity with respect to time is detected. In an IOVD-sensitive mechanism, the motion of each retinal image, in each eye, is first detected and then the difference between the motions in the two eyes is derived. The equivalence can be described as:

In this equation, r and l stand for the retinal position of a visual target in the right and left eye respectively, t stands for time and d is the derivative operator, (r − l) is the binocular disparity. The left-hand side of the equation thus represents motion-in-depth from CDOT and the right-hand side represents motion-in-depth from IOVD.
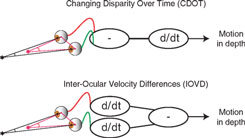
Figure 1. Top: The difference in the retinal position relative to the surround (disparity) of a target is calculated first and then the derivative with respect to time is taken (CDOT). Bottom: The derivative of the retinal position of the target with respect to time is taken for each eye after which the difference is taken (IOVD).
There is a growing body of evidence that the human visual system may be sensitive to both CDOT (Regan, 1993; Cumming and Parker, 1994; Gray and Regan, 1996; Maeda et al., 1999) and IOVD (e.g., Maeda et al., 1999; Shioiri et al., 2000; Brooks, 2002; Brooks and Stone, 2004; Shioiri et al., 2008, 2009) although the evidence is often indirect and a number of studies are apparently contradictory (reviewed by Harris et al., 2008). Much current and past research has focused on the proof of existence of CDOT or IOVD mechanisms and their characteristics. A drawback of many of these studies is that it is very difficult to successfully isolate the CDOT and IOVD information (e.g., see Allison and Howard, 2000; Nefs and Harris, 2010). Another problem is that many studies have explored only one cue in detail (for example Shioiri et al., 2000, 2009), or designed stimuli that may not constitute a completely fair comparison of the two sources of information (e.g., Cumming and Parker, 1994). Recent work suggests that there may be two separate motion-in-depth mechanisms, and that they have different temporal frequency characteristics (Shioiri et al., 2008). Here we took a different approach to the question. Using individual differences, we tested to what extent the abilities to use CDOT and IOVD are independent of each other, by testing motion-in-depth discrimination for a large number of naïve observers.
Until very recently, the use of individual difference approaches in vision research has been very much neglected (but see Kosslyn et al., 2002; Wilmer, 2008). The logic is that if distinct mechanisms exist for processing stimuli along some dimension, they should be revealed by separable patterns of sensitivity across a population of observers: some visual systems will display better sensitivity for one mechanism than another. It is the pattern of individual differences that allows the separate mechanisms to be revealed (or not). Some years ago, this logic was used elegantly to demonstrate independent spatial frequency channels in adults and infants (e.g., Peterzell et al., 1995; Peterzell and Teller, 1996). We were interested in the extent to which sensitivities to CDOT and IOVD information differ between individuals. If a single mechanism underlies the perception of motion-in-depth from CDOT and IOVD, we expect a strong correlation between performances for stimuli that isolate each of them. If distinct mechanisms exist, the correlation would likely be very low. In other words, we make the assumption that more than a single processing channel exists for the perception of motion-in-depth, and that the natural variability between observers will be large enough to reveal those separate channels. The first assumption follows from the extant literature, where some studies have found convincing evidence for a sensitive CDOT-based mechanism, but not a sensitive IOVD-based mechanism (e.g., Cumming and Parker, 1994) and others have found evidence for an IOVD-based mechanism (e.g., Shioiri et al., 2000, 2008, 2009). The second assumption follows from our own recent work (Nefs and Harris, 2010), where even when only five observers were tested using a two-frame motion-in-depth task, we found quite distinct patterns of performance between them.
Many experiments in vision research, including our own work (e.g., Nefs and Harris, 2007, 2008, 2010), and much of the work on motion-in-depth (e.g., Shioiri et al., 2008, 2009), focus on studying a small number of highly trained observers. This does require excluding individuals who cannot perform the required tasks. In studies of binocular vision, it is accepted that observer exclusion occurs often, and is backed up by literature suggesting that up to 20% of people have relatively poor stereo vision (Hokoda, 1985). Our most recent work hints that separate processing mechanisms for motion-in-depth might be utilized by different observers (Nefs and Harris, 2010), as does more clinically focused work on the perception of motion-in-depth in strabismus (e.g., Maeda et al., 1999; Watanabe et al., 2008), but it is not yet clear what proportion of the population may use each mechanism. If different observers do use different mechanisms, then a population study is essential to establish the prevalence of the use of each mechanism across the normal population. The individual difference approaches therefore delivers both a method of establishing the independence of putative processing mechanisms, and a measure of what proportion of individuals may be able to use them effectively.
For each observer, we measured motion-in-depth discrimination for stimuli containing CDOT information, IOVD information or both. We looked for correlations between thresholds for pairs of stimulus types. If two mechanisms contribute to motion-in-depth discrimination we expect strong correlations between thresholds for the stimuli containing both sources of information, and each of the other two stimulus types. Further, if the mechanisms are limited by independent noise, we expect no correlation between thresholds for stimuli containing CDOT information compared with those for IOVD information.
Materials and Methods
Participants
There were 63 (24 male and 38 female) naive participants who were recruited via posters and the online participant pool at the School of Psychology, University of St Andrews. One of these, although naïve, was an expert observer from the Vision Lab, with experience of participating in many hours of motion-in-depth experiments. Informed written consent was obtained from all participants. Permission for this work was granted from the St Andrews University Teaching and Research Ethics Committee (UTREC). No a priori screening of participants was carried out except for photosensitive epilepsy. One potential participant was not included because she had an exceptionally large, uncorrected, refraction error (>8 dioptres) in one eye and a second potential participant was not included because he failed the texture discrimination task (see below).
Stimulus Conditions
Our aim here was to devise stimuli that constituted a “fair” comparison between CDOT and IOVD information. There are two ways to approach what constitutes a fair comparison. The first is to use stimuli that equivalently stimulate each mechanism. For example, one could choose a motion extent, speed, duration etc that delivers the same multiple of threshold for CDOT and IOVD. This is difficult to do without already knowing the characteristics of the two putative mechanisms in detail, as well as the likely range of individual differences. We therefore did not use this procedure.
A second approach (and one that we have successfully applied to two-frame motion-in-depth, Nefs and Harris, 2010), is to equate the stimuli to make them as physically equal as possible. For example if a point moves through 5.1 min arc on the retina in a stimulus that isolates CDOT, we should also use points that move through 5.1 min arc on each retina in the stimulus that isolates IOVD. This is the approach we take here, also keeping as many stimulus characteristics as possible constant across stimulus types (dot size, density, number, overall stimulus size, duration etc).
All stimuli consisted of two planes of random dots, one above the other (Figure 2, top). We simulated motion-in-depth in the two planes, in opposite directions, that is, one always moved toward and the other moved away from the observer. Although CDOT and IOVD invariably occur together in the natural world, it is possible to separate them in the laboratory. We used three different visual stimuli: Random Dot Stereograms (RDS), containing both CDOT and IOVD information, Dynamic Random Dot Stereograms (DRDS), containing only CDOT information, and Time Correlated Random Dot Stereograms (TCRDS), containing only IOVD information. Figure 2 (bottom) shows the logic of how these three stimuli were created.
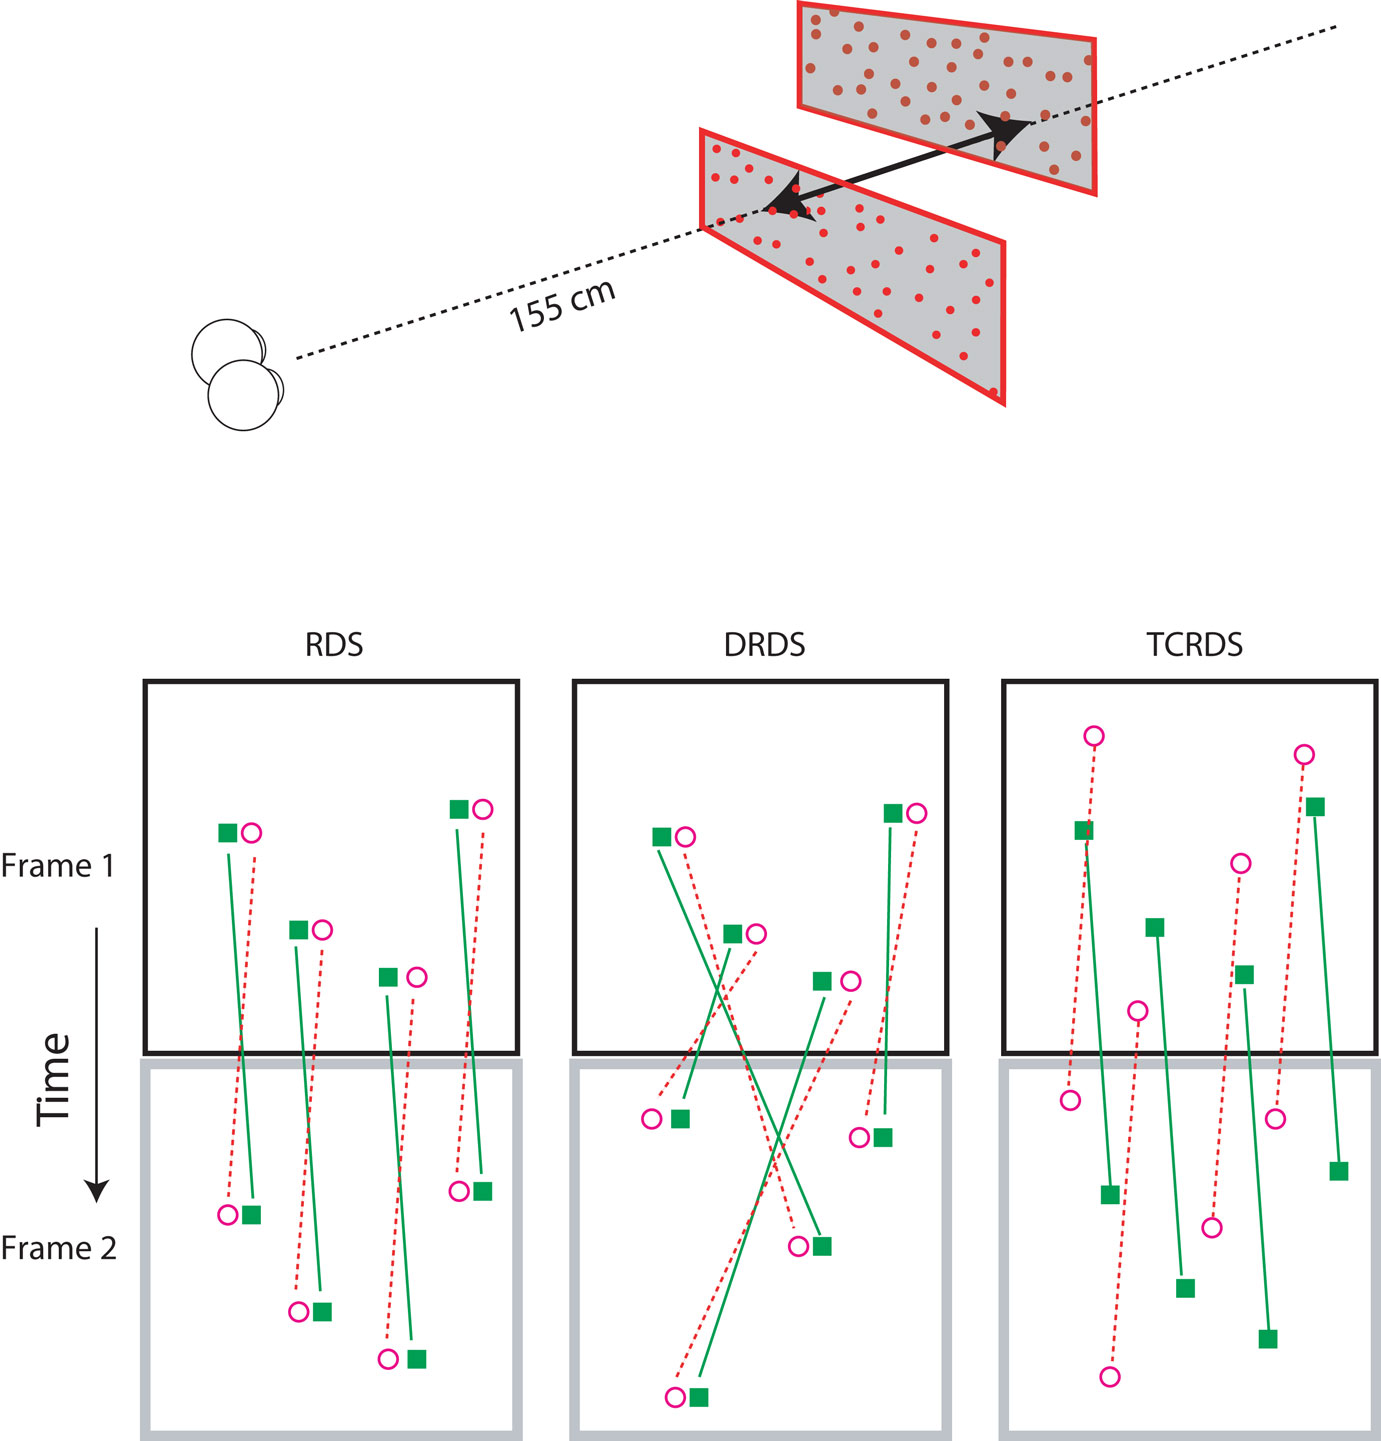
Figure 2. Top: The stereograms simulated motion-in-depth of two panels of dots moving in opposite directions. Bottom: The motion-in-depth is signaled by either a RDS (left panel), a DRDS (middle panel), or a TCRDS (right panel). The filled squares represent dots in the left eye and the open circles are the dots in the right eye. Figure reprinted with permission from Nefs and Harris (2010).
In a RDS (containing both cues) the dots are correlated across the eyes and across time. When motion-in-depth occurs, toward or away from an observer, then from one video frame to the next each binocular dot-pair undergoes the same change in position in the left and right eye (and hence its disparity), and the dots move in opposite directions in the two eyes views, delivering a motion signal to each eye. Note that none of our stimuli contained any sources of monocular information about motion-in-depth (for example, the increase in size of the retinal image of an object as it approaches, usually referred to as looming). We were specifically testing the contribution of the binocular sources of information about motion-in-depth. Of course, this means that our stimuli provide a source of cue-conflict. This could partly explain why a proportion of the population struggle to see motion-in-depth from RDS stimuli.
In a DRDS (CDOT cue), the dots are correlated between the eyes on each video frame, and the disparity between each dot-pair undergoes the same change over time, as for the RDS. But binocular pairs of dots are randomly relocated in every new video frame to remove consistent monocular motion (and hence also IOVD information). With one eye closed, the observer sees random motion in all possible directions.
In a TCRDS (IOVD cue), the dots are uncorrelated between the eyes, resulting in no consistent binocular disparity information (and hence no CDOT cue). The dots do move consistently in opposite directions in the two eyes, so that with one eye closed, consistent lateral motion is perceived.
Stimulus Design and Procedure
We measured direction discrimination thresholds for motion-in-depth using the method of constant stimuli. Participants were seated 155 cm from a 19-inch Iiyama Vision Master Pro 455 monitor (resolution 1280 × 1024 pixels, refresh rate 85 Hz) in a darkened room.
The outline of the monitor was visible in the dark. The stimuli consisted of two panels of random dots, one above the other. Each panel contained 500 dots and measured 10.09° wide by 2.66° high at a distance of 155 cm. Each dot measured 5 × 5 pixels (3.2 × 3.2 min of arc). The panels were vertically separated by a small blank (black) region, 1.4 cm (0.5°) high. In each trial, the two panels contained the same pattern of dots as each other, but the simulated motion-in-depth was in opposite directions. The participant wore red/green glasses with the red lens in front of the right eye. The luminance of the dots as seen through the red lens was 4.0 and 4.15 cd/m2 as seen through the green lens. Each stimulus frame lasted four monitor frames (47 ms, 21.25 Hz). The two panels were exposed for a total of 3.01 s (64 stimulus frames) and simulated motion occurred in opposite directions in depth from −10.2 to +10.2 min of arc relative disparity, passing through zero disparity at the midpoint of the trial. The corresponding speed of each signal point on each retina (for RDS and TCRDS) was thus 3.39 min arc/s and the change in binocular disparity or interocular velocity was thus 6.78 min arc/s. After the stimulus motion, the screen went black until the participant responded. The participant was asked to indicate the direction of motion of the upper panel (toward/away) via key presses on the computer keyboard. No fixation crosses were presented at any time during the experiment.
We varied the proportion of “signal” and “noise” dots across trials. Signal dots underwent a continuous disparity change (in RDS and DRDS) and/or continuous monocular motion (RDS and TCRDS) across all 64 stimulus frames, as illustrated in Figure 2. Noise dots were randomly positioned in each eye and randomly repositioned in each stimulus frame, so that they did not correspond between the two eyes or across stimulus frames. This is a classic method used in visual psychophysical experiments, to manipulate signal strength without resorting to measuring performance at the minimum perceivable signal. For example, this technique has been used to measure global motion coherence (Watamaniuk et al., 1989), binocular correlation detection (Cormack et al., 1991; Palmisano et al., 2006), and stereoscopic visual efficiency (Harris and Parker, 1992, 1994a,b, 1995). Pilot data collected on four observers were used to define 10 signal levels that the stimuli could take: 0, 7, 14, 21, 28, 35, 42, 49, 56, 63% signal dots for RDS and DRDS stimuli and 0, 11, 22, 33, 44, 55, 67, 78, 89, 100% signal dots for TCRDS. Each signal level was repeated 32 times for RDS, DRDS, and TCRDS stimuli and was counterbalanced for the direction of motion-in-depth. To prevent order effects causing correlation in the data the order of testing was always: RDS, DRDS, TCRDS, TEXTURE. Prior to the main experiments we assessed participants’ vision and they filled out a questionnaire.
Questionnaire and Vision Tests
All participants filled in a 39-item questionnaire about personal background, self-ratings for vision, glasses, ophthalmologic history, psychotropic medication, state of mind, etc. We also ran a small battery of vision tests for all observers prior to the main experiments. These tests included: a reading test for near acuity (30 cm), far (3 m/10 ft) acuity (Bach, 1996), cover tests for strabismus and phoria, color vision (Ishihara, 1979), static disparity (TNO, 1972; Stereo Optical Co, 1988), nystagmus, and eye dominance [sighting test, binocular rivalry, and aniseikonia (difference in far acuity between the right and left eye)]. Only the correlation between far acuity of the right eye and DRDS thresholds (p = 0.002) had a p-value lower than 0.01.
Texture Discrimination Control Experiment
We ran a control experimental condition, to test the extent to which factors unrelated to depth or motion perception (e.g., visual acuity, contrast sensitivity, motivation) contributed to correlations found between the main experimental conditions. For the texture control, all experimental details were the same as in the main experiments. The only difference was that the dots were always binocularly correlated, with zero disparity, and were not moving. The dot densities of the upper and lower panels were slightly different. The participants still wore the anaglyph glasses even though this was not necessary for the task. We measured dot density discrimination thresholds with the method of constant stimuli in ten difficulty levels with 32 repetitions at each level.
Preliminary Analysis
Cumulative Gaussian functions were fitted to the performance data with the mean and the slope as free parameters. We defined the discrimination threshold as the percentage of signal dots necessary to detect the direction of motion-in-depth with a 75% probability of being correct. In the texture discrimination task we fitted cumulative Gaussian functions as a function of the dot density difference with the mean fixed at 0% and the slope as a free parameter. The texture discrimination threshold was defined as the 75% probability of responding, “upper panel has the larger dot density”. Many estimated thresholds calculated via this method were very high: well above the largest signal level tested, and the reliability of the threshold estimate became poorer as threshold increased. We had to choose what thresholds would be considered “acceptable” for inclusion in the summary dataset. We chose 100% signal as the maximum allowable signal to reach 75% correct response threshold, along with the requirement that observers had to deliver a threshold at or below this limit for all three stimulus conditions.
Results
We found large individual differences in sensitivity to the different signals that delivered motion-in-depth information. Eight out of a total of 62 participants did not reach threshold performance for perceiving motion-in-depth in any of the three stimuli. Forty-seven observers (76%) reached acceptable thresholds levels for the RDS, 48 for the DRDS (77%), and 33 for the TCRDS (53%). Surprisingly, we also found a substantial number of observers who could reliably detect motion-in-depth in RDS and either DRDS or TCRDS stimuli, but not in both (14 and 1 respectively). In total 29 people achieved acceptable threshold performance (as defined above), or better, for all three conditions. Notice that one data point in each plot of Figure 3 is colored black. These points show thresholds for our expert (Vision Lab member) observer. Although she was amongst the observers with the lower thresholds, her performance was by no means the very best, suggesting that experience and practice in motion-in-depth tasks is not the only factor contributing to good performance. That some naïve observers performed better than our expert also demonstrates that extensive practice is not required for some people to be very good at this task.
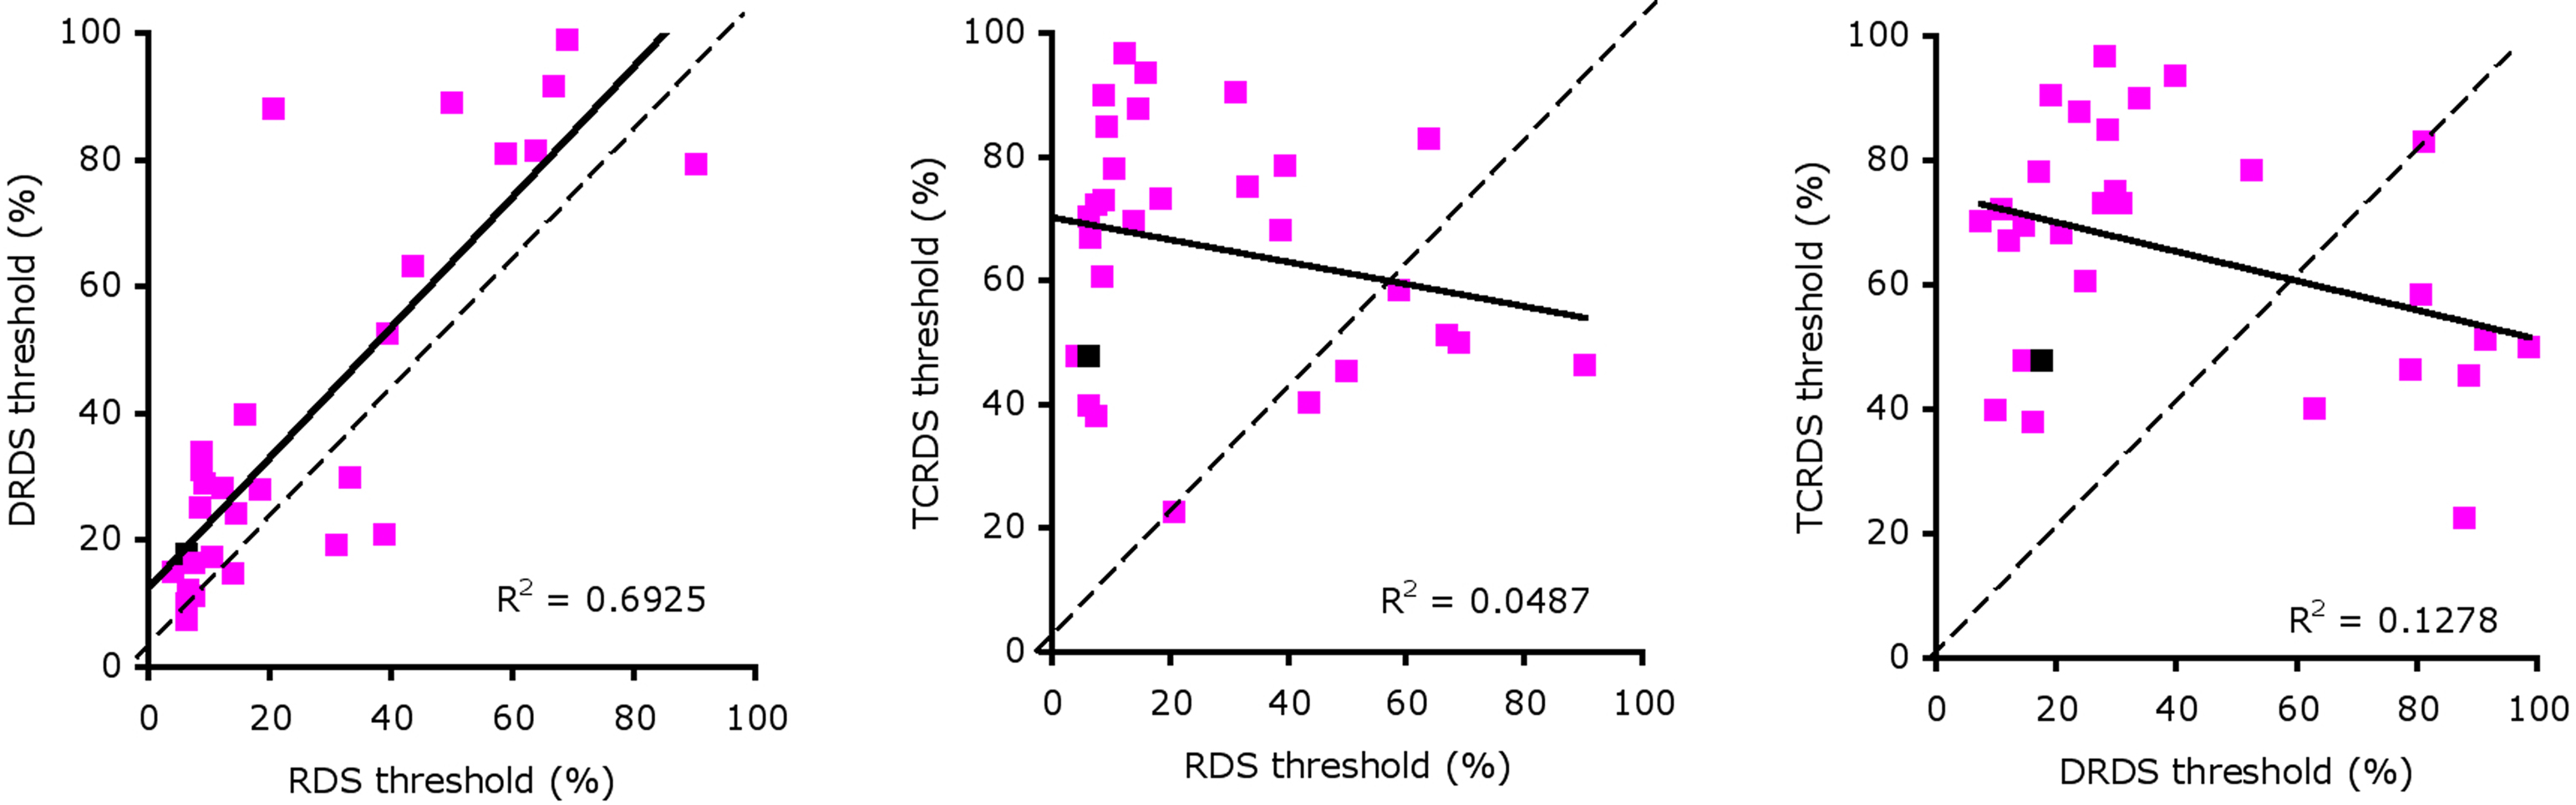
Figure 3. Scatterplots of thresholds for: RDS against DRDS (left), RDS against TCRDS (center), and DRDS against TCRDS (right). The solid line is the best fitting type II linear regression between the two variables.
We performed correlations between thresholds for pairs of stimulus type (RDS, DRDS, TCRDS) to look for evidence of a single mechanism, or multiple mechanisms underlying performance. If a single mechanism were responsible, we would expect strong correlations for all three pairings. If two independent mechanisms were at work, we would expect no strong correlation between DRDS and TCRDS (similar logic has recently been applied to exploring the basis of consonance, in music perception (McDermott et al., 2010). Figure 3 illustrates scatter plots showing the relationships between thresholds for the three types of stimuli, for the 29 observers whose thresholds were 100% signal or below for all three conditions.
We calculated the best fitting type II regression lines between the RDS, DRDS, and TCRDS data and found a large R2 between RDS and DRDS thresholds (Figure 3, left, R2 = 0.693, p = 1.3 × 10⁻⁸), but not between RDS and TCRDS (R2 = 0.049, p = 0.249) nor, interestingly, between DRDS and TCRDS (R2 = 0.128, p = 0.056). This pattern of data does not correspond clearly to either of the predictions discussed above.
We then explored how performance for the motion-in-depth task correlated with our control texture task, to determine the involvement of factors unrelated to the processing of motion-in-depth. Texture discrimination thresholds were very poorly correlated with RDS thresholds (R2 = 0.018, p = 0.487), TCRDS thresholds (R2 = 0.035, p = 0.331) and with DRDS detection thresholds (R2 = 0.013, p = 0.556), suggesting that attention, visual acuity, or other non-motion-related visual factors cannot account for the correlations shown in Figure 3.
It could be argued that, as we found only a strong correlation between thresholds for RDS and DRDS stimuli, the pattern of data suggests a single neural mechanism, dominated by the CDOT signal. To explore whether we had any evidence that more than one factor underlies performance, we took three separate approaches. First, we employed a principal components analysis on thresholds for each of the three conditions. This revealed two substantial principal components. The first two principal components accounted for 95% of the total variance, of which 67% was accounted for by the first component and 26% was accounted for by the second component (eigenvalues were 2.04, 0.80 and 0.16 for the three principal components respectively). This suggests that there is more than a single mechanism at work.
Second we explored whether thresholds for RDS stimuli were significantly better than those for DRDS stimuli: this is what we would expect if two mechanisms were available for processing of the former stimulus, and only one for the latter. Notice that most data points sit above the equal threshold dotted line in Figure 3 (left panel), demonstrating that RDS thresholds are, on the whole, indeed lower than DRDS thresholds. A t-test revealed that thresholds were significantly lower for the RDS stimulus (p = 0.0001).
Our third approach was to split the data into two groups, based on observers’ ability to use CDOT information only, because this appears to be the dominant source of information for most observers. Group 1 consisted of observers with above average thresholds (pink squares in Figure 4, left) and Group 2 below average thresholds for the DRDS stimulus (blue diamonds). Notice that almost all observers in Group 1 also have above average thresholds for the RDS stimuli. If we split the observer population on the basis of above/below average for TCRDS, rather than DRDS, no such pattern emerges (Figure 4, right). Good performance for TCRDS thus does not predict performance for the RDS condition.
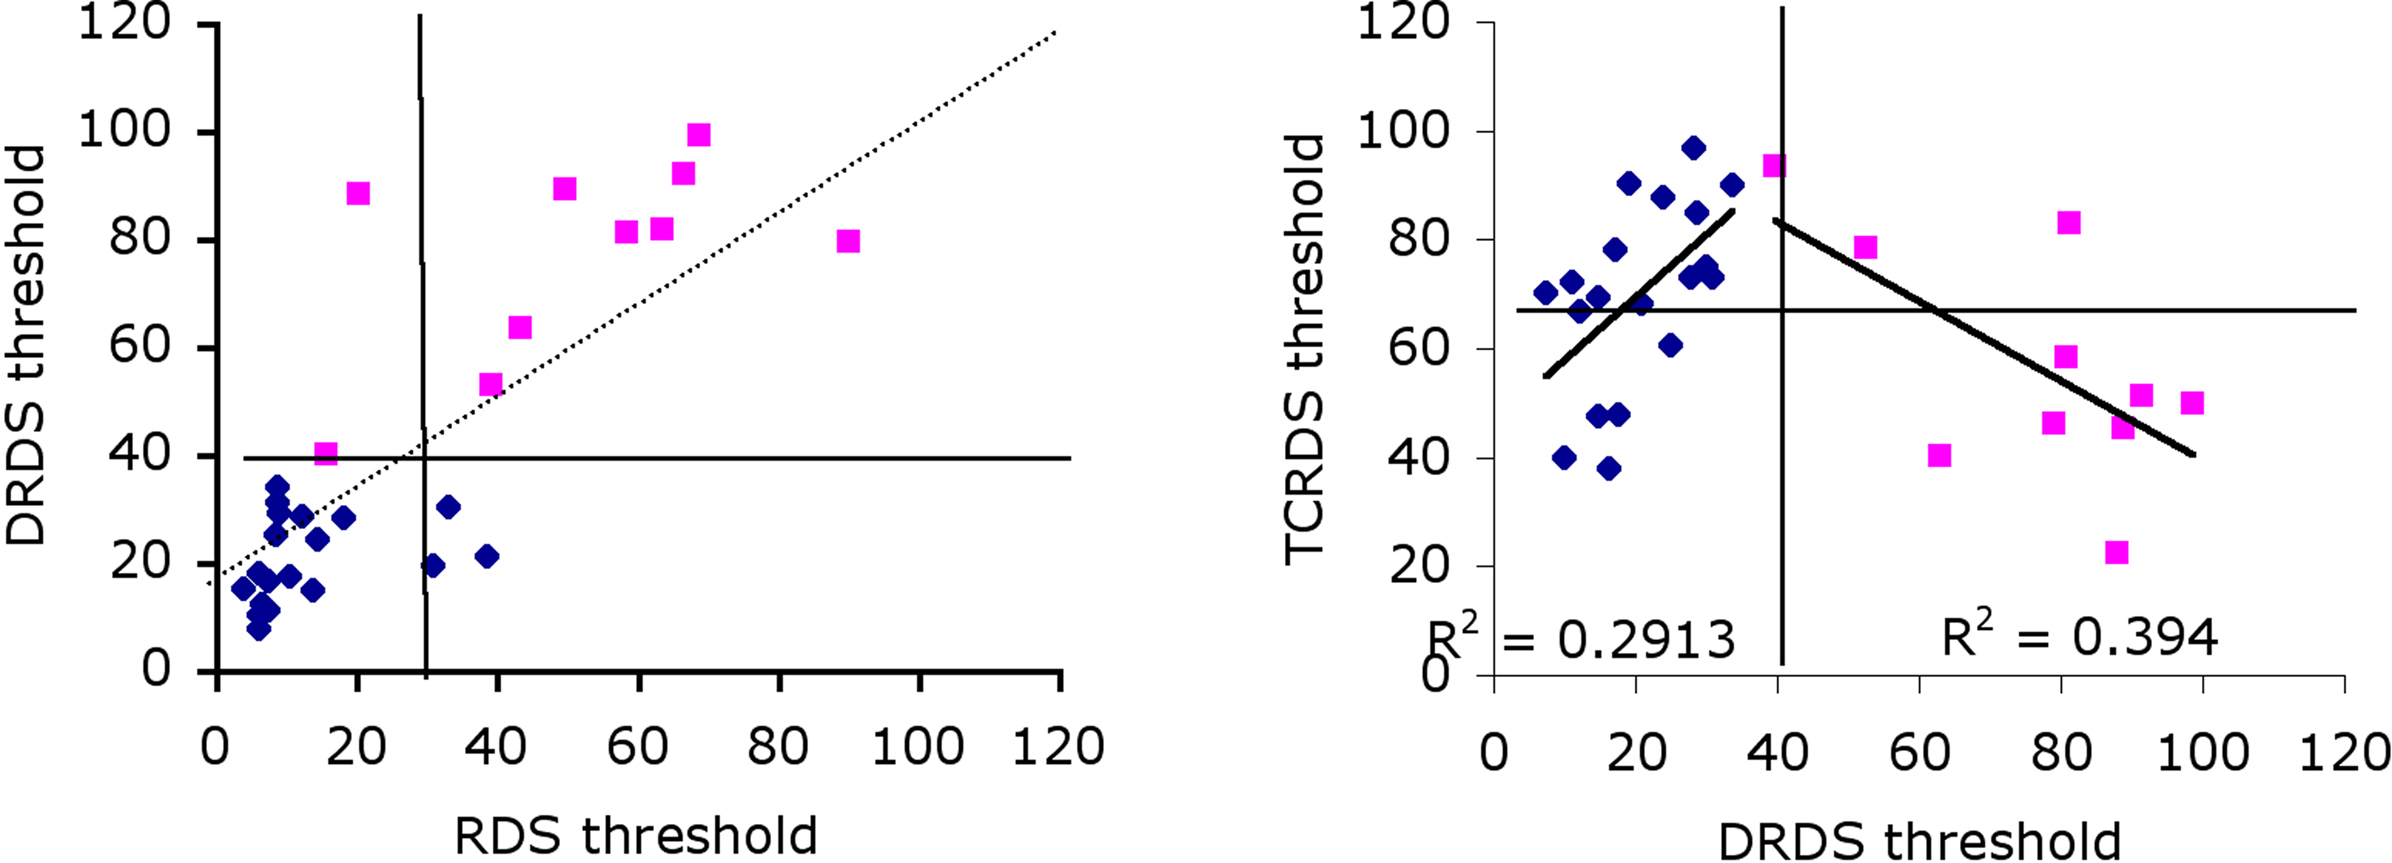
Figure 4. Correlations between DRDS and RDS (left) and TCRDS and DRDS (right), with data blocked into two separate groups. Group 1 had higher than average (39.8) DRDS thresholds (pink squares), Group 2 had lower than average DRDS thresholds (blue diamonds). Solid horizontal and vertical lines show the average threshold for each conditions. On the left, most observers in Group 1 have higher than average threshold for both RDS and DRDS (data points sit in the top-right quadrant), and for Group 2, points cluster mostly in the bottom-left quadrant. This pattern is not evident on the right, when comparing TCRDS and DRDS thresholds.
If we reasoned that observers with an unreliable CDOT mechanism might develop a more efficient IOVD mechanism, we would predict that for Group 1, poor performance on DRDS would correlate inversely with performance on TCRDS. That is exactly what we found: there is an inverse correlation between these two for Group 1 observers (R2 = 0.39, p = 0.046). The two groups do appear to exhibit quite different patterns of data. This suggests that there may be an IOVD mechanism, but evidence for it appears more clearly in observers where the CDOT mechanism is poorer (Group 1).
What this logic does not explain is the positive correlation in Figure 4 for Group 2 (R2 = 0.29, p = 0.016): why do observers in this group do better for TCRDS if they are better at DRDS? A much stronger CDOT mechanism would predict no correlation. We suspect that this may be due to contamination of one source of information by another in the stimuli. This possibility has been pointed out by Allison and Howard (2000). They noted that, even though a TCRDS is designed to have no binocular correlation, there will always be a small but consistent disparity change in the appropriate direction in these stimuli due to spurious binocular matching. This is unavoidable in stimuli like this, and it should further be noted that the logic also suggests that spurious motion information is, in principle, available in DRDS stimuli (Harris et al., 2008). We speculate that, because the CDOT signal appears to be more powerful than the IOVD signal (lower thresholds), this “contamination issue” is likely to be a problem only for the IOVD stimulus. Here, observers who are very sensitive to CDOT might pick up and use the tiny CDOT signal available in the TCRDS stimulus. This would predict that TCRDS thresholds should be much larger than, yet correlate with, CDOT thresholds. Group 2 exhibited this behavior. Because Group 1 are, by definition, less sensitive to CDOT information, a weak spurious signal in the TCRDS stimulus is unlikely to be useful for them.
Discussion
The results of this experiment have made three important points. First, we found indications that the processing of motion-in-depth from CDOT and IOVD relies on more than one system. Second, we have for the first time, measured the proportion of a normal population who can reliably perceive each information source. Whilst 77% of observers reached threshold for the CDOT cue, only 53% did so for the IOVD cue. Also, some observers appeared to be dominated by one or the other processing mechanism. Third, we have established the relative reliability of each cue for the population who could use both cues. Thresholds for RDS and DRDS, were highly correlated suggesting that the CDOT cue is of primary importance, but thresholds tended to be a little lower for RDS (Figure 3), demonstrating that the CDOT cue is not solely responsible for MID discrimination in most people. Further, there was an inverse correlation between ability to use CDOT and IOVD for some observers: the group of observers with the worst DRDS thresholds were those with better TCRDS thresholds.
Whilst only a few (8/62) of our participants were completely unable to perform the motion-in-depth task to threshold, with any of our stimuli, 25 of the remaining participants could not achieve our accepted threshold limit for at least one stimulus type. This result might seem alarming, but is consistent with other vision research studies that have used large numbers of participants. For example, in a recent face-perception study, 10% of participants were unable to perform the task to the required level (Yovel and Kanwisher, 2008). Porcar and Martinez-Palomera (1997) have shown that more than 30% of a normal population have some measurable level of binocular dysfunction. Such large numbers of observers performing poorly in vision tasks does not reflect a poor design; rather it demonstrates the spread of performance across a population. This behavior is not reflected in the standard vision literature, where small numbers of observers are typically used, who are specifically selected on the basis of being able to perform the required visual tasks.
Our results appears to contradict some very recent research using fMRI, that has revealed processing of motion-in-depth from both IOVD and CDOT information in human brain area MT+ (Rokers et al., 2009). However, that work could be demonstrating brain regions that represent the convergence of different sources of information, obtained via separate processing mechanisms. For example, higher visual areas, including MT+, appear to be involved in cue-combination for 3-D shape perception (Welchman et al., 2005). Indeed, other behavioral work suggests that there are two mechanisms with different temporal frequency characteristics (Shioiri et al., 2008), but that the IOVD mechanism also has characteristics distinct from its monocular components (Shioiri et al., 2009).
One could question the generality of our results for the perception of motion-in-depth. This is difficult to determine because motion-in-depth has been demonstrated over very diverse stimulus conditions. Because we wanted to keep the stimuli themselves as similar as possible, whilst isolating CDOT and IOVD, and because we wanted to collect data from a large population of observers, we restricted ourselves to a particular set of stimulus conditions. Sensitivity to motion-in-depth has been found for a wide range of stimulus spatial layouts. Our stimuli were of a similar spatial extent and arrangement to that of Shioiri et al., 2008 (ours was 10.1° wide, with two panels, each 2.7° high; their largest stimulus was 4.2° wide, with two panels, each 2.1° high). Both of these studies used regions moving in depth that are relatively large compared to those used in several other studies (e.g., Cumming and Parker, 1994; Brooks and Stone, 2004, where the moving regions under 2° square), yet relatively small (e.g., Gray and Regan, 1996; moving regions 8.5° degdiameter disk) compared to others.
The study that has used the most extensive range of speeds, spatial and temporal frequencies of motion for measuring CDOT and IOVD sensitivity, is that of Shioiri et al. (2008), who explored a range of different spatial and temporal configurations. Their main conclusion was that IOVD- and CDOT-sensitive mechanisms display different temporal frequency characteristics, with the former being sensitive to higher temporal frequencies (peak around 1 Hz, sensitivity up to around 7 Hz) than the latter (low pass, sensitive only up to around 1.5 Hz). However, in the low temporal frequency (t.f.) range (around 0.3 Hz), sensitivity was very similar for stimuli that isolated the two cues. This result concurs with that found by Gray and Regan (1996), who found lowest thresholds around 2 Hz for stimuli containing both cues. Our stimuli, moving from back to front (or front to back) in a sweep lasting 3.01 s, can be considered as like half a cycle of the Shioiri et al., 2008 stimuli, with a temporal frequency of square wave motion of 0.167 Hz. This was lower than the lowest t.f. used by Shioiri et al., 2008 (0.35 cps), but there is no reason to suggest that a different pattern is expected at lower temporal frequencies. Hence, there is no suggestion that we are favoring either the CDOT or IOVD mechanisms with the temporal characteristics of the stimuli we used.
The speed of motion-in-depth may be another important consideration. We know that speed discrimination of motion-in-depth is very poor for stimuli that isolate CDOT information (e.g., Harris and Watamaniuk, 1995), suggesting that the IOVD mechanism may be responsible for speed processing of motion-in-depth. We also know that, for lateral motion, speed sensitivity is much better for larger speeds, above around 2°/s (McKee, 1981; McKee and Nakayama, 1984). Thus larger speeds may favor the IOVD mechanism. We used a rather slow speed of motion here (6.8 min/s disparity, similar to the 8 min/s used by Gray and Regan, 1996), compared with some other studies (e.g., 18–426 min/s by Shioiri et al., 2008; 15.8 min/sec by Brooks and Stone, 2004). It is therefore possible that the slow speed we used in our stimuli favored the CDOT mechanism.
Most surprisingly, our results suggest that different populations of otherwise normal observers preferentially use one or the other motion-in-depth mechanism. A very small literature exploring the perception of binocular disparity across populations of observers suggests that we should have anticipated this result. Richards (1970, 1971) reported that about 30% of people have difficulty detecting either crossed or uncrossed disparity in stationary line stereograms. It has also been reported that some people with otherwise normal vision are blind to motion-in-depth in specific regions of the visual field (Richards and Regan, 1973; Regan et al., 1986). Our data provide a novel example of how normal visual processing in different individuals may not always rely on the same visual mechanisms.
In summary, we have shown that some people’s perception of motion-in-depth is dominated by changing disparity while others rely more on IOVD. Importantly, our population of observers were sampled from a normal non-clinical population, demonstrating that this dissociation is not an accidental curiosity but a hitherto unrecognized aspect of normal motion-in-depth perception. In previous experiments, the focus has been on discovering how sensitive the visual system is to CDOT or IOVD information. The individual differences approach used here, exploiting differences in patterns of performance across a large number of naïve observers, has demonstrated that there do appear to be two separable mechanisms. This is a powerful technique, with wide applicability in the areas of perception and cognition.
Conflict of Interest Statement
The authors declare that the research was conducted in the absence of any commercial or financial relationships that could be construed as a potential conflict of interest.
Acknowledgments
This research was supported by the EPSRC (UK) and the Wellcome Trust. We express thanks to Ian Howard, Jan Koenderink, Suzanne McKee, Hildegard Nefs and Dave Perret for their comments on a draft version of this paper.
References
Allison, R. S., and Howard, I. P. (2000). Stereopsis with persisting and dynamic textures. Vision Res. 40, 3823–3827.
Bach, M. (1996). The “Freiburg Visual Acuity Test” – automatic measurement of the visual acuity. Optom. Vision Sci. 73, 49–53.
Brooks, K. R. (2002). Interocular velocity difference contributes to stereomotion speed perception. J. Vision 2, 218–231.
Brooks, K. R., and Stone, L. S. (2004). Stereomotion speed perception: contributions from both changing disparity and interocular velocity difference over a range of relative disparities. J. Vision 4, 1061–1079.
Cormack, L. K., Stevenson, S. B., and Schor, C. M. (1991). Interocular correlation, luminance contrast and cyclopean processing. Vision Res. 31, 2195–2207.
Cumming, B. G., and DeAngelis, G. C. (2001). The physiology of stereopsis. Annu. Rev. Neurosci. 24, 203–238.
Cumming, B. G., and Parker, A. J. (1994). Binocular mechanisms for detecting motion-in-depth. Vision Res. 34, 483–495.
Gray, R., and Regan, D. (1996). Cyclopean motion perception produced by oscillations of size disparity and location. Vision Res. 36, 655–665.
Harris, J. M., Nefs, H. T., and Grafton, C. E. (2008). Binocular vision and motion in depth. Spat. Vision 21, 531–547.
Harris, J. M., and Parker, A. J. (1992). Efficiency of stereopsis in random dot stereograms. J. Opt. Soc. Am. A 9, 14–24.
Harris, J. M., and Parker, A. J. (1994a). Constraints on human stereo dot matching. Vision Res. 34, 2761–2772.
Harris, J. M., and Parker, A. J. (1994b). Objective evaluation of human and computational stereoscopic visual systems. Vision Res. 34, 2773–2785.
Harris, J. M., and Parker, A. J. (1995). Independent use of bright and dark information in stereopsis. Nature 374, 808–811.
Harris, J. M., and Watamaniuk, S. N. J. (1995). Speed discrimination of motion-in-depth using binocular cues. Vision Research 35, 885–896.
Hokoda, S. C. (1985). General binocular dysfunctions in an urban optometry clinic. J. Am. Optom. Assoc. 56, 560–562.
Howard, I. P., and Rogers, B. (2002). Seeing in Depth, Vol. II, Depth Perception. Toronto: I. Porteous.
Ishihara, S. (1979). Tests for Colour-Blindness, 38 Plates Edition. Tokyo: Kanehara Shuppan Co, Ltd.
Kosslyn, S. M., Cacioppo, J. T., Davidson, R. J., Hugdahl, K., Lovallo, W. R., Spiegel, D., and Rose, R. (2002). Bridging psychology and biology, the analysis of individuals in groups. Am. Psychol. 57, 341–351.
Maeda, M., Sato, M., Ohmura, T., Miyazaki, Y., Wang, A. H., and Awaya, S. (1999). Binocular depth-from-motion in infantile and late-onset esotropia patients with poor stereopsis. Invest. Ophthalmol. Vis. Sci. 40, 3031–3036.
McDermott, J. H., Lehr, A. J., and Oxenham, A. J. (2010). Individual differences reveal the basis of consonance. Curr. Biol. 20, 1–7.
McKee, S. P. (1981). A local mechanism for differential velocity detection. Vision Res. 21, 491–500.
McKee, S. P., and Nakayama, K. (1984). Detection of motion in the peripheral visual field. Vision Res. 24, 25–32.
Nefs, H. T., and Harris, J. M. (2007). Vergence effects on the perception of motion in depth. Exp. Brain Res. 183, 313–322.
Nefs, H. T., and Harris, J. M. (2008). Induced motion in depth and the effects of vergence eye movements. J. Vision 8, 1–16.
Nefs, H. T., and Harris, J. M. (2010). What visual information is used for stereoscopic depth displacement discrimination? Perception 39, 727–744.
Palmisano, S., Allison, R. S., and Howard, I. P. (2006). Effect of decorrelation on 3-D grating detection with static and dynamic random-dot stereograms. Vision Res. 46, 57–71.
Peterzell, D. H., and Teller, D. Y. (1996). Individual differences in contrast sensitivity functions: the lowest spatial frequency channels. Vision Res. 36, 3077–3085.
Peterzell, D. H., Werner, J. S., and Kaplan, P. S. (1995). Individual-differences in contrast sensitivity functions – longitudinal-study of 4-month-old, 6-month-old and 8-month-old human infants. Vision Res. 35, 961–979.
Porcar, E., and Martinez-Palomera, A. (1997). prevalence of general binocular dysfunction in a population of university students. Optom. Vision Sci. 74, 111–113.
Regan, D. (1993). Binocular correlates of the direction of motion in depth. Vision Res. 33, 2359–2360.
Regan, D., Erkelens, C. J., and Collewijn, H. (1986). Visual field defects for vergence eye movements and for stereomotion perception. Invest. Ophthalmol. Vis. Sci. 27, 806–819.
Richards, W., and Regan, D. (1973). A stereo field map with implications for disparity processing. Invest. Ophthalmol. Vis. Sci. 12, 904–909.
Rokers, B., Cormack, L. K., and Huk, A. C. (2009). Disparity- and velocity-based signals for three-dimensional motion perception in human MT+. Nat. Neurosci. 12, 1050–1055.
Shioiri, S., Kakehi, D., Tashiro, T., and Yaguchi, H. (2009). Integration of monocular motion signals and the analysis of interocular velocity differences for the perception of motion-in-depth. J. Vision 9, 1–17.
Shioiri, S., Nakajima, T., Kakehi, D., and Yaguchi, H. (2008). Differences in temporal frequency tuning between the two binocular mechanisms for seeing motion-in-depth. J. Opt. Soc. Am. A Opt. Image Sci. Vision 25, 1574–1585.
Shioiri, S., Saisho, H., and Yaguchi, H. (2000). Motion-in-depth based on inter-ocular velocity differences. Vision Res. 40, 2565–2572.
Watamaniuk, S. N. J., Sekuler, R., and Williams, D. W. (1989). Direction perception in complex dynamic displays: the integration of direction information. Vision Res. 29, 47–59.
Watanabe, Y., Kezuka, T., Harasawa, K., Usui, M., Yaguchi, H., and Shioiri, S. (2008). A new method for assessing motion-in-depth perception in strabismic patients. Br. J. Ophthalmol. 92, 47–50.
Welchman, A. E., Deubelius, A., Conrad, V., Bulthoff, H. H., and Kourtzi, Z. (2005). 3D shape perception from combined depth cues in human visual cortex. Nat. Neurosci. 8, 820–827.
Wilmer, J. B. (2008). How to use individual differences to isolate functional organization, biology, and utility of visual functions; with illustrative proposals for stereopsis. Spat. Vis. 21, 561–579.
Keywords: motion-in-depth, stereopsis, individual differences, interocular velocity differences, depth motion
Citation: Nefs HT, O’Hare L and Harris JM (2010) Two independent mechanisms for motion-in-depth perception: evidence from individual differences. Front. Psychology 1:155. doi: 10.3389/fpsyg.2010.00155
Received: 30 July 2010;
Paper pending published: 15 August 2010;
Accepted: 30 August 2010;
Published online: 12 October 2010
Edited by:
Laurence T. Maloney, New York University, USAReviewed by:
Alexander C. Huk, The University of Texas at Austin, USAFang Fang, Peking University, China
Copyright: © 2010 Nefs, O’Hare and Harris. This is an open-access article subject to an exclusive license agreement between the authors and the Frontiers Research Foundation, which permits unrestricted use, distribution, and reproduction in any medium, provided the original authors and source are credited.
*Correspondence: Julie M. Harris, The School of Psychology, University of St Andrews, South Street, St Andrews KY16 9JP, UK. e-mail: jh81@st-andrews.ac.uk