Published online Mar 7, 2011. doi: 10.3748/wjg.v17.i9.1152
Revised: November 29, 2010
Accepted: December 6, 2010
Published online: March 7, 2011
AIM: To investigate the biological features of hepatitis B virus (HBV)-transfected HepG2.2.15 cells.
METHODS: The cell ultrastructure, cell cycle and apoptosis, and the abilities of proliferation and invasion of HBV-transfected HepG2.2.15 and the parent HepG2 cells were examined by electron microscopy, flow cytometry, 3-(4,5-Dimethylthiazol-2-yl)-2,5-diphenyltetrazolium bromide and trans-well assay. Oncogenicity of the two cell lines was compared via subcutaneous injection and orthotopic injection or implantation in nude mice, and the pathological analysis of tumor formation was performed. Two cytoskeletal proteins were detected by Western blotting.
RESULTS: Compared with HepG2 cells, HepG2.2.15 cells showed organelle degeneration and filopodia disappearance under electron microscope. HepG2.2.15 cells proliferated and migrated slowly in vitro, and hardly formed tumor and lung metastasis in nude mice. Flow cytometry showed that the majority of HepG2.2.15 cells were arrested in G1 phase, and apoptosis was minor in both cell lines. Furthermore, the levels of cytoskeletal proteins F-actin and Ezrin were decreased in HepG2.2.15 cells.
CONCLUSION: HepG2.2.15 cells demonstrated a lower proliferation and invasion ability than the HepG2 cells due to HBV transfection.
- Citation: Zhao R, Wang TZ, Kong D, Zhang L, Meng HX, Jiang Y, Wu YQ, Yu ZX, Jin XM. Hepatoma cell line HepG2.2.15 demonstrates distinct biological features compared with parental HepG2. World J Gastroenterol 2011; 17(9): 1152-1159
- URL: https://www.wjgnet.com/1007-9327/full/v17/i9/1152.htm
- DOI: https://dx.doi.org/10.3748/wjg.v17.i9.1152
Hepatocellular carcinoma (HCC) is the primary malignancy of the liver. It is the third leading cause of cancer death in the world, and the second in China[1,2]. It is generally accepted that hepatitis B virus (HBV) plays a major causative role in the development of HCC[3,4]. To investigate the pathogenesis of HBV in HCC, several HBV expressing cell lines have been established by viral DNA transfection[5,6]. Most of them are derived from HepG2 and HuH7[7,8].
HepG2.2.15 cells are derived from the human hepatoblastoma cell line HepG2 and are characterized by having stable HBV expression and replication in the culture system[9]. As a cell source that can produce HBV, HepG2.2.15 has been frequently used in studies of HBV infection.
In this study, to clarify the cellular and biological features associated with HBV transfection, we examined HBV-producing HepG2.2.15 and parental HepG2 cells in a variety of biological processes including cell proliferation, cell invasion, tumor development and metastasis. We also explored the underlying mechanism accounting for the different features between the two cell lines.
HepG2.2.15 and HepG2 cells were cultured in DMEM medium (Hyclone, Logan, UT, USA), supplemented with 10% fetal bovine serum (Invitrogen, Carlsbad, CA, USA), in 5% CO2 at 37°C. A final concentration of 380 mg/L G418 (Invitrogen) was added into the medium for the maintenance of HepG2.2.15 cells.
To detect the expression and replication of HBV in HepG2.2.15 cells, hepatitis B surface antigen (HBsAg) and hepatitis B envelope antigen (HBeAg) levels in the medium at 24 h, 48 h and 72 h were determined semi-quantitatively using enzyme-linked immunosorbent assay (ELISA) kits (Sino-American Biotechnology Company, Shanghai, China) according to the manufacturer’s instructions. All experiments were performed in triplicate.
HepG2.2.15 and HepG2 cells were collected and fixed in 2.5% glutaraldehyde (GA) overnight, dehydrated in a graded series of ethanol and embedded in Quetol-812. The ultrathin sections were cut and stained with lead citrate. The girds were examined under a JEM-1220 electron microscope.
HepG2.2.15 and HepG2 cells were seeded in triplicate into 96-well plates at 4 × 10³ cells per well. Twenty microliters 3-(4,5-Dimethylthiazol-2-yl)-2,5-diphenyltetrazolium bromide (5 mg/mL) was added to the medium and cultured for another 4 h. DMSO (150 μL) was added and the absorbance of each well was read using a Bio-Rad model 550 microplate reader at a wavelength of 490 nm. It was tested for 5 d and the data were expressed as mean ± SD.
Cell cycle assay was monitored using propidium iodide (PI) staining of the nuclei. The cells were fixed in 75% cold alcohol overnight, resuspended in 300 μL PBS and stained with 500 μL PI (250 μg/mL) for 30 min in the dark. Annexin V/PI double staining was used for apoptosis assay. Annexin V and PI were added for incubation for 15 min at 4°C. The cells were analyzed by flow cytometry (BD BioSciences, San Jose, CA, USA).
The invasive abilities of HepG2.2.15 and HepG2 cells were determined using matrigel (BD) coated 24-well trans-well chambers (Corning Costar, NY, USA) as described previously[10]. In brief, trans-well was coated with 10 μL matrigel and dried in the air; and 5 × 10⁴ cells in serum-free DMEM were seeded into the upper chamber, with the lower chamber supplemented with DMEM containing 10% FBS. The trans-well was incubated at 37°C in 5% CO2. Incubation time was different due to different invasive abilities of the two cell lines. The cells that had penetrated through the pores were fixed, stained with hematoxylin and eosin (HE) and photographed under light microscope. The experiments were conducted in triplicate.
Total protein extracts of cultured cells were performed routinely. Twelve-microgram samples were size fractionated by SDS-PAGE and electrophoretically transferred to nitrocellulose membranes. The membranes were incubated with F-actin or Ezrin antibodies (Bioss, Beijing, China), and detected using Western blue (Promega, Madison, WI, USA). GAPDH (Calbiochem, Gibbstown, NJ, USA) was used as internal control.
Four-week-old female BALB/c nude mice were maintained in the laboratory for animal experiments under specific pathogen-free conditions. The experiments were conducted in accordance with the Guideline for Animal Experiments of the National Cancer Center of China.
HepG2.2.15 and HepG2 cells were harvested and resuspended to 2 × 10⁷/mL with PBS, and 300 μL was injected subcutaneously into the left flank of each of eight nude mice. The tumor volume was calculated according to the formula: V = mean diameter3×π/6[11] and measured and recorded every 2 d.
Once the subcutaneous tumor reached 1 cm in diameter, it was removed and cut into 1 mm × 1 mm × 1 mm cubes freshly at 4°C. Another group of mice were anesthetized with an intra-peritoneal injection of pentobarbital at a dose of 60 mg/kg. Tumor cubes were implanted into the liver as described previously[12]. The mice were killed 60 d after implantation to harvest the liver and lung. The volume of tumor was determined according to the method described by Janik et al[13]. The liver and lung were removed and fixed in 4% formalin for standard pathological studies.
HepG2.2.15 and HepG2 cells (1.5 × 10⁶ cells/150 μL) were prepared in PBS at 4°C for injection. The mice were anesthetized and the liver was exposed as mentioned above. The cells were injected into the left lobe of liver of ten nude mice. The mice were observed for 60 d. Liver and lung were sampled for standard pathological studies as described above.
Data were expressed as percentage, mean ± SD. Comparisons between two groups were analyzed by the χ2 and Student t test. Mann-Whitney U-test was employed for analysis of subcutaneous tumor growth. P < 0.05 was considered statistically significant.
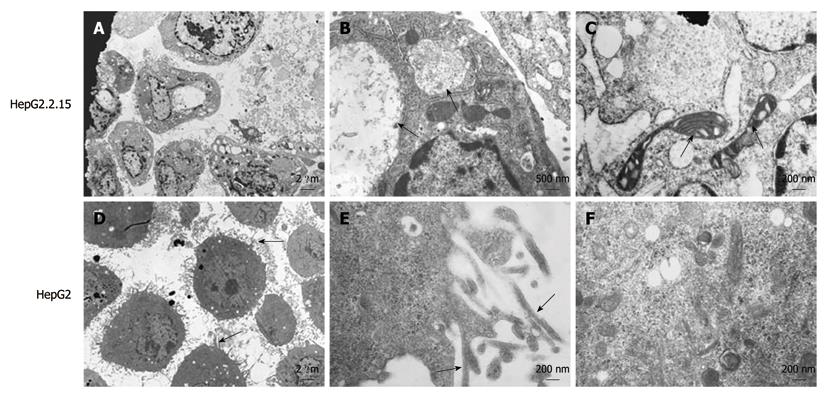
Ultrastructural analysis demonstrated that HepG2.2.15 cells had obviously decreased filopodia (Figure 1A) compared with HepG2 cells (Figure 1D). Plentiful filopodia formed around HepG2 cells and higher amplification showed microfilaments in the filopodia (Figure 1E). Moreover, viral inclusion bodies existed in the cytoplasm of HepG2.2.15 cells (Figure 1B), and many organelles, such as mitochondria, ribosome and endoplasmic reticulum, were found to be degenerated in HepG2.2.15 cells (Figure 1C). In contrast, HepG2 cells contained normal and abundant organelles including ribosome, glycogen, microfilament and microtubule (Figure 1F).
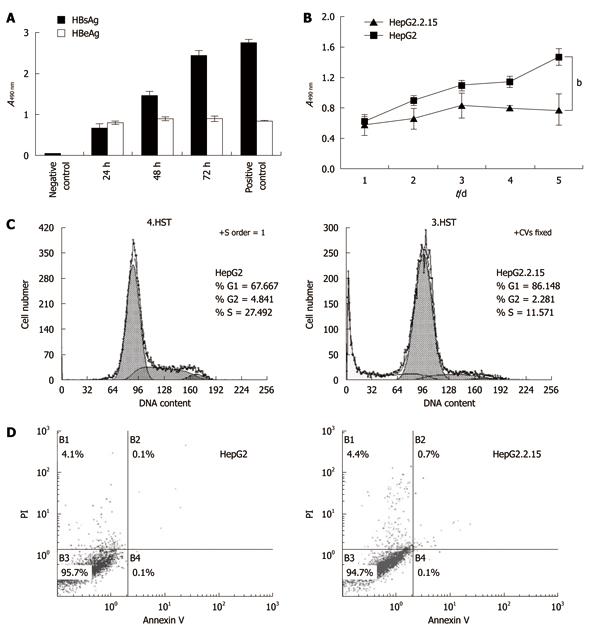
HBsAg and HBeAg were detected in the culture supernatant of HepG2.2.15 cells by ELISA. While the HBsAg level increased in a time-dependent manner, HBeAg level peaked at around 24 h and remained largely unchanged until 72 h (Figure 2A). As shown in Figure 2B, HepG2 cells had a significantly higher proliferation rate than HepG2.2.15 cells from Day 2 (P < 0.01), especially on Day 4 and Day 5 (P < 0.001).
To further investigate the reduced proliferation of HepG2.2.15, we tested cell cycle and apoptosis by flow cytometry. The results indicated that the percentage of the G1 phase of HepG2 was significantly lower than that of HepG2.2.15 (P < 0.01), but the HepG2 cells in S phase were increased significantly (P < 0.001) (Figure 2C), indicating cell cycle arrest at the G1/S phase in HepG2.2.15 cells. The apoptosis analysis showed no significant difference in apoptosis between HepG2.2.15 and HepG2 cells (Figure 2D).
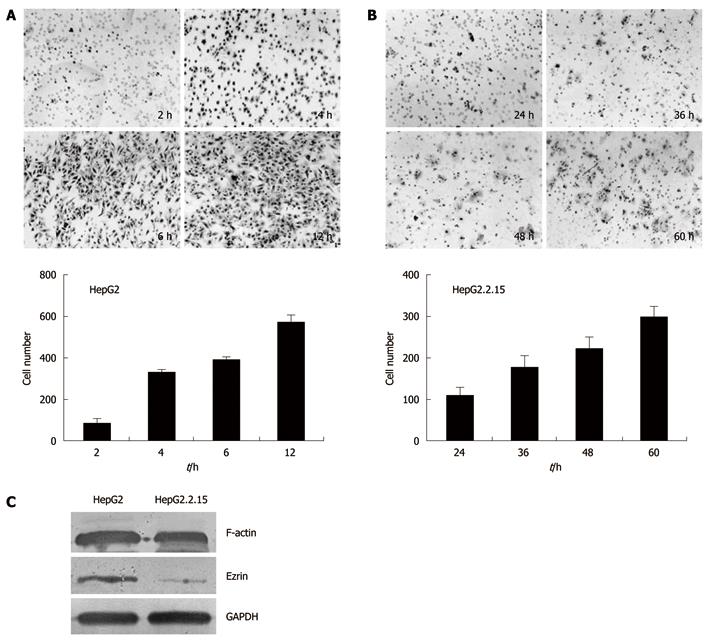
Trans-well analysis demonstrated that HepG2.2.15 and HepG2 cells were significantly different in invasion ability in vitro. HepG2 cells on the lower part of the membrane were detected as early as 2 h after incubation, with an increasing number of cells invading through the membrane at 4 h, 6 h and 12 h (Figure 3A). In contrast, the invasion of HepG2.2.15 cells into the lower chamber was detected at 24 h, 36 h, 48 h and 60 h, respectively (Figure 3B). These results suggested that HepG2.2.15 cells had lower invasion ability and took longer time to go through the membrane.
To elucidate the mechanism accounting for the difference in cell invasion between HepG2.2.15 and HepG2 cells, we examined the expression of F-actin and Ezrin, which are both cytoskeleton proteins that play crucial roles in maintaining cell shape and promoting cell invasion. Western blotting analysis showed a 0.7-fold decrease of F-actin level and a 3.8-fold decrease of Ezrin level in HepG2.2.15 cells compared with HepG2 cells (Figure 3C).
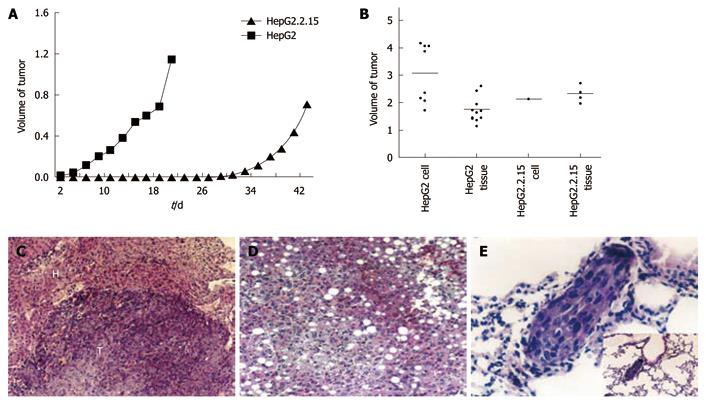
To explore the biological features of HepG2.2.15 cells in vivo, we monitored subcutaneous tumor growth in vivo. Two days after injection of HepG2 cells, the nodules were visualized and the diameter reached 0.6 cm on Day 6, and 100% (8/8) mice formed tumors. In contrast, only 25% (2/8) mice injected with HepG2.2.15 cells formed tumors, significantly lower than that of HepG2 cells (P < 0.01), and tumor formation was slower than the mice injected with HepG2 cells (Figure 4A). Notably, 100% (10/10) mice injected with HepG2 cells formed tumor in the liver 60 d after tumor cubes implantation, and the mean volume was 1.7 ± 0.4 cm3. Furthermore, all the mice (10/10) developed tumor in the liver after the injection of HepG2 cells and the mean volume of tumor was as big as 3.1 ± 1.1 cm3. Nevertheless, the incidence of tumor formation in HepG2.2.15 group (40%, 4/10) was significantly lower than the HepG2 group (P < 0.05). The mean volume was 2.3 ± 0.3 cm3 (Figure 4B). Only one case formed tumor (10%, 1/10) with a volume of 2.1 cm3 (Figure 4B). The incidence of tumor formation in the liver was significantly higher in HepG2 implantation group (P < 0.05) and injection group (P < 0.001) when compared with HepG2.2.15 group. Taken together, these results indicated the low tumorigenicity of HepG2.2.15 cells in vivo, being consistent with their reduced cell proliferation and invasion in vitro.
Lung metastasis was observed under light microscope with a highest percentage of 50% (Figure 4E) in HepG2 group. The growth pattern (Figure 4C), invasion and changes in tumor and surrounding normal tissues were also analyzed in all the groups (Table 1). Most non-tumor livers showed obvious fatty changes in HepG2.2.15 groups (Figure 4D) and the invasion to surrounding organs occurred more frequently in HepG2 groups.
| Tumor behavior | HepG2 | HepG2.2.15 | ||
| Cell injection (n = 10) | Tissue implantation (n = 10) | Cell injection (n = 10) | Tissue implantation (n = 10) | |
| Formation (%) | 100 | 100 | 10d | 40a |
| Volume (cm3) | 3.1 ± 1.1 | 1.7 ± 0.4 | 2.1 | 2.3 ± 0.3 |
| Growth | Expensive growth and central necrosis | Same | Same | Same |
| Surrounding tissue | Degeneration and necrosis | Same | Same | Same |
| Normal tissue | Spotty or piecemeal necrosis, scattered fat droplets and vacuolation, focal inflammatory infiltration | Spotty or piecemeal necrosis, diffuse fatty change 40% and focal inflammatory infiltration | Spotty or piecemeal necrosis, diffuse or scattered fatty change 50%, focal inflammatory infiltration and diffuse cytoplasmic swelling of liver cells | Spotty or piecemeal necrosis, diffuse fatty change 40%, focal inflammatory infiltration and mild cytoplasmic swelling of liver cells |
| Tumor invasion | Abdominal wall 100%; pancreas 37.5%; esophago 12.5% | Abdominal wall 50%; pancreas 12.5%; diaphragma/ribs 10% | Abdominal wall 10% | Diaphragma/ribs 10% |
| Metastasis | ||||
| Intra-liver | 75% (6/8) | 30% (3/10) | 0 | 0 |
| Lung | 50% (4/8) | 0 | 10% (1/10) | 10% (1/10) |
This study found that HepG2.2.15 cells had lower proliferation and invasion ability than the HepG2 cells.The majority of HepG2.2.15 cells were arrested at G1-S phase and the level of two important cytoskeletal proteins decreased.
HBV contains four open reading frames S, C, P, and X. Kanda et al[7] and Kim et al[14] showed that HBx transfection down-regulated cell viability and induced apoptosis. HBx suppressed tumor cell proliferation, induced apoptosis and caused cell cycle arrest at G1-S in vitro[15]. These results are partly consistent with our findings in this study. It has been shown that HBV replication depends on the cell cycle and the decrease in S phase[16], so HBV replication may affect cell cycle progression. This may partly explain the G1-S arrest in HepG2.2.15 cells. Proteome analysis of HepG2.2.15 and HepG2 cells displayed abundant differentially expressed proteins[17]. In this study, we found that the expression level of Ezrin and F-actin was lower in HepG2.2.15 than in HepG2. F-actin is the major cytoskeletal element and Ezrin is a member of the ERM (ezrin-radixin-moesin) cytoskeleton-associated protein family[18]. Both of them have membrane-cytoskeleton linking functions[19] and participate in cell migration, growth regulation[20], filopodia formation[21], and cancer metastasis[22]. Therefore, reduced level of Ezrin and F-actin in HepG2.2.15 cells may contribute to the lower proliferation and invasion ability. Additionally, the lower expression of Ezrin was accompanied with reduced filopodia in HepG2.2.15 cells. The dysfunction of organelles and cytoskeleton in HepG2.2.15 cells may also contribute to the slower cell growth and invasion both in vitro and in vivo.
Notably, non-tumor liver tissues showed mild to severe hepatic fatty changes, necrosis and neutrophil infiltration in HepG2.2.15 groups. In the mice injected with HepG2.2.15 cells, the low rate of tumor formation was accompanied by severe degeneration and necrosis in liver tissues. Interestingly, similar results have been reported by other researchers. For example, overexpression of HBx caused negative accommodation of microsome triglyeride transfer protein and accumulation of intracellular triglyeride and cholesterol in hepatocyte[23]. Liver tissue from the HBx transgenic mice showed mild to severe hepatic necrosis, fatty changes, mild to moderate chronic hepatitis and cytoplasmic vacuolation[24]. So, the correlations between HBV, hepatic degeneration and inflammation are striking and need to be further investigated.
In summary, HepG2.2.15 cells demonstrated decreased proliferation and invasion ability compared with its parental HepG2 cells due to HBV transfection. HBV-induced cell cycle arrest and cytoskeletal alteration might be implicated in the mechanism. Our findings will help better understand the cellular and biological features of HepG2.2.15 cells associated with HBV, and select the most suitable cell lines for research. These findings also shed new light on the interaction between HBV and host cells.
Hepatocellular carcinoma (HCC) is the third leading cause of cancer death in the world, and the second in China. It is generally accepted that hepatitis B virus (HBV) plays a major causative role in the development of HCC. Although considerable studies have been conducted, the precise mechanism remains unclear.
HBV infection is considered a high risk for the development of HCC. To investigate the pathogenesis of HBV in HCC, several HBV expressing cell lines have been established by viral DNA transfection. HepG2.2.15 cell line is one of the most common models for HBV-associated disease, but the cellular and biological features associated with HBV in HepG2.2.15 cells is seldom considered. Little is known about the effects of HBV on the biological features of host cells.
In this study, the authors demonstrated that HepG2.2.15 cells had lower proliferation and invasion ability than their parental HepG2 cells. HBV-induced cell cycle arrest and cytoskeletal alteration might be implicated in the mechanism.
The findings in this study will help us better understand the cellular and biological features of HepG2.2.15 cells associated with HBV and select the most suitable cell lines for research. They also shed new light on the interaction between HBV and host cells.
HepG2.2.15 cells are derived from HepG2 cells transfected with a full-length HBV plasmid. It is characterized by having stable HBV expression and replication in the culture system.
The study is well conducted and the methodology is sound.
Peer reviewer: Dr. BS Anand, Professor, Digestive Diseases Section (111D), VA Medical Center, 2002 Holcombe Blvd., Houston, TX 77030, United States
S- Editor Tian L L- Editor Ma JY E- Editor Zheng XM
| 1. | Parkin DM, Bray F, Ferlay J, Pisani P. Global cancer statistics, 2002. CA Cancer J Clin. 2005;55:74-108. [Cited in This Article: ] |
| 2. | He J, Gu D, Wu X, Reynolds K, Duan X, Yao C, Wang J, Chen CS, Chen J, Wildman RP. Major causes of death among men and women in China. N Engl J Med. 2005;353:1124-1134. [Cited in This Article: ] |
| 3. | Yen TS. Hepadnaviral X Protein:Review of Recent Progress. J Biomed Sci. 1996;3:20-30. [Cited in This Article: ] |
| 4. | Shimizu I, Kohno N, Tamaki K, Shono M, Huang HW, He JH, Yao DF. Female hepatology: favorable role of estrogen in chronic liver disease with hepatitis B virus infection. World J Gastroenterol. 2007;13:4295-4305. [Cited in This Article: ] |
| 5. | Bergametti F, Prigent S, Luber B, Benoit A, Tiollais P, Sarasin A, Transy C. The proapoptotic effect of hepatitis B virus HBx protein correlates with its transactivation activity in stably transfected cell lines. Oncogene. 1999;18:2860-2871. [Cited in This Article: ] |
| 6. | Terradillos O, Pollicino T, Lecoeur H, Tripodi M, Gougeon ML, Tiollais P, Buendia MA. p53-independent apoptotic effects of the hepatitis B virus HBx protein in vivo and in vitro. Oncogene. 1998;17:2115-2123. [Cited in This Article: ] |
| 7. | Kanda T, Yokosuka O, Imazeki F, Yamada Y, Imamura T, Fukai K, Nagao K, Saisho H. Hepatitis B virus X protein (HBx)-induced apoptosis in HuH-7 cells: influence of HBV genotype and basal core promoter mutations. Scand J Gastroenterol. 2004;39:478-485. [Cited in This Article: ] |
| 8. | Takada S, Shirakata Y, Kaneniwa N, Koike K. Association of hepatitis B virus X protein with mitochondria causes mitochondrial aggregation at the nuclear periphery, leading to cell death. Oncogene. 1999;18:6965-6973. [Cited in This Article: ] |
| 9. | Sells MA, Chen ML, Acs G. Production of hepatitis B virus particles in Hep G2 cells transfected with cloned hepatitis B virus DNA. Proc Natl Acad Sci USA. 1987;84:1005-1009. [Cited in This Article: ] |
| 10. | Albini A, Iwamoto Y, Kleinman HK, Martin GR, Aaronson SA, Kozlowski JM, McEwan RN. A rapid in vitro assay for quantitating the invasive potential of tumor cells. Cancer Res. 1987;47:3239-3245. [Cited in This Article: ] |
| 11. | Chan DW, Ng IO. Knock-down of hepatitis B virus X protein reduces the tumorigenicity of hepatocellular carcinoma cells. J Pathol. 2006;208:372-380. [Cited in This Article: ] |
| 12. | Fidler IJ. Critical determinants of metastasis. Semin Cancer Biol. 2002;12:89-96. [Cited in This Article: ] |
| 13. | Janik P, Briand P, Hartmann NR. The effect of estrone-progesterone treatment on cell proliferation kinetics of hormone-dependent GR mouse mammary tumors. Cancer Res. 1975;35:3698-3704. [Cited in This Article: ] |
| 14. | Kim SY, Kim JK, Kim HJ, Ahn JK. Hepatitis B virus X protein sensitizes UV-induced apoptosis by transcriptional transactivation of Fas ligand gene expression. IUBMB Life. 2005;57:651-658. [Cited in This Article: ] |
| 15. | Sirma H, Giannini C, Poussin K, Paterlini P, Kremsdorf D, Bréchot C. Hepatitis B virus X mutants, present in hepatocellular carcinoma tissue abrogate both the antiproliferative and transactivation effects of HBx. Oncogene. 1999;18:4848-4859. [Cited in This Article: ] |
| 16. | Ozer A, Khaoustov VI, Mearns M, Lewis DE, Genta RM, Darlington GJ, Yoffe B. Effect of hepatocyte proliferation and cellular DNA synthesis on hepatitis B virus replication. Gastroenterology. 1996;110:1519-1528. [Cited in This Article: ] |
| 17. | Tong A, Wu L, Lin Q, Lau QC, Zhao X, Li J, Chen P, Chen L, Tang H, Huang C. Proteomic analysis of cellular protein alterations using a hepatitis B virus-producing cellular model. Proteomics. 2008;8:2012-2023. [Cited in This Article: ] |
| 18. | Bretscher A, Edwards K, Fehon RG. ERM proteins and merlin: integrators at the cell cortex. Nat Rev Mol Cell Biol. 2002;3:586-599. [Cited in This Article: ] |
| 19. | Takeuchi K, Kawashima A, Nagafuchi A, Tsukita S. Structural diversity of band 4.1 superfamily members. J Cell Sci. 1994;107:1921-1928. [Cited in This Article: ] |
| 20. | Brown KL, Birkenhead D, Lai JC, Li L, Li R, Johnson P. Regulation of hyaluronan binding by F-actin and colocalization of CD44 and phosphorylated ezrin/radixin/moesin (ERM) proteins in myeloid cells. Exp Cell Res. 2005;303:400-414. [Cited in This Article: ] |
| 21. | Furutani Y, Matsuno H, Kawasaki M, Sasaki T, Mori K, Yoshihara Y. Interaction between telencephalin and ERM family proteins mediates dendritic filopodia formation. J Neurosci. 2007;27:8866-8876. [Cited in This Article: ] |
| 22. | Valdman A, Fang X, Pang ST, Nilsson B, Ekman P, Egevad L. Ezrin expression in prostate cancer and benign prostatic tissue. Eur Urol. 2005;48:852-857. [Cited in This Article: ] |
| 23. | Kang SK, Chung TW, Lee JY, Lee YC, Morton RE, Kim CH. The hepatitis B virus X protein inhibits secretion of apolipoprotein B by enhancing the expression of N-acetylglucosaminyltransferase III. J Biol Chem. 2004;279:28106-28112. [Cited in This Article: ] |


