

Abstract
Objective. Renal biopsy is the “gold standard” to determine renal activity in systemic lupus erythematosus (SLE), but it is expensive, invasive, and carries risk. Osteoprotegerin (OPG) is produced by the heart, lungs, kidney, and bone. Monocyte chemoattractant protein-1 (MCP-1), a chemotactic cytokine, is involved in the progression of glomerular and tubulointerstitial injury. We investigated both urine OPG and MCP-1 as potential biomarkers for lupus nephritis.
Methods. Our subjects, 87 patients with SLE (88% women; 48% African American, 41% Caucasian, 11% other), mean age 44 years, were followed monthly to quarterly. Urinary OPG (pg/ml) and MCP-1 (pg/ml) were measured (Luminex MAP bead assay).
Results. OPG concentrations were strongly associated with global disease activity and with both renal activity on a visual analog scale (VAS) (p = 0.0006) and renal disease activity descriptors of the SELENA SLEDAI, including hematuria (p = 0.001) and a positive anti-dsDNA (p = 0.013). MCP-1 was also associated with the renal VAS (p = 0.032), renal disease activity descriptors of SELENA SLEDAI, including hematuria (p = 0.027), and with a positive anti-dsDNA (p = 0.016). We also examined the relationship between the biomarkers and having a urine protein to creatinine ratio (pr/cr) ≥ 0.5. Among patients with medium or high OPG, 46% had urine pr/cr ≥ 0.5, compared to only 23% among those with low OPG (p = 0.032). The 2 biomarkers were strongly correlated with each other (Spearman correlation coefficient 0.77, p < 0.0001).
Conclusion. The lack of availability of urine biomarkers has hampered development of new therapies for lupus nephritis. Urine MCP-1 and OPG were both associated with measures of lupus renal disease activity. Medium or high levels of OPG were predictive of a urine protein/creatinine ratio of ≥ 0.5. Further study, including longitudinal assessment and correlation with concurrent renal biopsies, is necessary before this assay can be used in the routine clinic setting.
Lupus nephritis occurs in over 50% of patients with systemic lupus erythematosus (SLE). It is both more common and more severe in non-Caucasian patients1–3. Although essential in the diagnosis of lupus nephritis, repeated renal biopsy to determine the International Society of Nephrology (ISN) class and activity score is not practical, due to cost, invasiveness, and risk. In addition, lupus nephritis can fluctuate over time, even changing ISN class. Although urine sediment and quantification of urine protein can be helpful, they do not distinguish among ISN classes. Studies of murine lupus have shown the importance of cytokines and chemokines, such as interleukin 4 (IL-4), in the pathogenesis of glomerular inflammation4. However, to be clinically practical, biomarkers of lupus nephritis would need to be measured in the urine, ideally by protein concentration, rather than by mRNA expression.
Osteoprotegerin (OPG), a member of the tumor necrosis factor (TNF) receptor family, has been identified as a regulator of bone resorption5. It has been demonstrated that OPG is produced by a variety of organs and tissues, including the cardiovascular system (heart, arteries, veins), lung, kidney, and immune tissues, as well as bone5,6. The expression and production of OPG are regulated by various cytokines and hormones7. Human microvascular endothelial cells (HMVEC) express transcripts for OPG, and tumor necrosis factor-α and IL-1α increase OPG expression 5- to 40-fold in HMVEC8. Increased plasma concentrations of OPG have been found in patients with diabetes mellitus9–11 and have been associated with diabetic microvascular manifestations11. It is hypothesized that kidney excretion plays an important role in the clearance of OPG. Thus, OPG concentration in the urine might rise in a lupus nephritis flare, because of the increased production and excretion from inflamed microvascular endothelial cells in the kidney.
Monocyte chemoattractant protein-1 (MCP-1), a chemotactic cytokine, plays an important role in the progression of glomerular and tubulointerstitial injuries in experimental and human glomerulonephritides12–14. A variety of cell types including glomerular endothelial, mesangial, and tubular epithelial cells may produce MCP-1 in response to inflammatory signals, such as cytokines (IL-1, TNF-α) and immune complexes15–17. MCP-1 has been found at high levels in the urine of patients with active lupus nephritis18. Evidence in human and animal studies highlights the importance of MCP-1 for renal injury in lupus nephritis19,20. In human SLE, urinary levels of MCP-1 are markedly elevated in patients with lupus nephritis, and the presence of MCP-1 in urine reflects its intrarenal expression21–23. A polymorphism in the MCP-1 gene regulatory region influences MCP-1 expression24. Urine MCP-1 levels have been shown to decline with treatment of nephritis25. MCP-1 levels are also affected by the presence or absence of diabetes mellitus26.
Based on preliminary screening that suggested that OPG and MCP-1 were the 2 most promising urine biomarkers, we studied both in a longitudinal study of patients with SLE.
MATERIALS AND METHODS
Eighty-seven patients participating in the Hopkins Lupus Cohort, a prospective longitudinal study of lupus activity and outcomes, were studied. This included 55 patients with lupus nephritis, 12 SLE patients with diabetes mellitus, 10 SLE patients receiving angiotensin-converting enzyme (ACE) inhibitors, 7 SLE patients receiving angiotensin receptor blockers, and 3 patients with active lupus. The cohort protocol required a visit every 3 months, but patients were seen more often based on disease activity. Urine samples were collected at each visit. At each visit, disease activity indices [physician’s global assessment; Safety of Estrogens in Lupus Erythematosus: National Assessment – SLE Disease Activity Index (SELENA SLEDAI)27; and renal activity on a 0 to 3 visual analog scale (VAS)]28 were calculated. Vital signs (weight, blood pressure), laboratory tests (complete blood count, platelets, erythrocyte sedimentation rate, creatinine, cholesterol, C3, C4, anti-dsDNA, anticardiolipin, lupus anticoagulant by Russell’s viper venom time, urinalysis, urine protein:creatinine ratio), and treatment (prednisone, immunosuppressives, hydroxychloroquine, ACE inhibitor and dose, angiotensin receptor blocker and dose) were recorded.
The study was approved by the Johns Hopkins University School of Medicine Institutional Review Board. All patients gave informed consent.
Quantifying renal disease activity
To quantify renal disease activity, we also used the Systemic Lupus International Cooperating Clinics renal activity score29, derived from a regression analysis using the physician rating of renal activity as the “gold standard.” It is calculated as follows: proteinuria 0.5 to 1 g/day (3 points), proteinuria 1 to 3 g/day (5 points), proteinuria > 3 g/day (11 points), urine red blood cells ≥ 5/hpf (3 points), and urine white blood cells ≥ 5/hpf (1 point).
Urine collection, preparation, and biomarker measurement
OPG and MCP-1 were measured using the Renovar non-washing biplex assay (Renovar Inc., Madison, WI, USA); results were reported as pg/ml. Urine “clean catch-midstream” samples of 25–50 ml were collected into an appropriate sterile container, and placed on ice or refrigerated at 4°C within 1 h of collection. Aliquots and the remaining urine sample in the centrifuge tube were frozen at −80°C and batched for shipment to Renovar, Inc.
At Renovar, samples were centrifuged at 1500 rpm for 10 min. The supernatant of each sample was aliquoted and stored at −80°C until use. Multi-analyte profiling (xMAP) technology (Luminex, Austin, TX, USA) was used for simultaneous quantification of urinary OPG and MCP-1. The capture antibodies directed respectively at OPG and MCP-1 were separately preconjugated to their corresponding particles following the Luminex coupling protocol. Quantification of OPG and MCP-1 was conducted in 96-well flat-bottom plates. Twenty-five microliters of mixed OPG and MCP-1 standards or urinary samples were added to wells containing 25 μl of assay buffer and 25 μl of precoated particles, and incubated on a 3-D rotator (Labline Instrument Inc., Melrose Park, IL, USA) at 60 rounds/min at room temperature (RT) for 60 min. Mixed biotin-labeled detection antibodies directed at OPG and MCP-1 were then added and incubated on the rotator at 60 rounds/min at RT for 60 min before the addition of streptavidin-PE. After an additional 30 min incubation on the rotator at 60 rounds/min at RT, data acquisition and analysis were performed on a Luminex 100 IS analyzer. Concentrations of OPG and MCP-1 in urine samples were determined by referring the mean fluorescence intensity of the samples to the respective standard curves. The detection limit (or the assay sensitivity) was 5 pg/ml, and the inter- and intra-assay variability was < 10% for both MCP-1 and OPG.
Statistical methods
To adjust for the variable urine concentration, we normalized our measures of MCP-1 and OPG by dividing by the urine creatinine concentration. Because the resulting distributions of MCP-1 and OPG were markedly skewed, we transformed each variable by taking the loge(variable + 1) prior to calculating means and performing inference. To assess the relationship between various types of SLE activity and the biomarker levels, we compared visits with and without the activity measure with respect to the means of the log-transformed MCP-1 and OPG. Statistical inferences regarding associations with biomarkers were based on models including a random effect for the patient in order to account for the correlation between repeated observations from the same patient. To assess whether changes in the biomarker were associated with changes in the urine protein to creatinine (pr/cr) ratio, we calculated the person-specific correlation coefficients between the biomarkers and urine pr/cr ratio, and determined the proportion of these correlation coefficients that were positive. To determine whether these proportions were significantly greater than 0.5, we used a sign test.
In additional analyses, we explored whether combining urine OPG and MCP-1 resulted in better prediction of urine pr/cr than either test alone. Due to the reported relationship among the biomarkers and diabetes mellitus, ACE inhibitors, and angiotensin receptor blockers, we also redid all the analyses after excluding SLE patients with these conditions/medications.
RESULTS
Data were obtained on 87 patients (88% women) with SLE. MCP-1 and OPG were measured at 1–5 visits per patient over the course of a 6-month period for a total of 184 visits. The ethnic breakdown was African American (48%), Caucasian (41%), Asian (5%), Hispanic (3%), and other ethnicity (2%). The mean age was 44 years. Cumulative clinical manifestations included ANA positivity 95%, immunologic disorder 89%, arthritis 71%, renal disorder 70%, serositis 54%, malar rash 51%, photosensitivity 50%, oral ulcers 44%, discoid rash 23%, and neurological disorder 15%.
Figure 1 illustrates the association between the proposed assays and the urine pr/cr ratio (after normalizing for urine creatinine). These plots are based on 154 visits from the 79 patients in whom the urine pr/cr ratio was measured. Spearman correlation coefficients between the urine pr/cr ratio and the log biomarkers were 0.25 and 0.34 for MCP-1 and OPG, respectively.
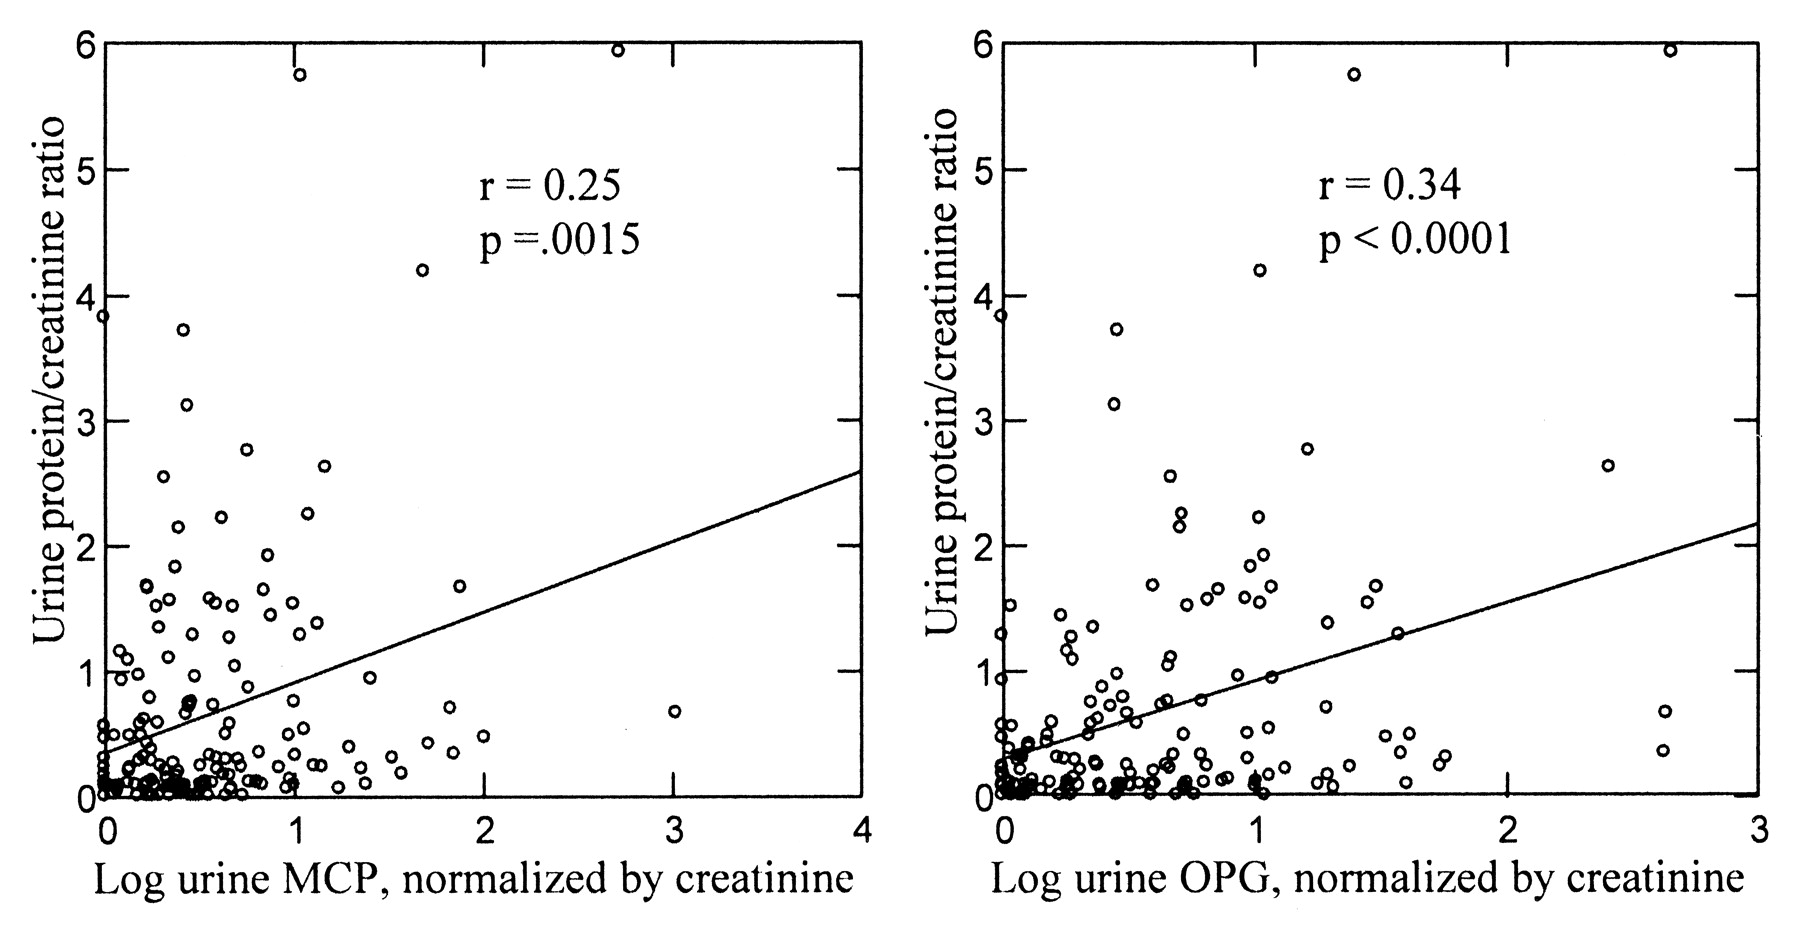
Urine protein plotted against the log of urine monocyte chemoattractant protein-1 (MCP-1) and osteoprotegerin (OPG) normalized by urine creatinine.
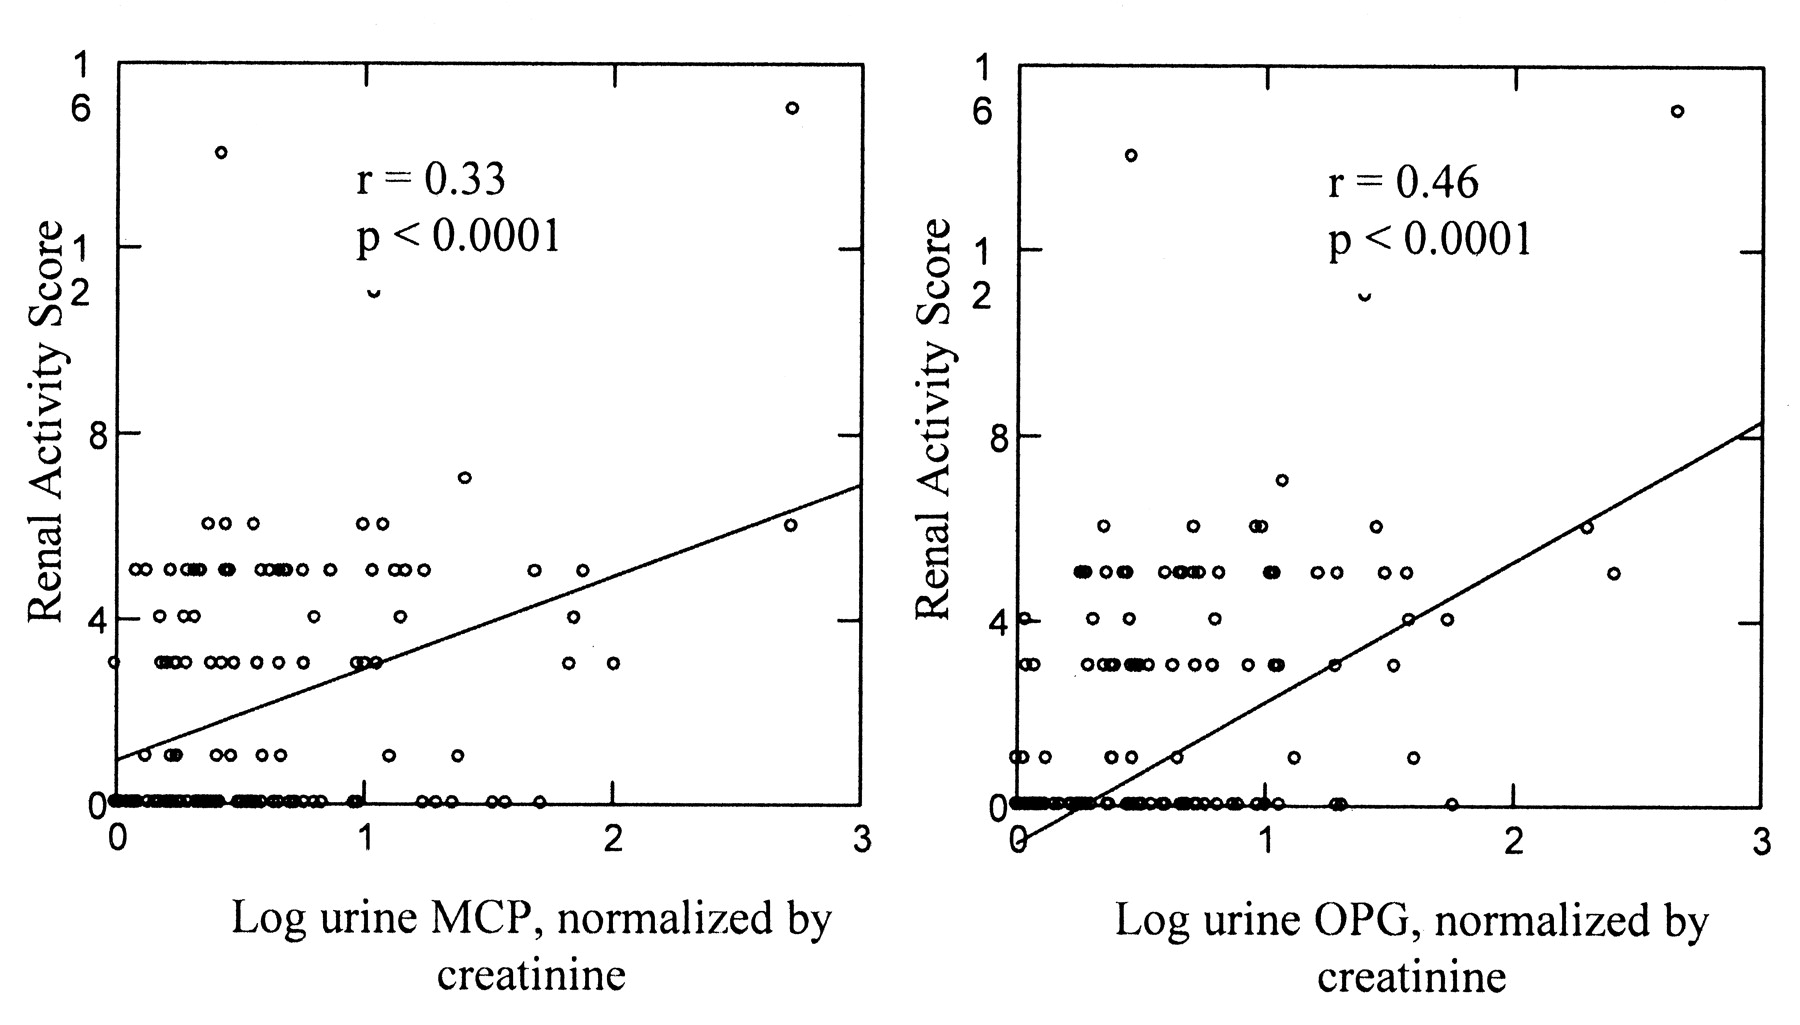
Figure 2 illustrates the association between the normalized biomarkers and the renal activity score. Spearman correlation coefficients between the renal activity score and the log biomarkers were 0.33 and 0.46 for MCP-1 and OPG, respectively. Although the p values were significant, the association was not very strong.

Renal disease activity score plotted against the log of urine monocyte chemoattractant protein-1 (MCP-1) and osteoprotegerin (OPG) normalized by urine creatinine.
Table 1 shows the association between the biomarkers and various clinical conditions. OPG levels were strongly associated with physician’s global estimate of disease activity and the renal VAS. OPG was also associated with hematuria (p = 0.001), urine pr/cr ratio (p = 0.032), and the presence of anti-dsDNA (p = 0.013). MCP-1 was also associated with the renal VAS (p = 0.032), hematuria (p = 0.027), and presence of anti-dsDNA (p = 0.016) (Table 1).
Mean (SD) log-transformed and normalized (by urine creatinine) OPG and MCP-1, by clinical variables at each visit.
Table 2 shows the relationship between the biomarkers and having a urine pr/cr ≥ 0.5. Among those with medium or high OPG, 46% had urine pr/cr ≥ 0.5, compared to only 23% of those with low OPG (p = 0.032).
Proportion (%) of patient visits with urine protein/creatinine ≥ 0.5 in subgroups defined by level of MCP-1 and OPG (normalized to urine creatinine).
We next studied whether, within a patient, there was an association between changes in the new assays and changes in the urine pr/cr ratio. This analysis included 51 patients with 2 or more measures of MCP-1 and OPG. The “within-person” correlation of urine pr/cr and MCP-1 was positive for 30/51 (p = 0.26, sign test). For OPG, 34/51 were positive (p = 0.024, sign test).
Table 3 shows the sensitivity, specificity, and positive and negative predictive values of various rules defined based on the biomarkers for identifying patients with high levels of renal activity (as defined by renal activity score ≥ 4). The area under the receiver-operation characteristic (ROC) curve for OPG is 0.73. The area under the ROC curve for MCP-1 is 0.66. The area under the ROC curve for a model with both OPG and MCP-1 is 0.74.
Sensitivity, specificity, positive and negative predictive values of various rules for identifying patients with renal activity score ≥ 4 points based on MCP-1 and OPG.
Fourteen patients had a renal biopsy within 1 year of the biomarker measurement. Table 4 shows the relationship between the biomarkers and the biopsy results.
Analysis of renal biopsies by International Society of Nephrology class within 1 year.
Combining the 2 biomarkers also yielded interesting results. The 2 biomarkers were strongly correlated with each other (Spearman correlation coefficient 0.77, p < 0.0001). As a result, the 2 together did not have a substantially stronger correlation with disease activity or urine pr/cr ratio than one alone. As noted, the Spearman correlation coefficient between urine pr/cr and OPG was found to be 0.34. Adding MCP-1 to the model did not improve the correlation (joint correlation coefficient, based on ranked data, 0.34). Similarly, the correlation coefficient between OPG and the renal activity score (0.46) and adding MCP-1 to the model resulted in a joint correlation coefficient of the same magnitude (0.46).
There was not a strong relationship between the biomarkers and either diabetes mellitus or use of ACE inhibitor or angiotensin receptor blocker (Table 1). When we redid the analyses described above after excluding patients with diabetes mellitus and those taking an ACE inhibitor or angiotensin receptor blocker, all the results were qualitatively similar to those reported above.
DISCUSSION
Lupus nephritis occurs in over 50% of patients with SLE and is frequently associated with a poor longterm prognosis. The glomerular filtration apparatus and proximal tubular absorption of ultra-filtered proteins all determine the protein/peptide composition of urine. A diseased kidney may lead to the generation of certain proteins in the urine, either in an intact form or more likely as peptide fragments. In either case, identifying these proteins/peptides would help identify the pathologic process and could lead in the future to primary or secondary preventive measures. Serum complement levels (C3 and C4) and anti-double-stranded DNA are most commonly used to evaluate lupus renal flares, but the results are controversial30–32. Renal biopsy, although the gold standard, carries its own risks. There is an immediate need of noninvasive markers that associate with renal activity and carry minimal risk to the patient.
In one previous study, OPG levels decreased significantly to normal 3 months after successful renal transplant (from 10.05 ± 4.77 pmol/l to 4.59 ± 2.26 pmol/l)33. In human SLE, urinary levels of MCP-1 were markedly elevated in patients with lupus nephritis and the presence of MCP-1 in urine reflected intrarenal expression21–23. Other studies have shown a decrease in urine MCP-1 levels with treatment34–38.
Our study is the first to show OPG to be a significant associate of renal activity in SLE patients. OPG levels were strongly associated with the renal VAS, urine pr/cr ratio, hematuria, and the presence of anti-dsDNA. Medium or high levels of OPG were associated with a urine pr/cr ratio of ≥ 0.5. Our study verifies previous reports of increased urine MCP-1 in SLE34,36,39. In our study, MCP-1 was also associated with renal disease activity descriptors, including hematuria, and with a positive anti-dsDNA.
These preliminary results demonstrate the potential of both these assays, which might have utility in the identification of patients with lupus having continuing subclinical renal activity, or conversely, in identifying patients who do not need a kidney biopsy. Since renal pathology can change over time, further study with larger numbers of SLE patients, including longitudinal assessment and correlation with concurrent renal biopsies, is necessary before these assays can be used in the routine clinic setting. We also did not have sufficient numbers to distinguish between the presence and absence of a lupus nephritis flare; these are the limitations of our study.
This was the largest study to date of urinary OPG and MCP-1 in SLE, and highlights the importance of and need for urine biomarkers in SLE. The lack of availability of urine biomarkers has hampered development of new therapies for lupus nephritis. Validation of these urine biomarkers with concurrent renal biopsies might allow them to be used as surrogate outcomes in future lupus nephritis trials and in routine SLE care.
Footnotes
-
The Hopkins Lupus Cohort is supported by a grant from the National Institutes of Health (NIH AR43727). This publication was also made possible by grant no. UL1 RR 025005 from the National Center for Research Resources (NCRR).
- Accepted for publication May 19, 2009.


